

Mitsubishi Heavy Industries Split Klimaanlage
-
@mrlarodos welche Version hast du laufen?
geht heute bei mir so weiter... das andere Gerät (extra Instanz) im Wohnzimmer verhält sich ruhig.
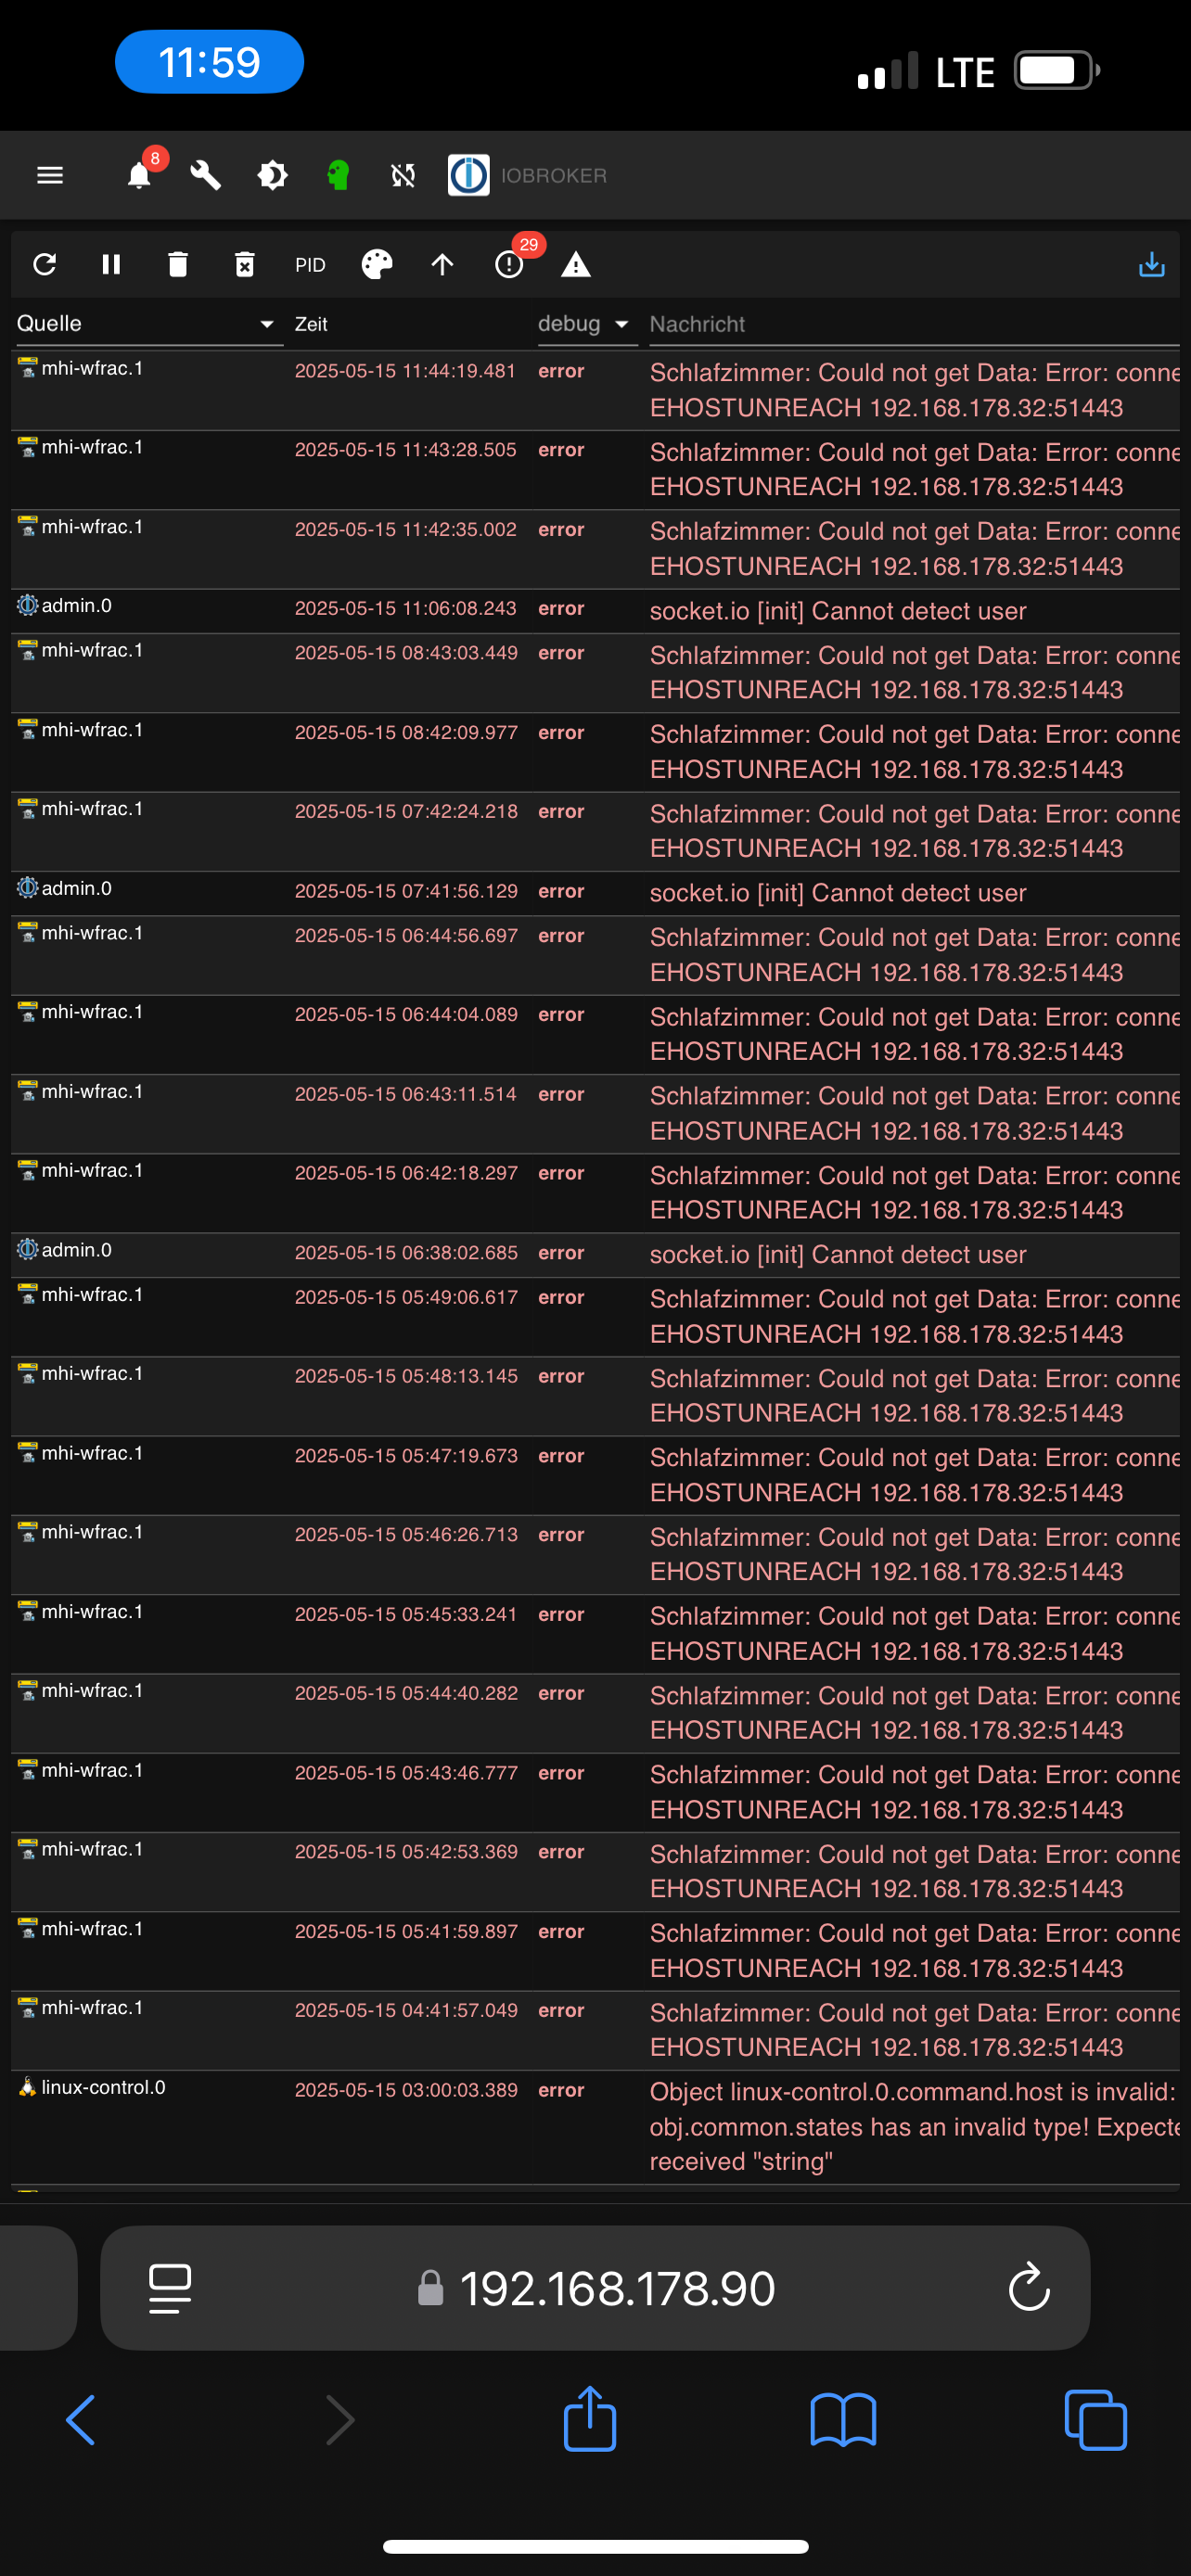
mhi-wfrac.1 2025-05-15 07:42:24.218 error Schlafzimmer: Could not get Data: Error: connect EHOSTUNREACH 192.168.178.32:51443 mhi-wfrac.1 2025-05-15 06:44:56.697 error Schlafzimmer: Could not get Data: Error: connect EHOSTUNREACH 192.168.178.32:51443 mhi-wfrac.1 2025-05-15 06:44:04.089 error Schlafzimmer: Could not get Data: Error: connect EHOSTUNREACH 192.168.178.32:51443 mhi-wfrac.1 2025-05-15 06:43:11.514 error Schlafzimmer: Could not get Data: Error: connect EHOSTUNREACH 192.168.178.32:51443 mhi-wfrac.1 2025-05-15 06:42:18.297 error Schlafzimmer: Could not get Data: Error: connect EHOSTUNREACH 192.168.178.32:51443 mhi-wfrac.1 2025-05-15 05:49:06.617 error Schlafzimmer: Could not get Data: Error: connect EHOSTUNREACH 192.168.178.32:51443 mhi-wfrac.1 2025-05-15 05:48:13.145 error Schlafzimmer: Could not get Data: Error: connect EHOSTUNREACH 192.168.178.32:51443 mhi-wfrac.1 2025-05-15 05:47:19.673 error Schlafzimmer: Could not get Data: Error: connect EHOSTUNREACH 192.168.178.32:51443 mhi-wfrac.1 2025-05-15 05:46:26.713 error Schlafzimmer: Could not get Data: Error: connect EHOSTUNREACH 192.168.178.32:51443 mhi-wfrac.1 2025-05-15 05:45:33.241 error Schlafzimmer: Could not get Data: Error: connect EHOSTUNREACH 192.168.178.32:51443 mhi-wfrac.1 2025-05-15 05:44:40.282 error Schlafzimmer: Could not get Data: Error: connect EHOSTUNREACH 192.168.178.32:51443 mhi-wfrac.1 2025-05-15 05:43:46.777 error Schlafzimmer: Could not get Data: Error: connect EHOSTUNREACH 192.168.178.32:51443 mhi-wfrac.1 2025-05-15 05:42:53.369 error Schlafzimmer: Could not get Data: Error: connect EHOSTUNREACH 192.168.178.32:51443 mhi-wfrac.1 2025-05-15 05:41:59.897 error Schlafzimmer: Could not get Data: Error: connect EHOSTUNREACH 192.168.178.32:51443 mhi-wfrac.1 2025-05-15 04:41:57.049 error Schlafzimmer: Could not get Data: Error: connect EHOSTUNREACH 192.168.178.32:51443 mhi-wfrac.1 2025-05-15 02:41:50.521 error Schlafzimmer: Could not get Data: Error: connect EHOSTUNREACH 192.168.178.32:51443 mhi-wfrac.1 2025-05-15 01:42:04.185 error Schlafzimmer: Could not get Data: Error: connect EHOSTUNREACH 192.168.178.32:51443 mhi-wfrac.1 2025-05-15 00:41:40.378 error Schlafzimmer: Could not get Data: Error: connect EHOSTUNREACH 192.168.178.32:51443 -
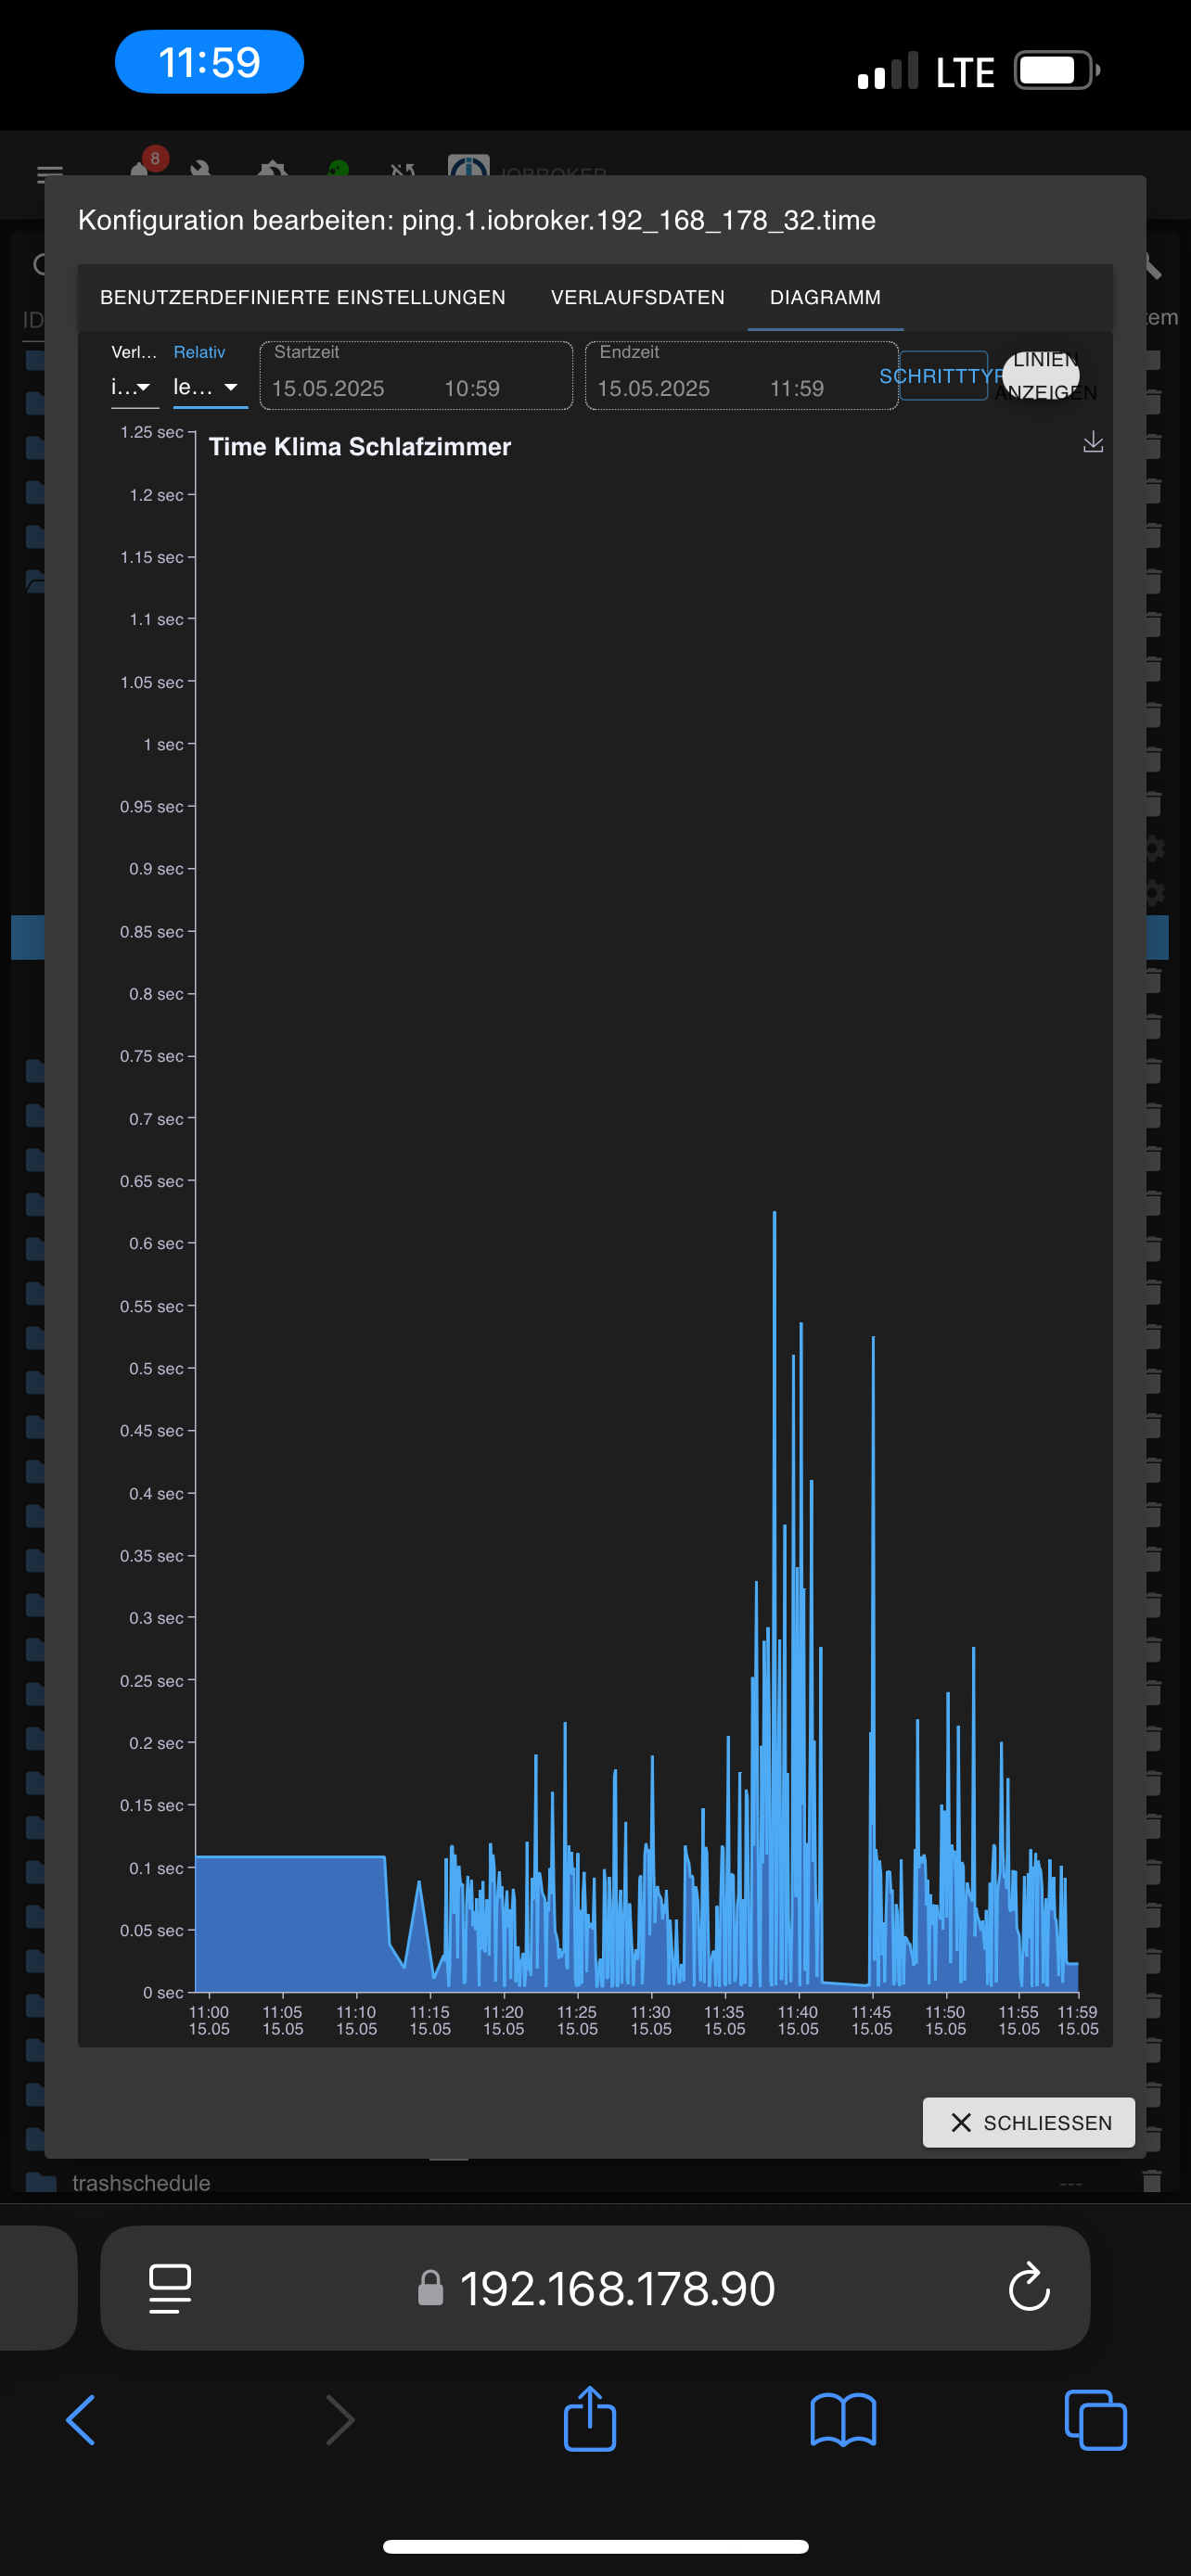
Ich hab mal ein Monitoring auf meine Geräte aktiviert.
Hier sieht man durchaus ein paar Peaks (Monitoring geht auf Max, nicht auf Mittelwert - man sieht also immer den schlechtesten).
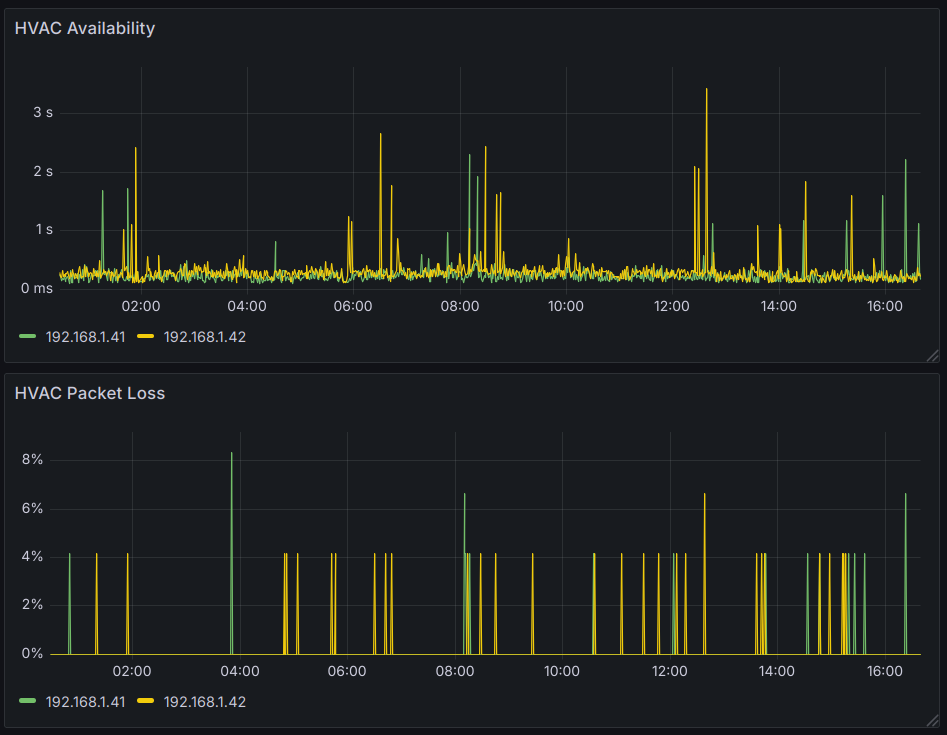
Wenn man genauer reinzoomt, erkennt man, dass diese für einen Ping anhalten und der nächste Ping (10s später) geht wieder schnell:
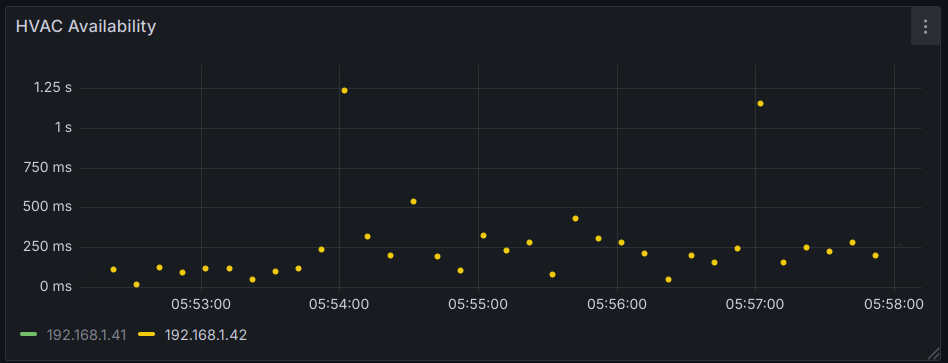
Das heißt, wenn das ein Restart gewesen sein sollte, geht er in <10s und hat dann auch wieder die Verbindung aufgebaut. Bei mir sehe ich die Log Einträge nicht, auch lässt sich dieses Stundenmuster nicht aus dem Monitoring ableiten.
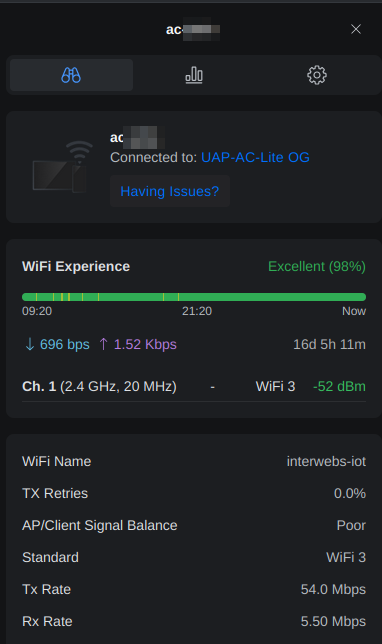
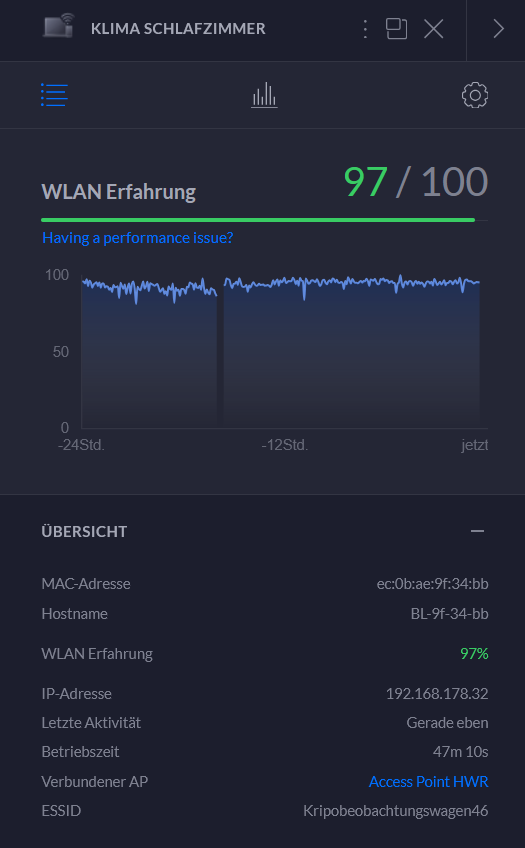
Unifi Client Daten sind nicht hervorragend, man sieht ein paar gelbe Striche aber in Summe Ok.
Wie sieht eure Verbindungsqualität aus? Wie lange dauert es bei euch, bis das Gerät wieder erreichbar ist? Evtl. trägt die Verbindungsqualität dazu bei, dass das Gerät länger offline ist? Evtl. ist der reconnect langsamer?
-
Ich hab mal ein Monitoring auf meine Geräte aktiviert.
Hier sieht man durchaus ein paar Peaks (Monitoring geht auf Max, nicht auf Mittelwert - man sieht also immer den schlechtesten).
Wenn man genauer reinzoomt, erkennt man, dass diese für einen Ping anhalten und der nächste Ping (10s später) geht wieder schnell:
Das heißt, wenn das ein Restart gewesen sein sollte, geht er in <10s und hat dann auch wieder die Verbindung aufgebaut. Bei mir sehe ich die Log Einträge nicht, auch lässt sich dieses Stundenmuster nicht aus dem Monitoring ableiten.
Unifi Client Daten sind nicht hervorragend, man sieht ein paar gelbe Striche aber in Summe Ok.
Wie sieht eure Verbindungsqualität aus? Wie lange dauert es bei euch, bis das Gerät wieder erreichbar ist? Evtl. trägt die Verbindungsqualität dazu bei, dass das Gerät länger offline ist? Evtl. ist der reconnect langsamer?
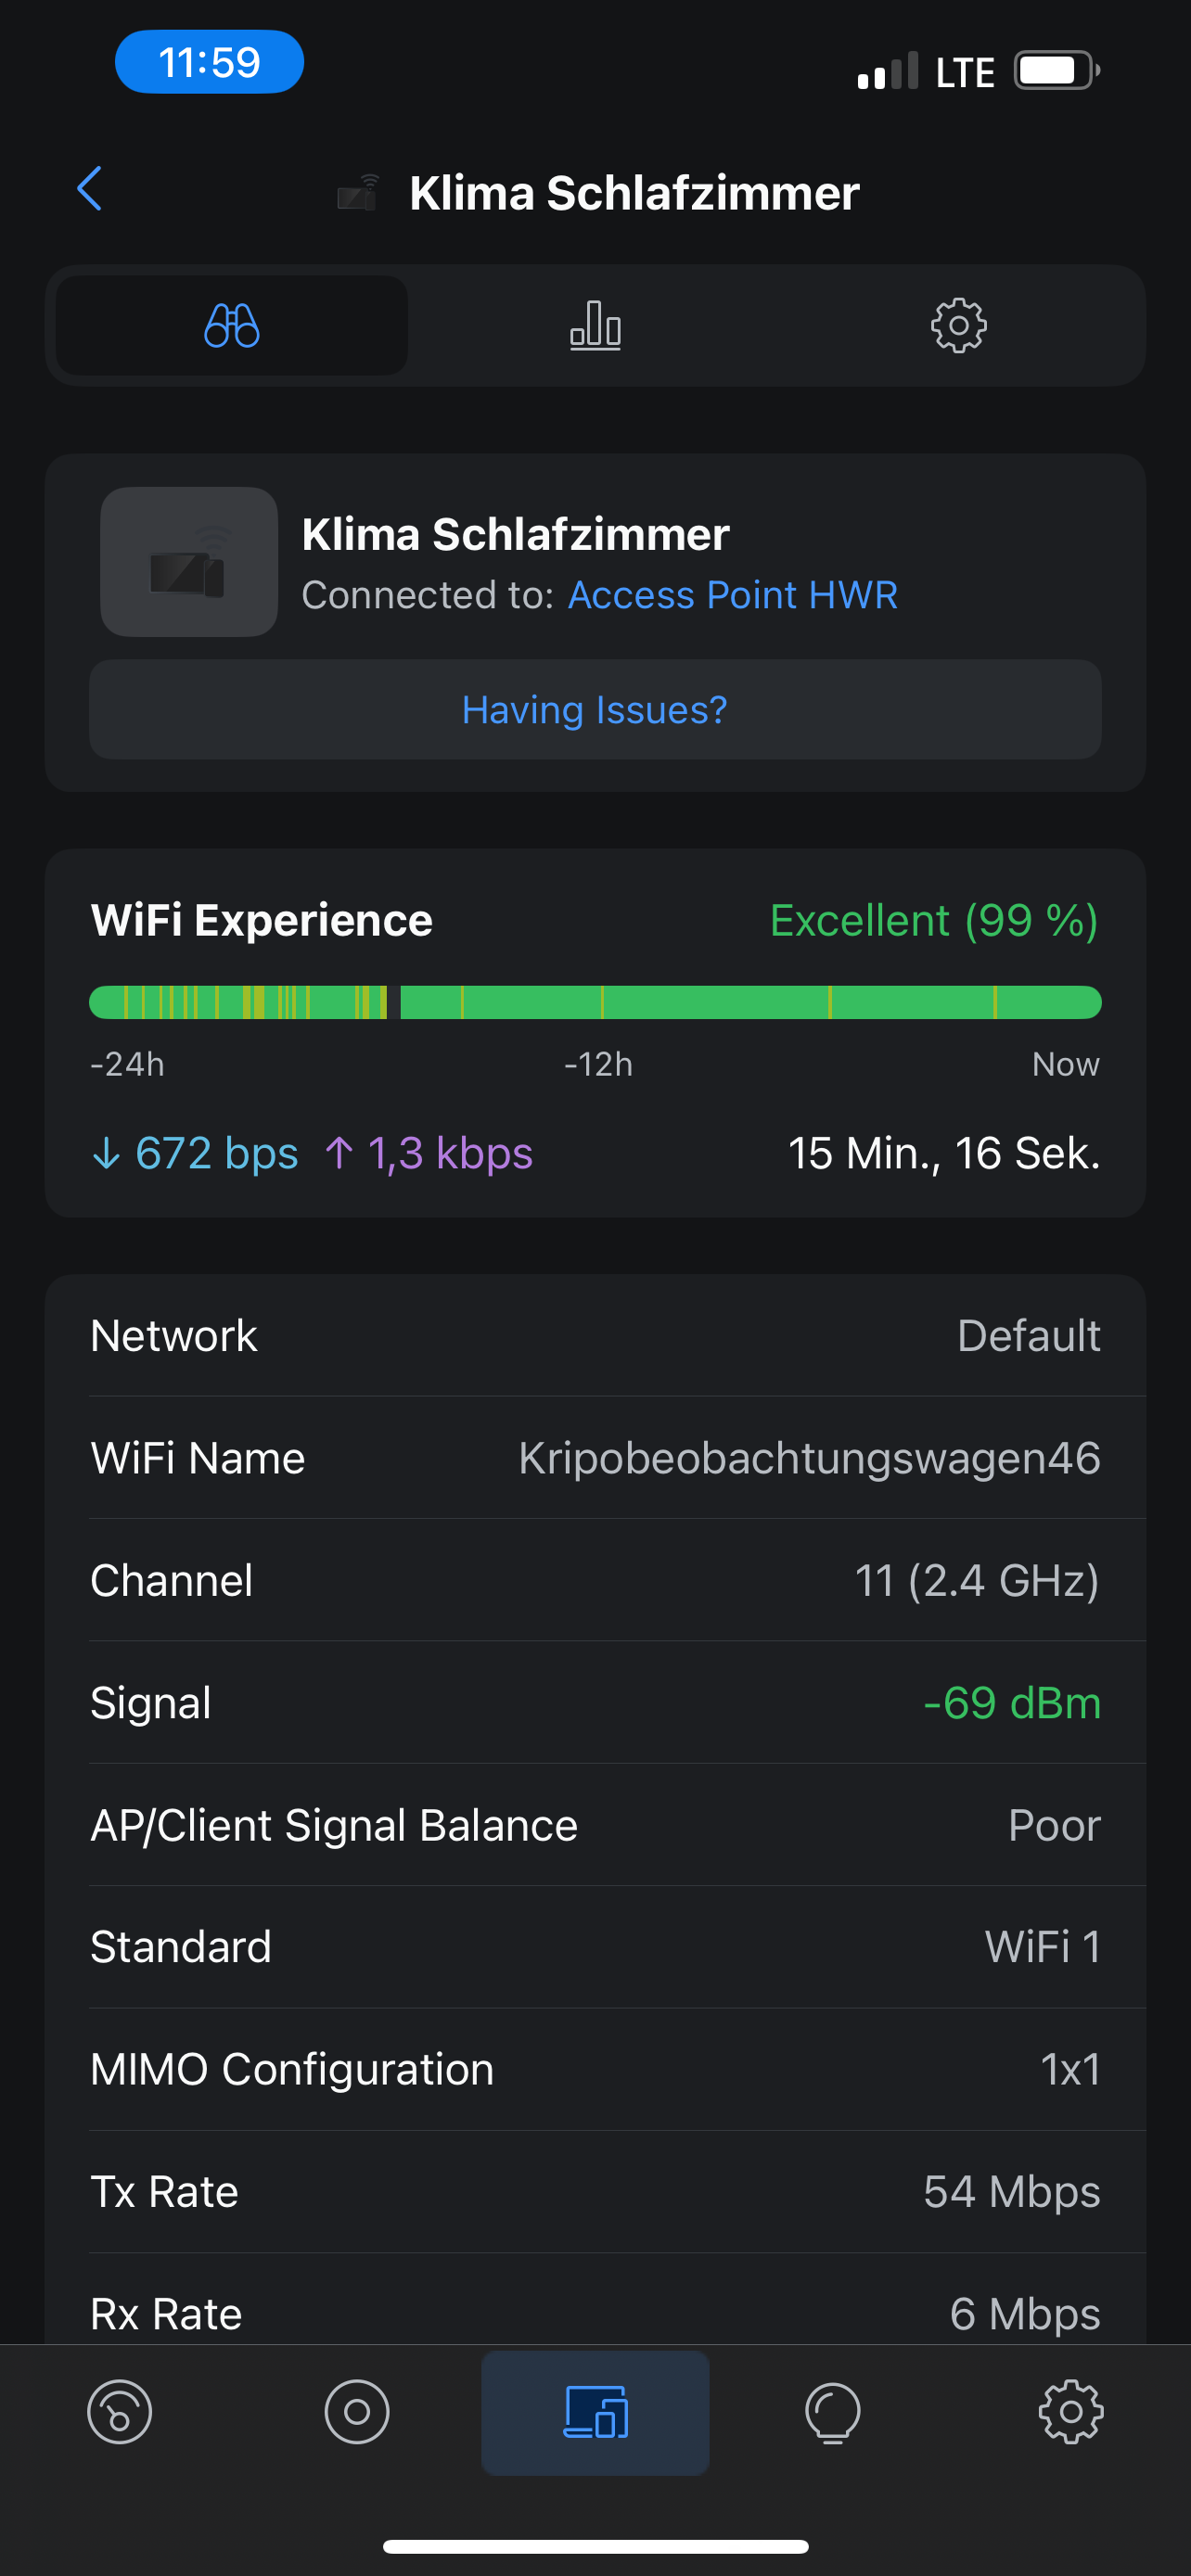
So siehts bei mir aus. Bei dem kurzen Aussetzer bin ich auf einen anderen AP gewechselt der zwar weiter weg ist, aber im Moment scheint es stabiler zu laufen.
-
So siehts bei mir aus. Bei dem kurzen Aussetzer bin ich auf einen anderen AP gewechselt der zwar weiter weg ist, aber im Moment scheint es stabiler zu laufen.
@saeft_2003 Sieht ja nicht so schlecht aus - kannst du ein Monitoring aufsetzen um die Dauer der Reconnects zu messen?
-
@saeft_2003 Sieht ja nicht so schlecht aus - kannst du ein Monitoring aufsetzen um die Dauer der Reconnects zu messen?
Wüsste jetzt auf anhieb nicht wie ich das mache. Wenn dann müsstest du mir mal grob sagen wie genau das geht...
Noch eine andere Frage. Wenn der Adapter gelb ist, versucht dieser dann in einem bestimmten Intervall sich wieder zu verbinden? Weil ich hatte es vor kurzem das der Adapter gelb war, hab diesen dann neugestartet und zack grün.
-
Wüsste jetzt auf anhieb nicht wie ich das mache. Wenn dann müsstest du mir mal grob sagen wie genau das geht...
Noch eine andere Frage. Wenn der Adapter gelb ist, versucht dieser dann in einem bestimmten Intervall sich wieder zu verbinden? Weil ich hatte es vor kurzem das der Adapter gelb war, hab diesen dann neugestartet und zack grün.
@saeft_2003 Es wird im angegebenen Interval abgefragt. Bei einer erfolgreichen Abfrage wird der Datenpunkt "online" auf true gesetzt. Bei jedem Intervall werden am Ende alle online Datenpunkte evaluiert und sofern alle true sind, wird der Gesamstatus auch aktualisiert. So sollte sich der Zustand auch ohne Neustart wieder fangen. Du könntest das nächste mal schauen, ob alle online Datenpunkte der aktiven Geräte true sind und der Adapterzustand dennoch gelb.
-
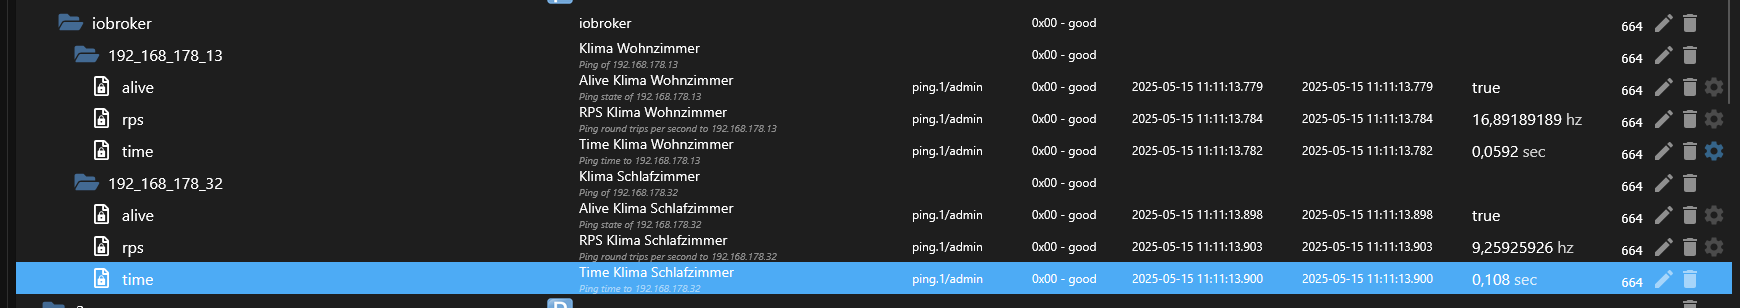
Ich habe eine telegraf config für influxdb erstellt und visualisiere dann mit Grafana.
Es scheint aber auch einen ping Adapter zu geben, das zusammen mit dem History Feature von iobroker sollte ein ähnliches Ergebnis liefern.
@hacki11 sagte in Mitsubishi Heavy Industries Split Klimaanlage:
Ich habe eine telegraf config für influxdb erstellt und visualisiere dann mit Grafana.
Es scheint aber auch einen ping Adapter zu geben, das zusammen mit dem History Feature von iobroker sollte ein ähnliches Ergebnis liefern.
Den ping andapter hab ich laufen, aber woher kommt die Zeit wie lang der ping gebraucht hat? Beim Adapter bekomme ich doch nur true oder false? -
@saeft_2003 Es wird im angegebenen Interval abgefragt. Bei einer erfolgreichen Abfrage wird der Datenpunkt "online" auf true gesetzt. Bei jedem Intervall werden am Ende alle online Datenpunkte evaluiert und sofern alle true sind, wird der Gesamstatus auch aktualisiert. So sollte sich der Zustand auch ohne Neustart wieder fangen. Du könntest das nächste mal schauen, ob alle online Datenpunkte der aktiven Geräte true sind und der Adapterzustand dennoch gelb.
@hacki11 sagte in Mitsubishi Heavy Industries Split Klimaanlage:
@saeft_2003 Es wird im angegebenen Interval abgefragt. Bei einer erfolgreichen Abfrage wird der Datenpunkt "online" auf true gesetzt. Bei jedem Intervall werden am Ende alle online Datenpunkte evaluiert und sofern alle true sind, wird der Gesamstatus auch aktualisiert. So sollte sich der Zustand auch ohne Neustart wieder fangen. Du könntest das nächste mal schauen, ob alle online Datenpunkte der aktiven Geräte true sind und der Adapterzustand dennoch gelb.
Alles klar falls das wieder vorkommt mache ich das.
-
Denke ich habs. Intervall ping alle 60 sek?
-
@saeft_2003 Jede Sekunde
-
@saeft_2003 Jede Sekunde
Das lässt der ping adapter nicht zu. kürzester intervall sind alle 5 sek.
-
Das lässt der ping adapter nicht zu. kürzester intervall sind alle 5 sek.
@saeft_2003 passt auch noch
-
@saeft_2003 passt auch noch
Alles klar ich lass das mal bis morgen so laufen und schau ob ich in grafana was sehe und melde mich.
-
-
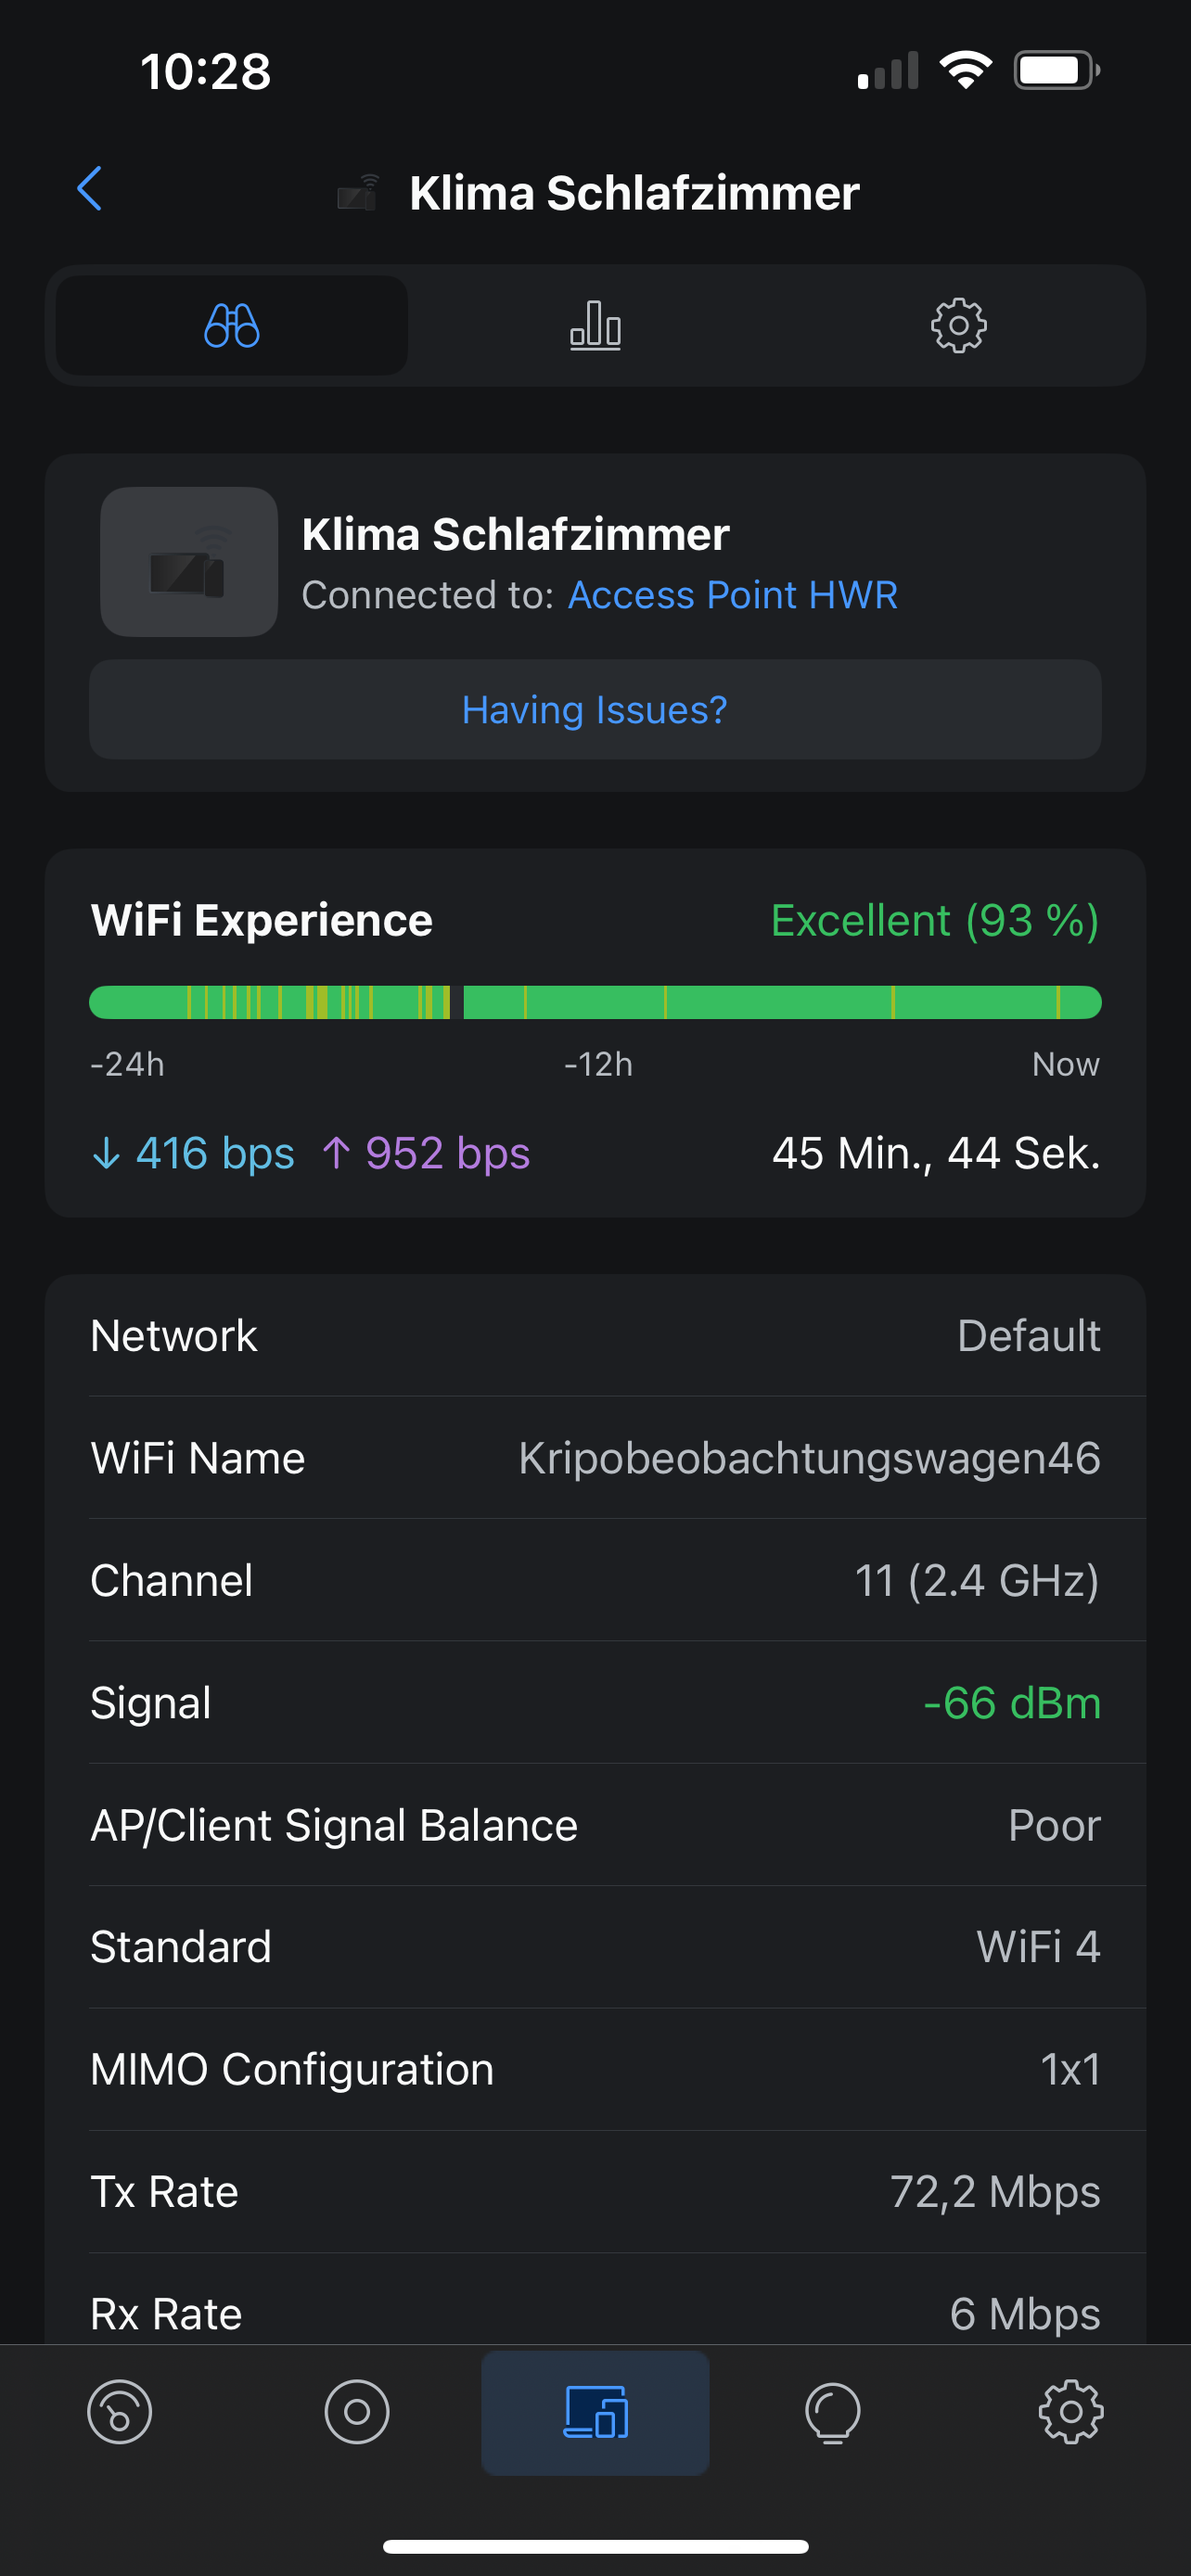
Das sieht mir nach einer schlechten WLAN-Verbindung aus.
-
@saeft_2003 Nimm mal den alive mit in die history auf. Aber man sieht schon schön ne Lücke in dem Graphen. Vermutlich gab’s keine Werte und es wird linear mit dem ersten Ping der wiederkommt verbunden? Zumindest würde das den Graphen erklären.
-
Ich hab die Klima jetzt wieder auf den AP gelockt der theoretisch am besten ist. Normalerweise muss die Verbindung hier top sein. Luftlinie ist der nur 2m weg und nur dünne Wände dazwischen. Andere Geräte zum Teil weiter weg haben null Probleme.
-
Ich hab die Klima jetzt wieder auf den AP gelockt der theoretisch am besten ist. Normalerweise muss die Verbindung hier top sein. Luftlinie ist der nur 2m weg und nur dünne Wände dazwischen. Andere Geräte zum Teil weiter weg haben null Probleme.
-
@saeft_2003 Mein IG nimmt auch immer den weiter entfernten AP statt dem der 4m entfernt steht. Roaming ist in dem WLAN deaktiviert, da viele IOT Geräte damit nicht klar kommen. Das IG vermutlich gleich dreimal nicht.
@hacki11 Ich habe das WLAN so konfiguriert, dass die Geräte in einem separaten WLAN in 2.4Ghz am jeweils nächstliegenden AP eingesperrt sind. Habe kurz ein Shellscript für Linux mit Chat GPT entwickelt, was ne csv mitloggt (im Subfolder "Log" im Scriptordner. Inhalt der CSV:
Name;Zeitstempel;Erreichbar;Zeit(ms)
Klima-Spitzboden;2025-05-15 13:39:18;True;30.4
Klima-K1;2025-05-15 13:39:18;True;85.3
Klima-K2;2025-05-15 13:39:18;True;95.8
Ist auch ein Billigfrontend drauf:
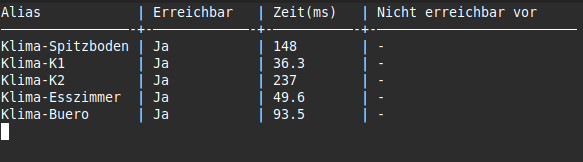
Hier das Script (IPs und Aliase anpassen!):
#!/bin/bash

# Intervall in Sekunden
INTERVAL=5

# IP-Adressen und Aliasnamen
IPS=("192.168.120.135" "192.168.120.138" "192.168.120.137" "192.168.120.136" "192.168.120.166")
ALIASES=("Klima-Spitzboden" "Klima-K1" "Klima-K2" "Klima-Esszimmer" "Klima-Buero")

# Logging-Verzeichnis und -Datei
SCRIPT_DIR="$(cd "$(dirname "${BASH_SOURCE[0]}")" && pwd)"
LOG_DIR="$SCRIPT_DIR/log"
CSV_FILE="$LOG_DIR/ping_log.csv"
mkdir -p "$LOG_DIR"

# CSV-Datei initialisieren, falls noch nicht vorhanden
if [ ! -f "$CSV_FILE" ]; then
    echo "Name;Zeitstempel;Erreichbar;Zeit(ms)" >> "$CSV_FILE"
fi

# Statusspeicher
declare -A LAST_RESPONSE
declare -A LAST_SEEN_DOWN

# Spaltenbreiten
WIDTH_ALIAS=20
WIDTH_REACH=12
WIDTH_TIME=10
WIDTH_LASTDOWN=25

# Initialisieren
for alias in "${ALIASES[@]}"; do
    LAST_RESPONSE["$alias"]="-"
    LAST_SEEN_DOWN["$alias"]="-"
done

# Letzte bekannte False-Zeiten aus CSV rekonstruieren
if [ -f "$CSV_FILE" ]; then
    for alias in "${ALIASES[@]}"; do
        last_false=$(grep "^$alias;" "$CSV_FILE" | grep ";False;" | tail -n 1 | cut -d';' -f2)
        if [ -n "$last_false" ]; then
            epoch=$(date -d "$last_false" +%s 2>/dev/null)
            if [ -n "$epoch" ]; then
                LAST_SEEN_DOWN["$alias"]=$epoch
            fi
        fi
    done
fi

# Funktion für menschenlesbare Zeitangabe
time_diff_human() {
    local last_time=$1
    [[ "$last_time" == "-" ]] && echo "-" && return
    local now=$(date +%s)
    local diff=$((now - last_time))
    (( diff < 60 )) && echo "vor $diff Sek." && return
    (( diff < 3600 )) && echo "vor $((diff / 60)) Min." && return
    echo "vor $((diff / 3600)) Std."
}

# Hauptschleife
while true; do
    clear

    printf "%-${WIDTH_ALIAS}s | %-${WIDTH_REACH}s | %-${WIDTH_TIME}s | %-${WIDTH_LASTDOWN}s\n" "Alias" "Erreichbar" "Zeit(ms)" "Nicht erreichbar vor"
    printf "%-${WIDTH_ALIAS}s-+-%-${WIDTH_REACH}s-+-%-${WIDTH_TIME}s-+-%-${WIDTH_LASTDOWN}s\n" \
        "$(printf '─%.0s' $(seq 1 $WIDTH_ALIAS))" \
        "$(printf '─%.0s' $(seq 1 $WIDTH_REACH))" \
        "$(printf '─%.0s' $(seq 1 $WIDTH_TIME))" \
        "$(printf '─%.0s' $(seq 1 $WIDTH_LASTDOWN))"

    for i in "${!IPS[@]}"; do
        IP=${IPS[$i]}
        NAME=${ALIASES[$i]}
        TIMESTAMP_HUMAN=$(date '+%Y-%m-%d %H:%M:%S')
        TIMESTAMP_EPOCH=$(date +%s)
        PING_OUTPUT=$(ping -c 1 -W 1 "$IP" 2>/dev/null)

        if echo "$PING_OUTPUT" | grep -q "1 received"; then
            TIME_MS=$(echo "$PING_OUTPUT" | grep "time=" | sed -E 's/.*time=([0-9.]+) ms/\1/')
            LAST_RESPONSE["$NAME"]=$TIME_MS
            REACH="Ja"
            DOWNTIME=$(time_diff_human "${LAST_SEEN_DOWN[$NAME]}")
            echo "$NAME;$TIMESTAMP_HUMAN;True;$TIME_MS" >> "$CSV_FILE"
        else
            REACH="Nein"
            TIME_MS="-"
            if [[ "${LAST_SEEN_DOWN[$NAME]}" == "-" ]]; then
                LAST_SEEN_DOWN["$NAME"]=$TIMESTAMP_EPOCH
            fi
            DOWNTIME=$(time_diff_human "${LAST_SEEN_DOWN[$NAME]}")
            echo "$NAME;$TIMESTAMP_HUMAN;False;" >> "$CSV_FILE"
        fi

        printf "%-${WIDTH_ALIAS}s | %-${WIDTH_REACH}s | %-${WIDTH_TIME}s | %-${WIDTH_LASTDOWN}s\n" \
            "$NAME" "$REACH" "${LAST_RESPONSE[$NAME]}" "$DOWNTIME"
    done

    sleep "$INTERVAL"
done
Falls Ihr irgendwo Linux habt, könnt Ihr das da laufen lassen.
Und hier das Script, um die CSV als Bild darzustellen:
#!/usr/bin/env python3

import pandas as pd
import matplotlib.pyplot as plt
from datetime import timedelta
import matplotlib.dates as mdates
import os

# 🕒 Benutzerabfrage zum Stundenbereich
try:
    user_input = input("Wie viele Stunden zurück anzeigen? [Default: 24]: ").strip()
    MAX_HOURS = int(user_input) if user_input else 24
except Exception:
    MAX_HOURS = 24

# 📥 CSV einlesen
CSV_PATH = "./log/ping_log.csv"
df = pd.read_csv(CSV_PATH, sep=';')
df['Zeitstempel'] = pd.to_datetime(df['Zeitstempel'], format="%Y-%m-%d %H:%M:%S")
df['Farbe'] = df['Erreichbar'].apply(lambda x: 'green' if str(x).strip().lower() == 'true' else 'red')
df['Erreichbar_bool'] = df['Erreichbar'].apply(lambda x: str(x).strip().lower() == 'true')

# 🧭 Zeitbereich setzen
latest_time = df['Zeitstempel'].max()
earliest_time = df['Zeitstempel'].min()
start_time = max(earliest_time, latest_time - timedelta(hours=MAX_HOURS))
df = df[df['Zeitstempel'] >= start_time].copy()

# 📋 Aliasnamen extrahieren
aliases = df['Name'].unique()
aliases_sorted = list(aliases)

# 📁 Diagrammverzeichnis erstellen
output_dir = "./diagramm_pix"
os.makedirs(output_dir, exist_ok=True)

# 📊 Plot vorbereiten
fig, ax = plt.subplots(figsize=(14, len(aliases_sorted) * 1.2))

def plot_status_blocks(data, y_pos):
    current_color = None
    block_start = None
    for _, row in data.iterrows():
        color = row['Farbe']
        timestamp = row['Zeitstempel']
        if color != current_color:
            if current_color is not None:
                duration = (timestamp - block_start).total_seconds()
                ax.barh(
                    y=y_pos,
                    width=duration / 3600,
                    left=block_start,
                    height=0.6,
                    color=current_color,
                    edgecolor='none'
                )
            block_start = timestamp
            current_color = color
    if block_start is not None and current_color is not None:
        duration = (latest_time - block_start).total_seconds()
        ax.barh(
            y=y_pos,
            width=duration / 3600,
            left=block_start,
            height=0.6,
            color=current_color,
            edgecolor='none'
        )

for i, alias in enumerate(aliases_sorted):
    data = df[df['Name'] == alias].sort_values(by='Zeitstempel')
    plot_status_blocks(data, i)

# 📐 Achsen und Format
ax.set_yticks(range(len(aliases_sorted)))
ax.set_yticklabels(aliases_sorted)
ax.set_xlim(start_time, latest_time)
ax.invert_yaxis()
ax.xaxis.set_major_formatter(mdates.DateFormatter('%H:%M'))
ax.set_xlabel("Uhrzeit")
ax.set_title("Erreichbarkeit der IPs – zusammenhängende Zustandsbereiche")
plt.grid(axis='x', linestyle='--', alpha=0.5)
plt.tight_layout()

# 💾 Bild speichern
image_filename = f"{output_dir}/ping_status_{latest_time.strftime('%Y%m%d_%H%M%S')}.png"
plt.savefig(image_filename)
plt.show()

# 📋 Zusammenfassung pro Alias
print("\nZusammenfassung:")
total_minutes = MAX_HOURS * 60

for alias in aliases_sorted:
    alias_data = df[df['Name'] == alias].sort_values(by='Zeitstempel')
    alias_data['diff'] = alias_data['Zeitstempel'].diff().dt.total_seconds().fillna(0)

    # Statuswechsel ermitteln
    alias_data['is_new_block'] = (alias_data['Erreichbar_bool'] != alias_data['Erreichbar_bool'].shift())
    alias_data['block_id'] = alias_data['is_new_block'].cumsum()

    # Offline-Blöcke
    false_blocks = alias_data[alias_data['Erreichbar_bool'] == False]
    grouped = false_blocks.groupby('block_id')

    total_offline_secs = grouped['diff'].sum().sum()
    total_offline_minutes = round(total_offline_secs / 60, 2)

    total_outages = grouped.ngroups
    outages_per_hour = round(total_outages / MAX_HOURS, 2)
    avg_offline_per_hour = round(total_offline_minutes / MAX_HOURS, 2)

    # Antwortzeiten nur bei True
    true_responses = alias_data[alias_data['Erreichbar_bool'] == True].copy()
    true_responses['Zeit(ms)'] = pd.to_numeric(true_responses['Zeit(ms)'], errors='coerce')
    min_time = round(true_responses['Zeit(ms)'].min(), 2)
    avg_time = round(true_responses['Zeit(ms)'].mean(), 2)
    max_time = round(true_responses['Zeit(ms)'].max(), 2)

    print(f"{alias}:")
    print(f"  Gesamtofflinezeit:       {total_offline_minutes:.2f} Min")
    print(f"  Ø Offlinezeit/Stunde:    {avg_offline_per_hour:.2f} Min")
    print(f"  Gesamtzahl Ausfälle:     {total_outages}")
    print(f"  Ø Ausfälle/Stunde:       {outages_per_hour}")
    print(f"  Antwortzeit (Min/Ø/Max): {min_time:.2f} / {avg_time:.2f} / {max_time:.2f} ms\n")
«Underground werden mit Stil»
Hey! Du scheinst an dieser Unterhaltung interessiert zu sein, hast aber noch kein Konto.
Hast du es satt, bei jedem Besuch durch die gleichen Beiträge zu scrollen? Wenn du dich für ein Konto anmeldest, kommst du immer genau dorthin zurück, wo du zuvor warst, und kannst dich über neue Antworten benachrichtigen lassen (entweder per E-Mail oder Push-Benachrichtigung). Du kannst auch Lesezeichen speichern und Beiträge positiv bewerten, um anderen Community-Mitgliedern deine Wertschätzung zu zeigen.
Mit deinem Input könnte dieser Beitrag noch besser werden 💗
Registrieren Anmelden194
Online33.0k
Benutzer83.5k
Themen1.3m
Beiträge