


SVG Animation: Regentonne mit animierter Wasserlinie
-
Hallo liebes IOBroker Forum,
für mein VIS-2 Projekt möchte ich folgendes erreichen.
Ich habe für meine Gartenbewässerung in einer Zisterne einen Füllstandssensor eingebaut, der mir den Füllstand überwacht und an IOBroker sendet.
Ich möchte für die VIS jetzt den Tank inkl. Füllstand darstellen und dies abhängig vom realen Füllstand und als "Sahnestück" eine Wasserlinien Animation einbauen.
Vorlage für die Wasserlinie:
https://codepen.io/creativejeff/pen/vYLLEBrPath Definition des Regentanks:
<path
         fill="#545454"
         d="M 85.242188 222.296875 C 85.835938 221.679688 85.835938 220.703125 85.242188 220.085938 C 84.519531 219.339844 83.523438 218.917969 82.488281 218.917969 L 37.875 218.917969 C 36.835938 218.917969 35.839844 219.339844 35.117188 220.085938 C 34.523438 220.703125 34.523438 221.679688 35.117188 222.296875 C 35.402344 222.589844 35.398438 223.054688 35.109375 223.34375 C 34.824219 223.628906 34.816406 224.097656 35.101562 224.390625 L 36.457031 225.789062 C 36.457031 225.789062 36.457031 225.789062 36.457031 225.792969 C 36.527344 225.863281 36.566406 225.953125 36.5625 226.054688 C 36.558594 226.09375 36.558594 226.132812 36.558594 226.171875 C 35.015625 244.800781 34.769531 262.308594 36.558594 278.066406 C 36.558594 282.582031 40.21875 286.242188 44.734375 286.242188 L 75.625 286.242188 C 80.140625 286.242188 83.800781 282.582031 83.800781 278.066406 C 85.542969 261.679688 85.34375 244.28125 83.800781 226.171875 C 83.800781 226.132812 83.800781 226.09375 83.796875 226.054688 C 83.792969 225.953125 83.835938 225.863281 83.902344 225.792969 C 83.902344 225.789062 83.902344 225.789062 83.902344 225.789062 L 85.402344 224.238281 C 85.699219 223.933594 85.628906 223.53125 85.25 223.34375 C 84.871094 223.152344 84.800781 222.75 85.097656 222.445312 L 85.242188 222.296875 "
         fill-opacity="1"
         fill-rule="nonzero"
         id="Regentonne" />
Gesamtprojekt:
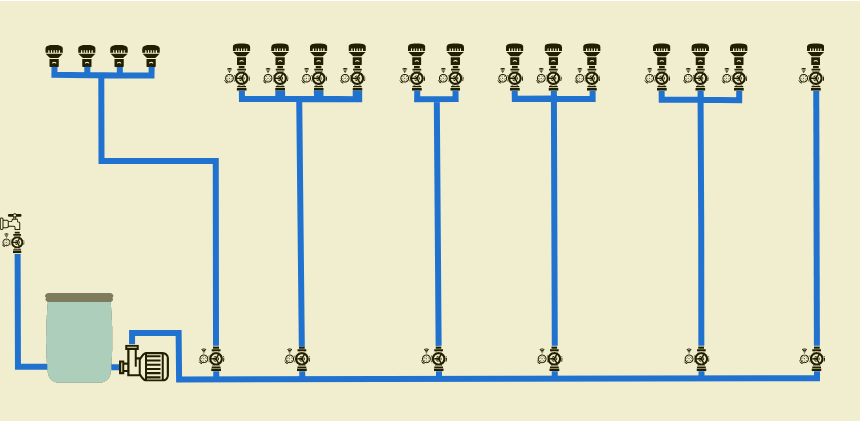
Da ich leider nicht so viel Ahnung von SVG Animationen habe würde ich Euch gerne um ein paar Tipps bitten. Ich könnte mir vorstellen, dass es mit AnimateMotion geht oder per CSS mit keyframes wie im Beispiel. Ich weiß nur nicht wie man die Waveform in die Regentonne setzen kann. Und wie würde das dann dynamisch mit dem Füllstand funktionieren?
Vielen Dank!
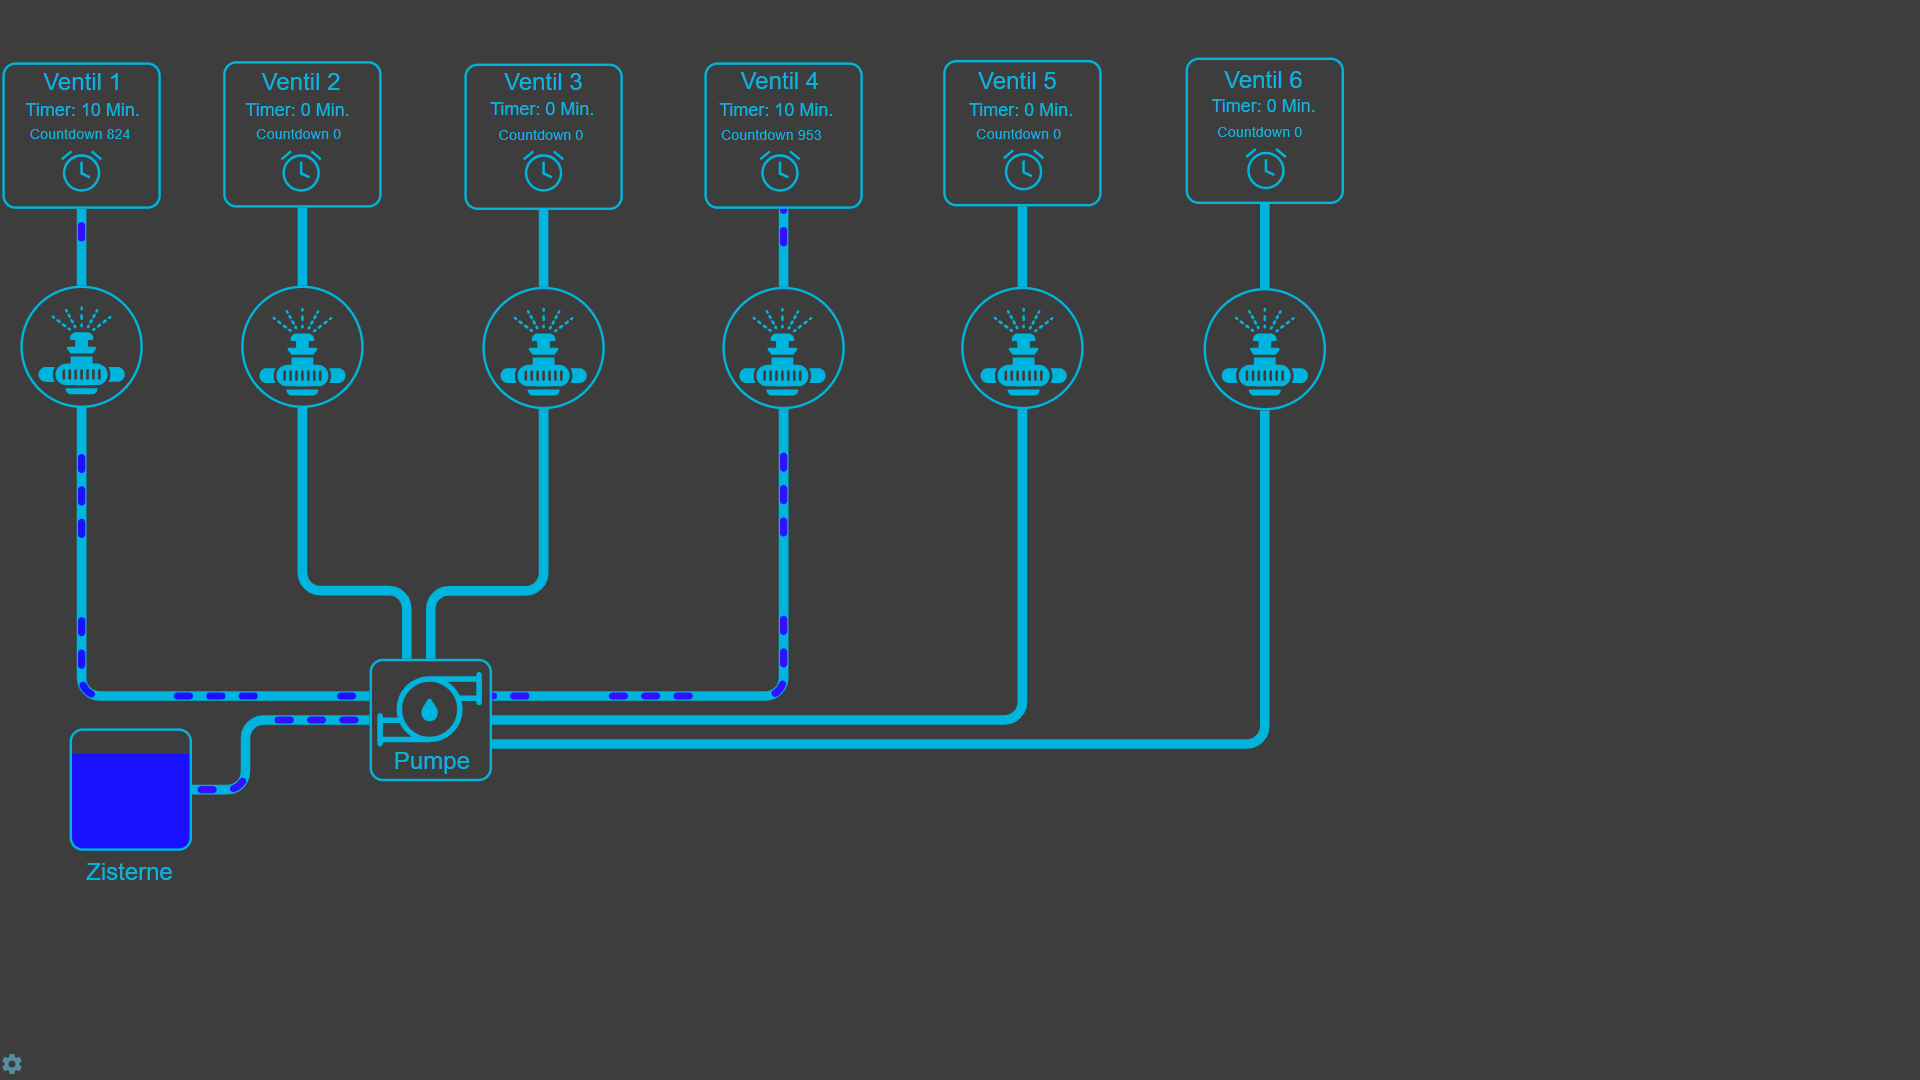
Wenn Wasser fließt werde ich die entsprechenden Leitungen so animieren, dafür habe ich schon mit ChatGPT eine Lösung gefunden:
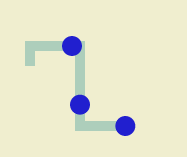
<svg width="840px" height="400px" xmlns="http://www.w3.org/2000/svg"> <path id="myPath" fill="none" stroke="lightblue" stroke-width="10" d="M100,320 100,300 150,300 150,380 200,380" /> <!-- Erster Kreis mit Animation --> <circle cx="0" cy="0" r="10" fill="blue"> <animateMotion repeatCount="indefinite" dur="3s"> <mpath href="#myPath" /> </animateMotion> </circle> <!-- Zweiter Kreis mit Animation --> <circle cx="0" cy="0" r="10" fill="blue"> <animateMotion repeatCount="indefinite" dur="3s" begin="1s"> <mpath href="#myPath" /> </animateMotion> </circle> <!-- Dritter Kreis mit Animation --> <circle cx="0" cy="0" r="10" fill="blue"> <animateMotion repeatCount="indefinite" dur="3s" begin="2s"> <mpath href="#myPath" /> </animateMotion> </circle> </svg> -
Hallo liebes IOBroker Forum,
für mein VIS-2 Projekt möchte ich folgendes erreichen.
Ich habe für meine Gartenbewässerung in einer Zisterne einen Füllstandssensor eingebaut, der mir den Füllstand überwacht und an IOBroker sendet.
Ich möchte für die VIS jetzt den Tank inkl. Füllstand darstellen und dies abhängig vom realen Füllstand und als "Sahnestück" eine Wasserlinien Animation einbauen.
Vorlage für die Wasserlinie:
https://codepen.io/creativejeff/pen/vYLLEBrPath Definition des Regentanks:
<path
         fill="#545454"
         d="M 85.242188 222.296875 C 85.835938 221.679688 85.835938 220.703125 85.242188 220.085938 C 84.519531 219.339844 83.523438 218.917969 82.488281 218.917969 L 37.875 218.917969 C 36.835938 218.917969 35.839844 219.339844 35.117188 220.085938 C 34.523438 220.703125 34.523438 221.679688 35.117188 222.296875 C 35.402344 222.589844 35.398438 223.054688 35.109375 223.34375 C 34.824219 223.628906 34.816406 224.097656 35.101562 224.390625 L 36.457031 225.789062 C 36.457031 225.789062 36.457031 225.789062 36.457031 225.792969 C 36.527344 225.863281 36.566406 225.953125 36.5625 226.054688 C 36.558594 226.09375 36.558594 226.132812 36.558594 226.171875 C 35.015625 244.800781 34.769531 262.308594 36.558594 278.066406 C 36.558594 282.582031 40.21875 286.242188 44.734375 286.242188 L 75.625 286.242188 C 80.140625 286.242188 83.800781 282.582031 83.800781 278.066406 C 85.542969 261.679688 85.34375 244.28125 83.800781 226.171875 C 83.800781 226.132812 83.800781 226.09375 83.796875 226.054688 C 83.792969 225.953125 83.835938 225.863281 83.902344 225.792969 C 83.902344 225.789062 83.902344 225.789062 83.902344 225.789062 L 85.402344 224.238281 C 85.699219 223.933594 85.628906 223.53125 85.25 223.34375 C 84.871094 223.152344 84.800781 222.75 85.097656 222.445312 L 85.242188 222.296875 "
         fill-opacity="1"
         fill-rule="nonzero"
         id="Regentonne" />
Gesamtprojekt:
Da ich leider nicht so viel Ahnung von SVG Animationen habe würde ich Euch gerne um ein paar Tipps bitten. Ich könnte mir vorstellen, dass es mit AnimateMotion geht oder per CSS mit keyframes wie im Beispiel. Ich weiß nur nicht wie man die Waveform in die Regentonne setzen kann. Und wie würde das dann dynamisch mit dem Füllstand funktionieren?
Vielen Dank!
Wenn Wasser fließt werde ich die entsprechenden Leitungen so animieren, dafür habe ich schon mit ChatGPT eine Lösung gefunden:
<svg width="840px" height="400px" xmlns="http://www.w3.org/2000/svg"> <path id="myPath" fill="none" stroke="lightblue" stroke-width="10" d="M100,320 100,300 150,300 150,380 200,380" /> <!-- Erster Kreis mit Animation --> <circle cx="0" cy="0" r="10" fill="blue"> <animateMotion repeatCount="indefinite" dur="3s"> <mpath href="#myPath" /> </animateMotion> </circle> <!-- Zweiter Kreis mit Animation --> <circle cx="0" cy="0" r="10" fill="blue"> <animateMotion repeatCount="indefinite" dur="3s" begin="1s"> <mpath href="#myPath" /> </animateMotion> </circle> <!-- Dritter Kreis mit Animation --> <circle cx="0" cy="0" r="10" fill="blue"> <animateMotion repeatCount="indefinite" dur="3s" begin="2s"> <mpath href="#myPath" /> </animateMotion> </circle> </svg>@vippis
Schau dir mal den Adapter an:
Energiefluss - erweitertIst zwar nicht dafür gedacht, aber funktioniert.
-
Hallo liebes IOBroker Forum,
für mein VIS-2 Projekt möchte ich folgendes erreichen.
Ich habe für meine Gartenbewässerung in einer Zisterne einen Füllstandssensor eingebaut, der mir den Füllstand überwacht und an IOBroker sendet.
Ich möchte für die VIS jetzt den Tank inkl. Füllstand darstellen und dies abhängig vom realen Füllstand und als "Sahnestück" eine Wasserlinien Animation einbauen.
Vorlage für die Wasserlinie:
https://codepen.io/creativejeff/pen/vYLLEBrPath Definition des Regentanks:
<path
         fill="#545454"
         d="M 85.242188 222.296875 C 85.835938 221.679688 85.835938 220.703125 85.242188 220.085938 C 84.519531 219.339844 83.523438 218.917969 82.488281 218.917969 L 37.875 218.917969 C 36.835938 218.917969 35.839844 219.339844 35.117188 220.085938 C 34.523438 220.703125 34.523438 221.679688 35.117188 222.296875 C 35.402344 222.589844 35.398438 223.054688 35.109375 223.34375 C 34.824219 223.628906 34.816406 224.097656 35.101562 224.390625 L 36.457031 225.789062 C 36.457031 225.789062 36.457031 225.789062 36.457031 225.792969 C 36.527344 225.863281 36.566406 225.953125 36.5625 226.054688 C 36.558594 226.09375 36.558594 226.132812 36.558594 226.171875 C 35.015625 244.800781 34.769531 262.308594 36.558594 278.066406 C 36.558594 282.582031 40.21875 286.242188 44.734375 286.242188 L 75.625 286.242188 C 80.140625 286.242188 83.800781 282.582031 83.800781 278.066406 C 85.542969 261.679688 85.34375 244.28125 83.800781 226.171875 C 83.800781 226.132812 83.800781 226.09375 83.796875 226.054688 C 83.792969 225.953125 83.835938 225.863281 83.902344 225.792969 C 83.902344 225.789062 83.902344 225.789062 83.902344 225.789062 L 85.402344 224.238281 C 85.699219 223.933594 85.628906 223.53125 85.25 223.34375 C 84.871094 223.152344 84.800781 222.75 85.097656 222.445312 L 85.242188 222.296875 "
         fill-opacity="1"
         fill-rule="nonzero"
         id="Regentonne" />
Gesamtprojekt:
Da ich leider nicht so viel Ahnung von SVG Animationen habe würde ich Euch gerne um ein paar Tipps bitten. Ich könnte mir vorstellen, dass es mit AnimateMotion geht oder per CSS mit keyframes wie im Beispiel. Ich weiß nur nicht wie man die Waveform in die Regentonne setzen kann. Und wie würde das dann dynamisch mit dem Füllstand funktionieren?
Vielen Dank!
Wenn Wasser fließt werde ich die entsprechenden Leitungen so animieren, dafür habe ich schon mit ChatGPT eine Lösung gefunden:
<svg width="840px" height="400px" xmlns="http://www.w3.org/2000/svg"> <path id="myPath" fill="none" stroke="lightblue" stroke-width="10" d="M100,320 100,300 150,300 150,380 200,380" /> <!-- Erster Kreis mit Animation --> <circle cx="0" cy="0" r="10" fill="blue"> <animateMotion repeatCount="indefinite" dur="3s"> <mpath href="#myPath" /> </animateMotion> </circle> <!-- Zweiter Kreis mit Animation --> <circle cx="0" cy="0" r="10" fill="blue"> <animateMotion repeatCount="indefinite" dur="3s" begin="1s"> <mpath href="#myPath" /> </animateMotion> </circle> <!-- Dritter Kreis mit Animation --> <circle cx="0" cy="0" r="10" fill="blue"> <animateMotion repeatCount="indefinite" dur="3s" begin="2s"> <mpath href="#myPath" /> </animateMotion> </circle> </svg>Meine vorläufige Lösung nach Recherche:
<head>

<style>

    #container {
      width: 60px;
      height: 70px;
      position: relative;
      left: 50%;
      top: 50%;
      border-radius: 10px;
      /*box-shadow: 0px 0px 2px #000;*/
      transform: translate(-50%,-50%);

      overflow: hidden;
    }

    .wave-01 {
      position: absolute;
      width: 210%;
      height: 195%;
      left: -50%;
      top: 50%;
      background-color: rgba(0,190,255,0.4);
      border-radius: 60%;
      animation: rotate 3s linear infinite;
    }

</style>

</head>

<body>
    <div id="container">
    <div class="wave-01"></div>
    </div>
</body>
Den Füllstand passt man dann über den Parameter "top" in "wave-01" an. Das mache ich dann per JS und schreibe den HTML-Code in einen Datenpunkt und binde ihn an das HTML Widget.
-
Meine vorläufige Lösung nach Recherche:
<head>

<style>

    #container {
      width: 60px;
      height: 70px;
      position: relative;
      left: 50%;
      top: 50%;
      border-radius: 10px;
      /*box-shadow: 0px 0px 2px #000;*/
      transform: translate(-50%,-50%);

      overflow: hidden;
    }

    .wave-01 {
      position: absolute;
      width: 210%;
      height: 195%;
      left: -50%;
      top: 50%;
      background-color: rgba(0,190,255,0.4);
      border-radius: 60%;
      animation: rotate 3s linear infinite;
    }

</style>

</head>

<body>
    <div id="container">
    <div class="wave-01"></div>
    </div>
</body>
Den Füllstand passt man dann über den Parameter "top" in "wave-01" an. Das mache ich dann per JS und schreibe den HTML-Code in einen Datenpunkt und binde ihn an das HTML Widget.
@vippis sagte in SVG Animation: Regentonne mit animierter Wasserlinie:
Den Füllstand passt man dann über den Parameter "top" in "wave-01" an. Das mache ich dann per JS und schreibe den HTML-Code in einen Datenpunkt und binde ihn an das HTML Widget.
Kannst du auch direkt per "id" machen ohne den Umweg per Datenpunkt: https://forum.iobroker.net/post/498547
-
Animation von Energiefluß, Wasser usw. kannst ganz leicht mit dem Dashoffset machen.
Kannst hier schauen: http://129.159.205.3:8082/webui/index.html (Screens/smile108/wärmepumpe(1) ). Ist zwar nicht Vis2, aber CSS sollte ja gleich sein.
Support us
235
Online32.7k
Users82.5k
Topics1.3m
Posts