NEWS


neue Visualisierung "webui" (alternative zu vis & vis-2)
-
@smilie108 said in neue Visualisierung "webui" (alternative zu vis & vis-2):
@jogibear9988 hi unter smilie108/grafana2 hab ich es dir rein.
im iframe src ist ein javascript dort siehst du was ich meine")
ps beim import fehlt in der style immer die } am ende
würde gerne den korrekturwert in einer session varibel speichern um das blättern in der zeitachse von grafana zu realisieren.
weitere idee noch von mir sind presets kurveneinstellungen in einem cokkie zu speichern um sie wie eine personalisierung zu haben.gruß smilie108
sollte alles gefixt sein...
deine scripts hab ich nicht angeschaut, aber du solltest sie nun debuggen können. -
@jogibear9988
mal ne frage bei den bindables / locals kannst du da auch eine remove funktion hinzufügen ? um variabeln wiedr zu entfernen oder eventuell auch etwas zum umbenennen ?gruß tom
Wo was entfernen? Locale variablen sind weg wenn du den browser neu lädst und die nirgends verwendet sind
-
Jetzt ist es wieder an der Zeit, die Experten zu fragen:
Ich habe mit chart.js mir ein Klasse geschrieben, die mir meine notwendigen Daten in Grafiken umsetzt. Das Ganze habe ich mit rein Javascript gemacht.
Hierzu eine Index.html erstellt:<!DOCTYPE html> <html lang="de"> <head> <meta charset="UTF-8"> <meta name="viewport" content="width=device-width, initial-scale=1.0"> <title>Energieverbrauchs-Diagramm</title> <script src="https://cdn.jsdelivr.net/npm/chart.js"></script> <script src="js/chartBuilder.js"></script> <link rel="stylesheet" href="index.css"> </head> <body> <div id="chartContainer"> <div> <canvas id="houseYearlyChart"></canvas> <div class="legend" id="houseYearlyChartLegend"></div> <!-- Container für die Legende --> </div> <div> <canvas id="roomYearlyChart"></canvas> <div class="legend" id="roomYearlyChartLegend"></div> <!-- Container für die Legende --> </div> <div> <canvas id="roomMonthlyChart"></canvas> <div class="legend" id="roomMonthlyChartLegend"></div> <!-- Container für die Legende --> </div> <div> <canvas id="grossesDiagramm"></canvas> <div class="grossesDiagrammLegend" id="grossesDiagrammLegend"></div> <!-- Container für die Legende --> </div> <div> <canvas id="grossesDiagrammX"></canvas> <div class="grossesDiagrammLegend" id="grossesDiagrammXLegend"></div> <!-- Container für die Legende --> </div> </div> <script src="index.js"> </script> </body> </html>Chart.js als Script-Tag eingebaut, <script src="https://cdn.jsdelivr.net/npm/chart.js"></script>
Meine Klasse hinzugefügt und ein kleines index.js zur Konfiguration der Grafik.const diagrammBasiswerte = { titlecolor: '#ffffff', fontsize: 12, // Schriftgröße: 12px fontfamily: 'Arial', // Schriftart: Arial fontstyle: 'italic', // Schriftstil: kursiv fontweight: 'bold', // Schriftgewicht: fett fontcolor: '#ffffff', maxRotation: 0, minRotation: 0, } const diagramConfigs = { houseYearlyChart: { chartjs_typ: 'bar', // bar oder line chartType: 'yearlyChart', // yearlyChart oder dailyChart datatype: 'absoluteValue', // 'absoluteValue' oder 'Counter' year: '2025', // Jahr aus der Konfiguration month: '', // Nicht erforderlich für yearlyChart threshold: 30, showLegend: true, // Tabelle mit Legende showPoints: false, // Punkte ausblenden devices: JSON.stringify([ // Geräte { id: '7', name: 'Isttemperatur', type: 'absoluteValue', unit: '°C', normalizationFactor: 1, color: '#0000FF' }, ]), options: { datumsformat: { month: 'short' }, // --> 01.Jan.2024 { day: '2-digit', month: 'short', year: 'numeric' } threshold: { label: 'Threshold', type: 'line', borderColor: '#FF0000', borderWidth: 4, fill: false, pointRadius: 0 }, durchschnitt: { label: 'Durchschnitt', type: 'line', borderColor: '#FFFFFF', borderWidth: 2, fill: false, pointRadius: 0 }, scales: { x: { title: { display: true, text: `Zeitraum 2024`, color: diagrammBasiswerte.titlecolor }, ticks: { maxRotation: diagrammBasiswerte.maxRotation, minRotation: diagrammBasiswerte.minRotation, font: { size: diagrammBasiswerte.fontsize, family: diagrammBasiswerte.fontfamily, style: diagrammBasiswerte.fontstyle, weight: diagrammBasiswerte.fontweight, }, color: diagrammBasiswerte.fontcolor, }, }, y: { title: { display: true, text: `Temperatur (°C)`, color: diagrammBasiswerte.titlecolor }, ticks: { font: { size: diagrammBasiswerte.fontsize, family: diagrammBasiswerte.fontfamily, style: diagrammBasiswerte.fontstyle, weight: diagrammBasiswerte.fontweight, }, color: diagrammBasiswerte.fontcolor, }, }, }, }, }, roomYearlyChart: { chartjs_typ: 'bar', chartType: 'yearlyChart', datatype: 'Counter', // 'absoluteValue' oder 'Counter' year: '2024', // Jahr aus der Konfiguration month: '', // Nicht erforderlich für yearlyChart threshold: 300, showLegend: true, showPoints: true, // Punkte einblenden devices: JSON.stringify([ { id: '36', name: 'ac_energie', type: 'Counter', unit: 'kWh', normalizationFactor: 1000, color: '#00FF00' }, { id: '41', name: 'ac_energie_gesamt', type: 'Counter', unit: 'kWh', normalizationFactor: 1000, color: '#FFA500' }, ]), options: { datumsformat: { month: 'short' }, // --> 01.Jan.2024 { day: '2-digit', month: 'short', year: 'numeric' } threshold: { label: 'Threshold', type: 'line', borderColor: '#FF0000', borderWidth: 4, fill: false, pointRadius: 0 }, durchschnitt: { label: 'Durchschnitt', type: 'line', borderColor: '#FFFFFF', borderWidth: 2, fill: false, pointRadius: 0 }, scales: { x: { title: { display: true, text: `Zeitraum 2024`, color: diagrammBasiswerte.titlecolor }, ticks: { maxRotation: diagrammBasiswerte.maxRotation, minRotation: diagrammBasiswerte.minRotation, font: { size: diagrammBasiswerte.fontsize, family: diagrammBasiswerte.fontfamily, style: diagrammBasiswerte.fontstyle, weight: diagrammBasiswerte.fontweight, }, color: diagrammBasiswerte.fontcolor, }, }, y: { title: { display: true, text: `Energie (kWh)`, color: diagrammBasiswerte.titlecolor }, ticks: { font: { size: diagrammBasiswerte.fontsize, family: diagrammBasiswerte.fontfamily, style: diagrammBasiswerte.fontstyle, weight: diagrammBasiswerte.fontweight, }, color: diagrammBasiswerte.fontcolor, }, }, }, }, }, roomMonthlyChart: { chartjs_typ: 'bar', chartType: 'dailyChart', datatype: 'Counter', // 'absoluteValue' oder 'Counter' year: '2025', // Jahr aus der Konfiguration month: '3', // Monat für dailyChart threshold: 10, showLegend: true, showPoints: true, // Punkte einblenden devices: JSON.stringify([ { id: '41', name: 'ac_energie_gesamt', type: 'Counter', unit: 'kWh', normalizationFactor: 1000, color: '#FFFF00' }, { id: '36', name: 'ac_energie', type: 'Counter', unit: 'kWh', normalizationFactor: 1000, color: '#FF00FF' }, ]), options: { datumsformat: { day: '2-digit', month: 'short' }, // --> 01.Apr threshold: { label: 'Threshold', type: 'line', borderColor: '#FF0000', borderWidth: 4, fill: false, pointRadius: 0 }, durchschnitt: { label: 'Durchschnitt', type: 'line', borderColor: '#FFFFFF', borderWidth: 2, fill: false, pointRadius: 0 }, scales: { x: { title: { display: true, text: `Zeitraum 2025`, color: diagrammBasiswerte.titlecolor }, ticks: { maxRotation: diagrammBasiswerte.maxRotation, minRotation: diagrammBasiswerte.minRotation, font: { size: diagrammBasiswerte.fontsize, family: diagrammBasiswerte.fontfamily, style: diagrammBasiswerte.fontstyle, weight: diagrammBasiswerte.fontweight, }, color: diagrammBasiswerte.fontcolor, }, }, y: { title: { display: true, text: `Energie (kWh)`, color: diagrammBasiswerte.titlecolor }, ticks: { font: { size: diagrammBasiswerte.fontsize, family: diagrammBasiswerte.fontfamily, style: diagrammBasiswerte.fontstyle, weight: diagrammBasiswerte.fontweight, }, color: diagrammBasiswerte.fontcolor, }, }, }, }, }, grossesDiagramm: { chartjs_typ: 'line', // bar oder line chartType: 'yearlyChart', // yearlyChart oder dailyChart datatype: 'Counter', // 'absoluteValue' oder 'Counter' year: '2025', // Jahr aus der Konfiguration month: '', // Nicht erforderlich für yearlyChart threshold: 25, showLegend: true, // Tabelle mit Legende showPoints: true, // Punkte ausblenden devices: JSON.stringify([ // Geräte { id: '41', name: 'ac_energie_gesamt', type: 'Counter', unit: '°C', normalizationFactor: 1, color: '#0000FF' }, { id: '21', name: 'ac_energie', type: 'Counter', unit: '°C', normalizationFactor: 1, color: '#FF0000' }, { id: '22', name: 'ac_energie', type: 'Counter', unit: '°C', normalizationFactor: 1, color: '#FFFF00' }, { id: '23', name: 'ac_energie', type: 'Counter', unit: '°C', normalizationFactor: 1, color: '#000000' }, { id: '24', name: 'ac_energie', type: 'Counter', unit: '°C', normalizationFactor: 1, color: '#FF00FF' }, { id: '25', name: 'ac_energie', type: 'Counter', unit: '°C', normalizationFactor: 1, color: '#FFFFFF' }, ]), options: { datumsformat: { month: 'short' }, // --> 01.Jan.2024 { day: '2-digit', month: 'short', year: 'numeric' } threshold: { label: 'Threshold', type: 'line', borderColor: '#FF0000', borderWidth: 4, fill: false, pointRadius: 0 }, durchschnitt: { label: 'Durchschnitt', type: 'line', borderColor: '#FFFFFF', borderWidth: 2, fill: false, pointRadius: 0 }, scales: { x: { title: { display: true, text: `Zeitraum 2024`, color: diagrammBasiswerte.titlecolor }, ticks: { maxRotation: diagrammBasiswerte.maxRotation, minRotation: diagrammBasiswerte.minRotation, font: { size: diagrammBasiswerte.fontsize, family: diagrammBasiswerte.fontfamily, style: diagrammBasiswerte.fontstyle, weight: diagrammBasiswerte.fontweight, }, color: diagrammBasiswerte.fontcolor, }, }, y: { title: { display: true, text: `Temperatur (°C)`, color: diagrammBasiswerte.titlecolor }, ticks: { font: { size: diagrammBasiswerte.fontsize, family: diagrammBasiswerte.fontfamily, style: diagrammBasiswerte.fontstyle, weight: diagrammBasiswerte.fontweight, }, color: diagrammBasiswerte.fontcolor, }, }, }, }, }, grossesDiagrammX: { chartjs_typ: 'line', // bar oder line chartType: 'yearlyChart', // yearlyChart oder dailyChart datatype: 'Counter', // 'absoluteValue' oder 'Counter' year: '2024', // Jahr aus der Konfiguration month: '', // Nicht erforderlich für yearlyChart threshold: 25, showLegend: true, // Tabelle mit Legende showPoints: true, // Punkte ausblenden devices: JSON.stringify([ // Geräte { id: '26', name: 'ac_energie', type: 'Counter', unit: '°C', normalizationFactor: 1, color: '#0000FF' }, { id: '27', name: 'ac_energie', type: 'Counter', unit: '°C', normalizationFactor: 1, color: '#FF0000' }, { id: '28', name: 'ac_energie', type: 'Counter', unit: '°C', normalizationFactor: 1, color: '#FFFF00' }, { id: '29', name: 'ac_energie', type: 'Counter', unit: '°C', normalizationFactor: 1, color: '#000000' }, { id: '30', name: 'ac_energie', type: 'Counter', unit: '°C', normalizationFactor: 1, color: '#FF00FF' }, { id: '31', name: 'ac_energie', type: 'Counter', unit: '°C', normalizationFactor: 1, color: '#FFFFFF' }, ]), options: { datumsformat: { month: 'short' }, // --> 01.Jan.2024 { day: '2-digit', month: 'short', year: 'numeric' } threshold: { label: 'Threshold', type: 'line', borderColor: '#FF0000', borderWidth: 4, fill: false, pointRadius: 0 }, durchschnitt: { label: 'Durchschnitt', type: 'line', borderColor: '#FFFFFF', borderWidth: 2, fill: false, pointRadius: 0 }, scales: { x: { title: { display: true, text: `Zeitraum 2024`, color: diagrammBasiswerte.titlecolor }, ticks: { maxRotation: diagrammBasiswerte.maxRotation, minRotation: diagrammBasiswerte.minRotation, font: { size: diagrammBasiswerte.fontsize, family: diagrammBasiswerte.fontfamily, style: diagrammBasiswerte.fontstyle, weight: diagrammBasiswerte.fontweight, }, color: diagrammBasiswerte.fontcolor, }, }, y: { title: { display: true, text: `Temperatur (°C)`, color: diagrammBasiswerte.titlecolor }, ticks: { font: { size: diagrammBasiswerte.fontsize, family: diagrammBasiswerte.fontfamily, style: diagrammBasiswerte.fontstyle, weight: diagrammBasiswerte.fontweight, }, color: diagrammBasiswerte.fontcolor, }, }, }, }, }, }; // Diagramme erstellen und Daten laden Object.keys(diagramConfigs).forEach((chartId) => { const config = diagramConfigs[chartId]; const apiUrl = `/api/sqlData?devices=${encodeURIComponent(config.devices)}&year=${config.year}&chartType=${config.chartType}${config.chartType === 'dailyChart' ? `&month=${config.month}` : ''}`; fetch(apiUrl) .then((response) => { if (!response.ok) throw new Error(`Fehler: ${response.statusText}`); return response.json(); }) .then((data) => { const chartBuilder = new ChartBuilder(chartId, `${chartId}Legend`); chartBuilder.create(config.chartjs_typ, config.datatype, data, config.showLegend, config.threshold, config.showPoints, config.year, config.options); }) .catch((error) => console.error(`Fehler beim Laden des Diagramms ${chartId}:`, error)); });Jetzt die Frage an die Experten:
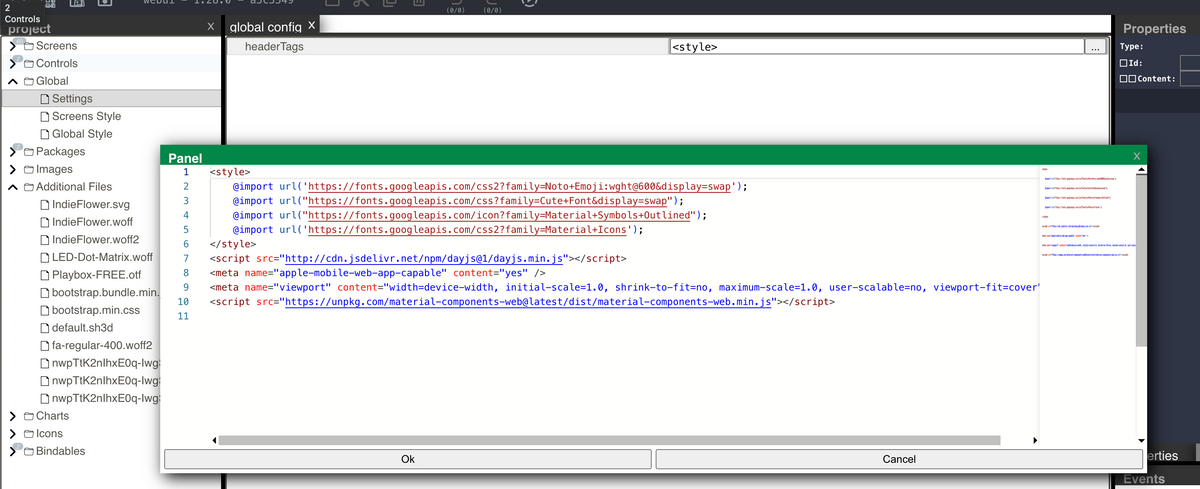
Wo und wie binde ich die externen Elemente in webui ein.
<script src="https://cdn.jsdelivr.net/npm/chart.js"></script>
<script src="js/chartBuilder.js"></script>Meine Klasse habe ich als Beispiel einfach im Javascript-Teil des Controls mit eingebunden. Das geht auch bestimmt anders.
Aber wie ich das mit chart.js mache erschließt sich mir nicht. Ich erhalte immer die Meldung, dass Chart nicht existiert.<script src="http://192.168.110.10:8082/webui.0.data/config/additionalfiles/chart.js"></script> <div id="chartContainer" style="position:absolute;left:97px;top:26px;width:476px;height:170px;"> <div> <canvas id="YearlyChart"></canvas> <div class="legend" id="YearlyChartLegend"></div> </div> <script src="http://192.168.110.10:8082/webui.0.widgets/importmap.js"></script> </div>Hier noch das javascript-Modul
/**
* @param {BaseScreenViewerAndControl} instance
*/

const diagrammBasiswerte = {
    titlecolor: '#ffffff',
    fontsize: 12, // Schriftgröße: 12px
    fontfamily: 'Arial', // Schriftart: Arial
    fontstyle: 'italic', // Schriftstil: kursiv
    fontweight: 'bold', // Schriftgewicht: fett
    fontcolor: '#ffffff',
    maxRotation: 0,
    minRotation: 0,
}

const diagramConfigs = {
    YearlyChart: {
        chartjs_typ: 'bar', // bar oder line
        chartType: 'yearlyChart', // yearlyChart oder dailyChart
        datatype: 'absoluteValue', // 'absoluteValue' oder 'Counter'
        year: '2025', // Jahr aus der Konfiguration
        month: '', // Nicht erforderlich für yearlyChart
        threshold: 30,
        showLegend: true, // Tabelle mit Legende
        showPoints: false, // Punkte ausblenden
        devices: JSON.stringify([   // Geräte
            { id: '7', name: 'Isttemperatur', type: 'absoluteValue', unit: '°C', normalizationFactor: 1, color: '#0000FF' },
        ]),
        options: {
            datumsformat: { month: 'short' }, // --> 01.Jan.2024 { day: '2-digit', month: 'short', year: 'numeric' }
            threshold: { label: 'Threshold', type: 'line', borderColor: '#FF0000', borderWidth: 4, fill: false, pointRadius: 0 },
            durchschnitt: { label: 'Durchschnitt', type: 'line', borderColor: '#FFFFFF', borderWidth: 2, fill: false, pointRadius: 0 },
            scales: {
                x: {
                    title: { display: true, text: `Zeitraum 2024`, color: diagrammBasiswerte.titlecolor },
                    ticks: {
                        maxRotation: diagrammBasiswerte.maxRotation,
                        minRotation: diagrammBasiswerte.minRotation,
                        font: {
                            size: diagrammBasiswerte.fontsize,
                            family: diagrammBasiswerte.fontfamily,
                            style: diagrammBasiswerte.fontstyle,
                            weight: diagrammBasiswerte.fontweight,
                        },
                        color: diagrammBasiswerte.fontcolor,
                    },
                },
                y: {
                    title: { display: true, text: `Temperatur (°C)`, color: diagrammBasiswerte.titlecolor },
                    ticks: {
                        font: {
                            size: diagrammBasiswerte.fontsize,
                            family: diagrammBasiswerte.fontfamily,
                            style: diagrammBasiswerte.fontstyle,
                            weight: diagrammBasiswerte.fontweight,
                        },
                        color: diagrammBasiswerte.fontcolor,
                    },
                },
            },
        },
    },
};

export function init(instance,shadowRoot) {
    console.log(instance);
    console.log(shadowRoot);
    console.log(instance.query);
    const cssid = instance._getDomElement('chartContainer');
    console.log(cssid);
    instance.query = "Ich bin blöd";
    console.log(instance.query);
    IOB.setState('0_userdata.0.Funktionen.DatabaseQuery',instance.query);
    const result2 = instance.result;
    console.log(result2);
    const result = IOB.getState('0_userdata.0.Funktionen.DatabaseResult');
    console.log(JSON.stringify(instance,null,2));
    Object.keys(diagramConfigs).forEach((chartId) => {
       const config = diagramConfigs[chartId];
       const data=instance.result
       const chartBuilder = new ChartBuilder(chartId, `${chartId}Legend`,instance);
       chartBuilder.create(instance,config.chartjs_typ, config.datatype, data, config.showLegend, config.threshold, config.showPoints, config.year, config.options);
    });
}

class ChartBuilder {
    constructor(canvasId, legendId,instance) {
        this.ctx = instance._getDomElement(canvasId).getContext('2d');
        // this.ctx = document.getElementById(canvasId).getContext('2d');
        this.chartInstance = null;
        this.legendId = legendId;
    }

    create(instance,chartjs_typ, datatype, data, showLegend, threshold, showPoints, year, options = {}) {
        this.renderChart(instance,chartjs_typ,datatype, data, showLegend, threshold, showPoints, year, options);
    }

    renderChart(instance,chartjs_typ, datatype, data, showLegend, threshold, showPoints, year, options) {
        if (this.chartInstance) this.chartInstance.destroy();

        const legendContainer = instance._getDomElement(this.legendId);
        // const legendContainer = document.getElementById(this.legendId);
        if (!legendContainer) {
            console.error(`Legenden-Element mit ID "${this.legendId}" nicht gefunden.`);
            return;
        }
        legendContainer.style.display = showLegend ? 'block' : 'none';
        legendContainer.innerHTML = ''; // Reset legend

        const labels = [...new Set(data.map((entry) => {
            const formattedDate = new Date(entry.period).toLocaleDateString('de-DE', options.datumsformat);
            if (isNaN(new Date(entry.period).getTime())) {
                console.error(`Invalid Date: ${entry.period}`); // Debugging für fehlerhafte Werte
            }
            return formattedDate;
        }))];

        // Daten nach Geräten gruppieren
        const deviceData = {};
        const statistics = {};

        data.forEach((entry) => {
            if (!deviceData[entry.device_id]) {
                deviceData[entry.device_id] = {
                    label: entry.device_name || 'Unbekanntes Gerät',
                    unit: entry.unit || 'Einheit unbekannt',
                    color: entry.color || '#000000',
                    data: Array(labels.length).fill(0),
                    backgroundColor: entry.color,
                    borderColor: entry.color,
                    fill: false,
                    pointRadius: showPoints ? 5 : 0,
                };

                // Statistikinitialisierung
                statistics[entry.device_id] = {
                    total: 0,
                    count: 0,
                    max: -Infinity,
                    min: Infinity,
                };
            }

            // Datenwerte für das Dataset hinzufügen
            const index = labels.indexOf(new Date(entry.period).toLocaleDateString('de-DE', options.datumsformat));
            if (index >= 0) {
                const normalizedValue = datatype === 'absoluteValue' ? entry.average_value / entry.normalizationFactor : entry.total_value / entry.normalizationFactor; // Differenziere Werte basierend auf Diagrammtyp
                deviceData[entry.device_id].data[index] = normalizedValue;

                // Statistik berechnen
                statistics[entry.device_id].total += normalizedValue;
                statistics[entry.device_id].count += 1;
                statistics[entry.device_id].max = Math.max(statistics[entry.device_id].max, normalizedValue);
                statistics[entry.device_id].min = Math.min(statistics[entry.device_id].min, normalizedValue);
            }
        });

        // Durchschnittslinien und Threshold als Linien-Datensätze
        const averageData = Array(labels.length).fill(
            Object.keys(statistics).reduce((avg, deviceId) => avg + (statistics[deviceId].total / statistics[deviceId].count || 0), 0) / Object.keys(statistics).length
        );
        const thresholdData = Array(labels.length).fill(threshold);

        // Wenn es sich um ein Balkendiagramm handelt, werden Durchschnitt und Threshold als Linien dargestellt
        const additionalDatasets = (chartjs_typ === 'bar' || chartjs_typ === 'line')
            ? [
                {
                    label: options.threshold?.label  ||  'Threshold',
                    data: thresholdData,
                    type: options.threshold?.type  ||  'line', // Linie für Threshold im Balkendiagramm
                    borderColor: options.threshold?.borderColor  ||  '#FF0000',
                    borderWidth: options.threshold?.borderWidth  ||  2,
                    fill: options.threshold?.fill  ||  false,
                    pointRadius: options.threshold?.pointRadius  ||  0,
                },
                {
                    label: options.durchschnitt?.label || 'Durchschnitt',
                    data: averageData,
                    type: options.durchschnitt?.type || 'line', // Linie für Durchschnitt im Balkendiagramm
                    borderColor: options.durchschnitt?.borderColor || '#0000FF',
                    borderWidth: options.durchschnitt?.borderWidth || 2,
                    fill: options.durchschnitt?.label || false,
                    pointRadius: options.durchschnitt?.pointRadius || 0,
                },
            ]
            : [];

        const datasets = [
            ...Object.values(deviceData),
            ...additionalDatasets, // Linien für Balkendiagramme hinzufügen
        ];

        this.chartInstance = new Chart(this.ctx, {
            type: chartjs_typ,
            data: { labels, datasets },
            options: {
                ...options,
                responsive: true,
                plugins: {
                    legend: { display: false }, // Deaktiviere interne Diagrammlegende vollständig
                },
                scales: {
                    x: {

                        ticks: {
                            callback: function(value, index, ticks) {
                                // Verwende die `labels`-Variable direkt in der Callback-Funktion
                                const date = labels[index];
                                return date || 'Invalid Date'; // Fallback für fehlerhafte Werte
                            },
                        },
                        ...options.scales?.x, // Nutze die angepassten X-Achsenoptionen aus der index.html
                    },
                    y: options.scales?.y || {
                        title: { display: true, text: `Werte (${deviceData[Object.keys(deviceData)[0]].unit})` },
                        ticks: {
                            font: {
                                size: 24,
                                family: 'Arial, sans-serif',
                                weight: 'normal',
                            },
                            color: '#ffffff',
                        },
                    },
                },
            },
        });

        // Tabellarische Legende
        legendContainer.innerHTML = `
        <table style="width:100%; border-collapse:collapse;">
          <tr style="background-color:#f4f4f4; text-align:left;">
            <th>Gerät</th>
            <th>Farbe</th>
            <th>Durchschnitt</th>
            <th>Maximum</th>
            <th>Minimum</th>
          </tr>
          ${Object.keys(deviceData).map(deviceId => `
            <tr>
              <td>${deviceData[deviceId].label}</td>
              <td style="background-color:${deviceData[deviceId].color};"></td>
              <td>${(statistics[deviceId].total / statistics[deviceId].count).toFixed(2)} ${deviceData[deviceId].unit}</td>
              <td>${statistics[deviceId].max.toFixed(2)} ${deviceData[deviceId].unit}</td>
              <td>${statistics[deviceId].min.toFixed(2)} ${deviceData[deviceId].unit}</td>
            </tr>
          `).join('')}
        </table>
      `;
    }
}
In der Zeile 193 (this.chartInstance = new Chart(this.ctx, {) steigt das Programm aus, mit der Meldung: Chart existiert nicht.
-
Willst du chartjs von jsdeliver einbinden? Dann wird immer aufs internet zugeriffen wenn du deine Seite öffnest.
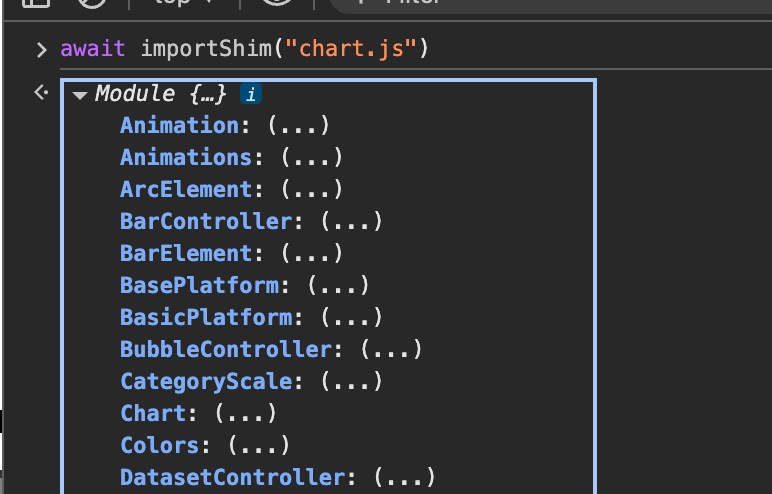
Füg am besten meine chartjs webcomponente hinzu, die ist auch im Beispiuel server:
http://129.159.205.3:8082/webui/index.htmlDann solltest du chartjs direkt via: "await importShim("chart.js")" nutzen können.
Aber du kannst natürlich auch direkt meine Komponente nutzen -
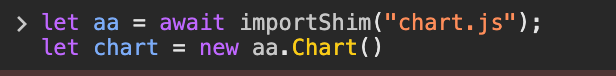
(wenn meine Webcomponente hinzugefügt wurde)
-
Bspw so:
-
Kann sein, das auch "import" statt "importShim" funktioniert. Kann gerade nur in den dev tools testen. Dort geht nur import, da das script nicht über es-module-shims ausgeführt werden.
Warum importShim? Weil die browser im Moment noch keine dynamischen importmaps supporten, und auch weil sie noch keine importmaps in extra files erlauben: https://github.com/guybedford/es-module-shims
@jogibear9988 Hallo Jogibear,
ich musste tatsächlich schmunzeln.- Vielen Dank für deine Lösung. Das hat gut funktioniert.
- Du hast aber meine Frage nicht beantwortet.
Wie würde ich solchen Dinge einbinden, wenn es kein npm-Modul gibt? Insbesondere meine eigenen Klasse?
<script src="js/chartBuilder.js"></script>
-
Alles was dort einfügst wird im head hinzugefügt
-
Alles was dort einfügst wird im head hinzugefügt
@jogibear9988 Danke schön. Jetzt habe ich alles, was ich brauche.
Deine Lösung mit dem npm-Modul ist natürlich eleganter, was ich auch nutzen werde.
Die Einbindung meiner Klasse hilft mir bei der zentralen Pflege.Grüße
-
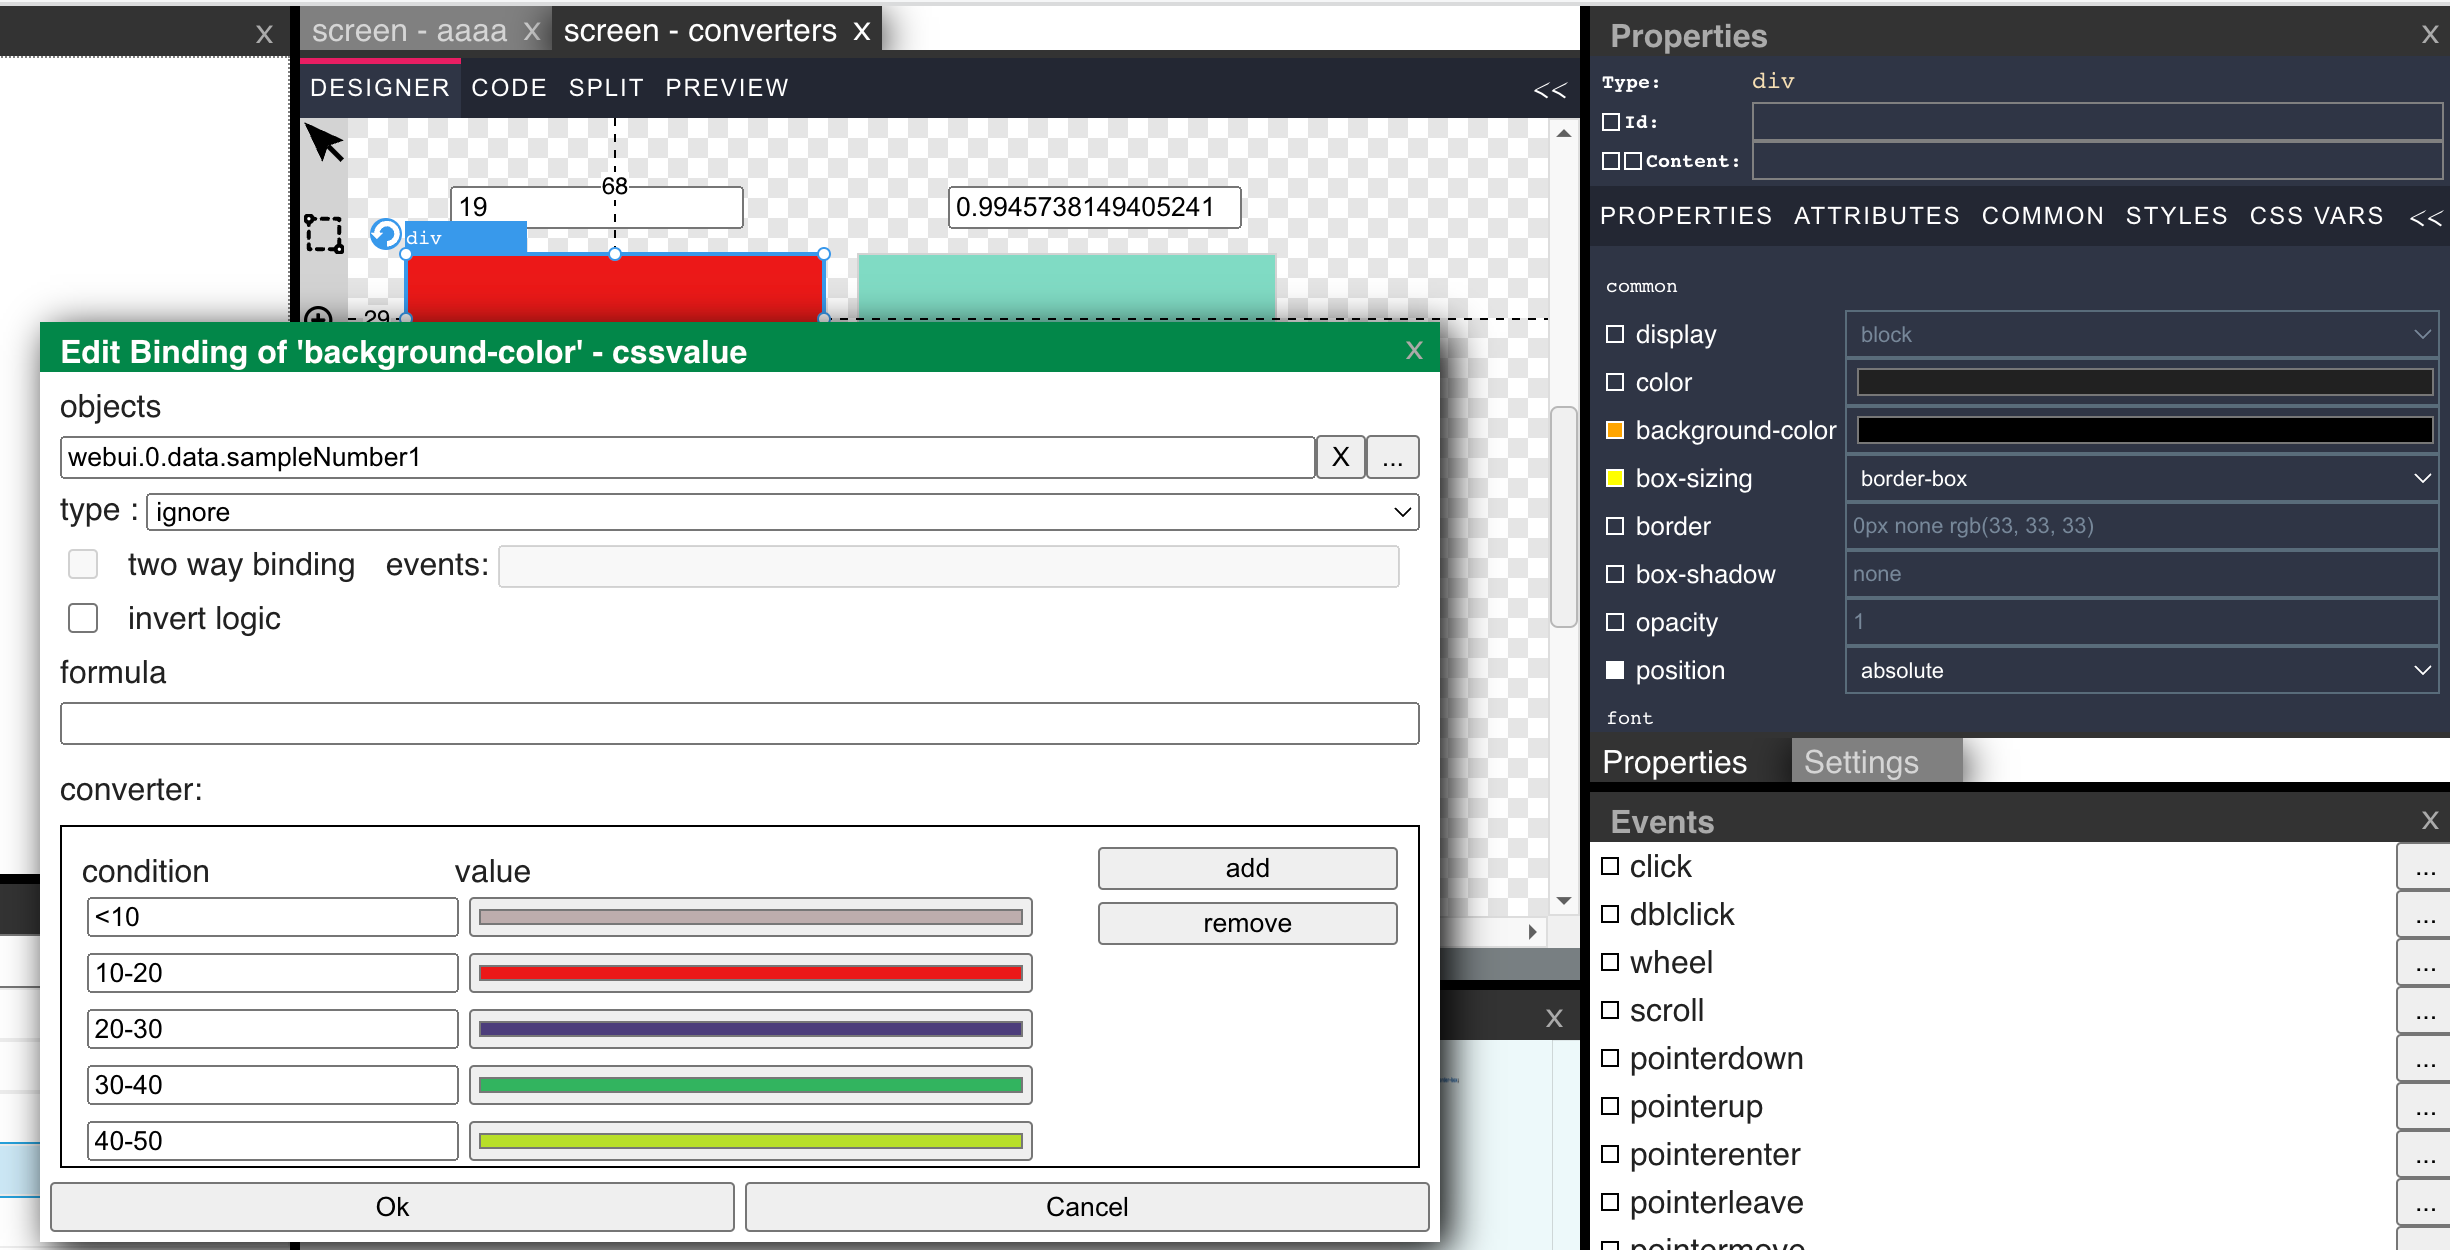
Ich habe ein Control für meine Rolladen erstellt schaffe es aber nicht die auf und ab Pfeile der Material Icons einzufärben, Hindergrund geht. Ist das überhaupt möglich?
Hier mein Code:
<div id="root" @click='{"commands":[{"type":"ToggleSignalValue","signal":{"source":"propertry","name":"signalName"}}]}'> <span @click='{"commands":[{"type":"SetSignalValue","signal":{"source":"property","name":"auto"},"value":"toggle"}]}' bind-css:color='{"signal":"?automatik","converter":{"true":"#33d17a","false":"#e01b24"}}' style="grid-column:1 / span 3;grid-row:1;left:auto;top:auto;width:100%;color:[[?automatik]];">[[?this.name]]</span> <span bind-content:text="?status" style="grid-column:1 / span 3;grid-row:3;height:100%;left:auto;top:auto;width:100%;"></span> <img src="/icons-material-svg/navigation/ic_arrow_drop_up_48px.svg" @click='{"commands":[{"type":"SetSignalValue","signal":{"source":"property","name":"auf"},"value":""}]}' class="#008000" style="grid-column:1;grid-row:2;left:auto;vertical-align:bottom;width:53px;height:46px;top:auto;"> <img src="/icons-material-svg/navigation/ic_arrow_drop_down_48px.svg" @click='{"commands":[{"type":"SetSignalValue","signal":{"source":"property","name":"zu"},"value":""}]}' style="grid-column:3;grid-row:2;left:auto;top:auto;width:44px;height:47px;"> <img src="null" bind-prop:src='{"signal":"?status","converter":{"50%":"/icons-eclipse-smarthome-classic/svg/blinds-50.svg","0%":"/icons-eclipse-smarthome-classic/svg/blinds-0.svg","100%":"/icons-eclipse-smarthome-classic/svg/blinds-100.svg"}}' @click='{"commands":[{"type":"SetSignalValue","signal":{"source":"property","name":"stop"}}]}' style="grid-column:2;grid-row:2;"> </div> -
Ich habe ein Control für meine Rolladen erstellt schaffe es aber nicht die auf und ab Pfeile der Material Icons einzufärben, Hindergrund geht. Ist das überhaupt möglich?
Hier mein Code:
<div id="root" @click='{"commands":[{"type":"ToggleSignalValue","signal":{"source":"propertry","name":"signalName"}}]}'> <span @click='{"commands":[{"type":"SetSignalValue","signal":{"source":"property","name":"auto"},"value":"toggle"}]}' bind-css:color='{"signal":"?automatik","converter":{"true":"#33d17a","false":"#e01b24"}}' style="grid-column:1 / span 3;grid-row:1;left:auto;top:auto;width:100%;color:[[?automatik]];">[[?this.name]]</span> <span bind-content:text="?status" style="grid-column:1 / span 3;grid-row:3;height:100%;left:auto;top:auto;width:100%;"></span> <img src="/icons-material-svg/navigation/ic_arrow_drop_up_48px.svg" @click='{"commands":[{"type":"SetSignalValue","signal":{"source":"property","name":"auf"},"value":""}]}' class="#008000" style="grid-column:1;grid-row:2;left:auto;vertical-align:bottom;width:53px;height:46px;top:auto;"> <img src="/icons-material-svg/navigation/ic_arrow_drop_down_48px.svg" @click='{"commands":[{"type":"SetSignalValue","signal":{"source":"property","name":"zu"},"value":""}]}' style="grid-column:3;grid-row:2;left:auto;top:auto;width:44px;height:47px;"> <img src="null" bind-prop:src='{"signal":"?status","converter":{"50%":"/icons-eclipse-smarthome-classic/svg/blinds-50.svg","0%":"/icons-eclipse-smarthome-classic/svg/blinds-0.svg","100%":"/icons-eclipse-smarthome-classic/svg/blinds-100.svg"}}' @click='{"commands":[{"type":"SetSignalValue","signal":{"source":"property","name":"stop"}}]}' style="grid-column:2;grid-row:2;"> </div>Die Farbe von SVG's welche du als image eingebunden hast, kannst nur mit css filter ändern:
-
@jogibear9988 Hab da mal ne frage. Einzelne unterseiten alleine kann mman die lauffähig machen oder geht das nur über die index seite ? würde gerne zu manchen seiten direkt links erstellen aber dann funktionieren die eingebettenten sachen nicht wie werte von objekt ändern usw.
wenn ich die seite über die index und das menue auswähle gehts aber wenn ich zb direkt auf http://10.25.11.52:8082/webui/runtime.html#screenName=Schrankensteuerung/ParkplatzÜbersicht springe dann gehen die werte ändern nicht.Danke im voraus
@smilie108 said in neue Visualisierung "webui" (alternative zu vis & vis-2):
http://10.25.11.52:8082/webui/runtime.html#screenName=Schrankensteuerung/ParkplatzÜbersicht
S
@smilie108 said in neue Visualisierung "webui" (alternative zu vis & vis-2):
@jogibear9988 Hab da mal ne frage. Einzelne unterseiten alleine kann mman die lauffähig machen oder geht das nur über die index seite ? würde gerne zu manchen seiten direkt links erstellen aber dann funktionieren die eingebettenten sachen nicht wie werte von objekt ändern usw.
wenn ich die seite über die index und das menue auswähle gehts aber wenn ich zb direkt auf http://10.25.11.52:8082/webui/runtime.html#screenName=Schrankensteuerung/ParkplatzÜbersicht springe dann gehen die werte ändern nicht.Danke im voraus
Sollte gehen....
Im Beispielserver sieht das gut aus:http://129.159.205.3:8082/webui/runtime.html#screenName=TestCircle
-
@jogibear9988 Hab da mal ne frage. Einzelne unterseiten alleine kann mman die lauffähig machen oder geht das nur über die index seite ? würde gerne zu manchen seiten direkt links erstellen aber dann funktionieren die eingebettenten sachen nicht wie werte von objekt ändern usw.
wenn ich die seite über die index und das menue auswähle gehts aber wenn ich zb direkt auf http://10.25.11.52:8082/webui/runtime.html#screenName=Schrankensteuerung/ParkplatzÜbersicht springe dann gehen die werte ändern nicht.Danke im voraus
Mach mal ein Beispiel wo es nicht geht.
-
@jogibear9988
Hi kannst du mir kurz weiterhelfen ? Liege mal wieder mit gips zu hause und hab daher wieder mal zeit weiterzumachen.
Wenn ich
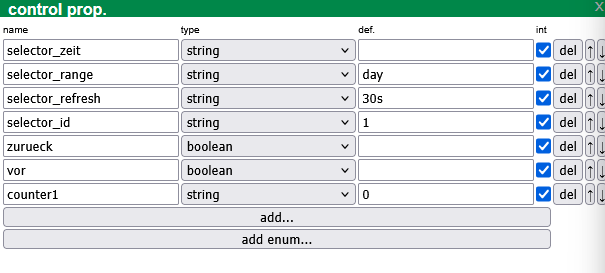
den counter1 mit einem click event um 1 rauf oder runter zählen will was muss ich da verwenden?
Habe es mit incrementsignalvalue probiert aber das geht nicht mit setelemetproperty kann ich einen wert vorgeben aber nicht zählen.
gibt es da eine einfache lösung dafür ?Mfg Tom
-
@jogibear9988
Hi kannst du mir kurz weiterhelfen ? Liege mal wieder mit gips zu hause und hab daher wieder mal zeit weiterzumachen.
Wenn ich
den counter1 mit einem click event um 1 rauf oder runter zählen will was muss ich da verwenden?
Habe es mit incrementsignalvalue probiert aber das geht nicht mit setelemetproperty kann ich einen wert vorgeben aber nicht zählen.
gibt es da eine einfache lösung dafür ?Mfg Tom
Schau in "counter/CounterScreen"
Die befehle, incrementSignalValue etc... gehen nur für signals...
Würd ich mittlerweile vlt. anderst machen, ist aber gewachsen...Muss mir mal überlegen wie man das verbessern kann....
Was auch nicht geht (hab ich gerade gemerkt), 0 als default value für ne number property.
Schau ich mir an, aber nicht mehr heute...Check my ioBroker webui - a vis alternative
see: https://github.com/iobroker-community-adapters/ioBroker.webui -
Schau in "counter/CounterScreen"
Die befehle, incrementSignalValue etc... gehen nur für signals...
Würd ich mittlerweile vlt. anderst machen, ist aber gewachsen...Muss mir mal überlegen wie man das verbessern kann....
Was auch nicht geht (hab ich gerade gemerkt), 0 als default value für ne number property.
Schau ich mir an, aber nicht mehr heute...@jogibear9988
Das was der counter macht wäre genau das was ich suche aber wie habe ich auf der seite wo das control eingebunden zugriff auf die counter variabel ? bin etwas eingerostet sorry
weil wenn ich die funktion mit dem click direkt einbinde dann geht sie nicht oder brauche ich da dann einen anderen pfad ( context.instance.counter1 += 1; ) statt instance meine variabel heist im cont.prop counter1 )
Mfg Tom
Support us
639
Online32.4k
Users81.4k
Topics1.3m
Posts