NEWS

SONOFF NSPanel mit Lovelace UI
SONOFF NSPanel mit Lovelace UI
-
Moin,
die Frage ist vielleicht ein bisschen off-topic, aber mir gehen so langsam die Ideen aus. Ich habe von einem Bekannten noch ein weiteres NSPanel geschenkt bekommen, weil er damit nicht klar kommt. Allerdings hat er wohl die Seiten "direkt auf den Display Controller geflasht", wohl direkt aus dem nextion Editor.
Ich habe das Panel jetzt noch mal neu mit tasmota geflashed und auch den Berry Driver und die Nextion Firmware neu eingespielt - allerdings ohne Erfolg, die Seiten werden immer noch angezeigt.
Die Console liefert zum flashen nur
09:22:58.921 CMD: FlashNextion http://nspanel.pky.eu/lui-release.tft
09:22:58.933 MQT: SmartHome/NSPanel_E7DDC4/stat/RESULT = {"FlashNextion":"Done"}
09:22:58.970 FLH: host: nspanel.pky.eu, port: 80, get: /lui-release.tft
Laut Datenpunkt (0_userdata) ist die DisplayFirmware aktuell 0/v3.3.1 - ich hätte nach dem FlashNextion allerdings die 50/v4.0.5 erwartet.
Hat jemand noch eine Idee, wie ich das Panel zurücksetzen kann bzw. die DisplayFirmware in der richtigen Version geflashed bekomme?
-
FlashNextion http://nspanel.pky.eu/lovelace-ui/github/nspanel-v4.0.5.tft das ist die aktuelle TFT
@tt-tom said in SONOFF NSPanel mit Lovelace UI:
FlashNextion http://nspanel.pky.eu/lovelace-ui/github/nspanel-v4.0.5.tft das ist die aktuelle TFT
danke Tom, allerdings scheint mein Panel überhaupt kein FlashNextion auszuführen - zumindest steht im DP unter 0_userdata immer noch 0/v3.3.1...
@danny_v1 said in SONOFF NSPanel mit Lovelace UI:
@l4rs Hast du nach dem Tasmota flashen das Dateisystem mal aufgeräumt, also alle Dateien gelöscht?
ja, ich hab das Panel, wie bei den anderen auch so vorbereitet, wie unter https://docs.nspanel.pky.eu/prepare_nspanel/ beschrieben...
-
Machs mal so
https://github.com/joBr99/nspanel-lovelace-ui/wiki/iobroker---Basisinstallation#3-berry-treiber-installieren
und schauen das da auch nur die Dateien drauf sind wie im Bild. -
@danny_v1
Ich hab das Dateisystem noch mal aufgeräumt und nochmals ein FlashNextion versucht, allerdings ohne Erfolg. Es werden immer noch die "alten" Seiten angezeigt -
@l4rs sagte in SONOFF NSPanel mit Lovelace UI:
welche Meldungen bekommst du den in der Konsole, bite hier posten
-
@tt-tom Das sind nur drei Zeilen, wie auch schon oben
geschrieben. Hier noch mal zur Verdeutlichung:
@l4rs
Da gab es doch mal verschiedenen Varianten mit dem FlashNextion. Liegt hier Irgendwo zwischen den Posts.Gruß Tom
https://github.com/tt-tom17
Wenn meine Hilfe erfolgreich war, benutze bitte das Voting unten rechts im BeitragNSPanel Script Wiki
https://github.com/joBr99/nspanel-lovelace-ui/wikiNSPanel Adapter Wiki
https://github.com/ticaki/ioBroker.nspanel-lovelace-ui/wiki -
@l4rs
Da gab es doch mal verschiedenen Varianten mit dem FlashNextion. Liegt hier Irgendwo zwischen den Posts.https://forum.iobroker.net/post/960535 ich denke ihr meint diesen Post
-
https://forum.iobroker.net/post/960535 ich denke ihr meint diesen Post
-
Hi Leute ich suche im Script die Stelle wo man einstellen kann, wie lange eine Custom Seite aktiv sein soll, bzw. die Zeit bis wieder auf die Startseite (Uhrzeit mit Weatherforecast) umgestellt wird. Kann mir einer sagen wo ich das finde?
Danke!Edit: hat sich erledigt, habs gefunden -> timeoutScreensaver
-
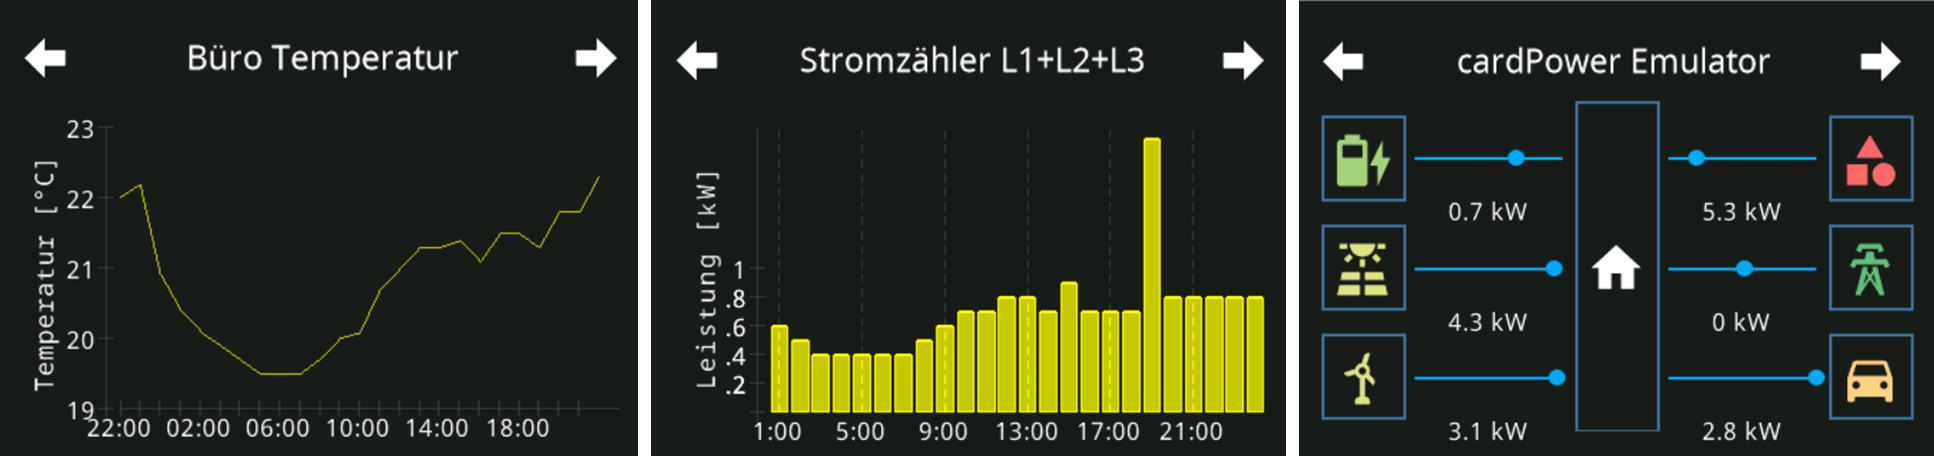
@armilar Hallo Armilar, ich bin zurück aber leider nicht weiter. Nachdem mein ganzes Zigbee Netzwerk 3 Wochen ausgefallen war läuft jetzt alles wieder und der Graph hat was zum anzeigen. Leider zeigt er nicht den ganzen Tag an, sondern bringt die Achsen durcheinander:
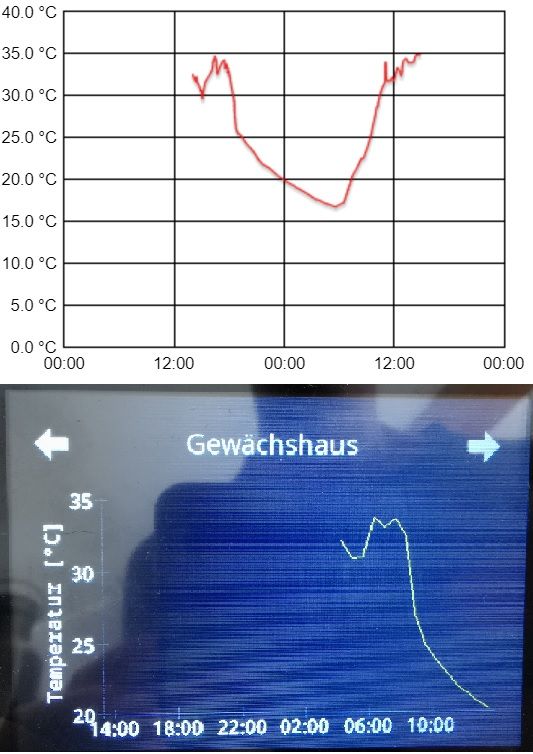
Oben der Graph aus Flot wie er sein sollte, unten was das Panel anzeigt. Das Panel "hinkt" etwa 9 Stunden hinterher und die eingestellten Werte der Y-Achse aus dem Skript werden auch ignoriert.
Das Skript zum erstellen des Graph:const sourceDP = 'alias.0.NSPanel_1.Sensor_temp_gewächshaus.ACTUAL'; const targetDP = '0_userdata.0.NSPanel.1.Charts.Temp_Gewächshaus'; const numberOfHoursAgo = 24; // Period of time in hours which shall be visualized const xAxisTicksEveryM = 240; // Time after x axis gets a tick in minutes const xAxisLabelEveryM = 240; // Time after x axis is labeled in minutes const historyInstance = 'history.0'; const date = new Date(); const start_date = new Date(date.getFullYear(), date.getMonth(), date.getDate(), 0, 0, 0); const end_date = new Date(date.getFullYear(), date.getMonth(), date.getDate(), 23, 59, 59); const Debug = false; const maxX = 1420; const limitMeasurements = 35; createState(targetDP, "", { name: 'SensorGrid', desc: 'Sensor Values [~<time>:<value>]*', type: 'string', role: 'value', }); on({id: sourceDP, change: "any"}, async function (obj) { sendTo(historyInstance, 'getHistory', { id: sourceDP, options: { start: start_date, end: end_date, count: limitMeasurements, limit: limitMeasurements, aggregate: 'average' } }, function (result) { var ticksAndLabels = "" var coordinates = ""; var cardLChartString = ""; let ticksAndLabelsList = [] var date = new Date(); date.setMinutes(0, 0, 0); var ts = Math.round(date.getTime() / 1000); var tsYesterday = ts - (numberOfHoursAgo * 3600); for (var x = tsYesterday, i = 0; x < ts; x += (xAxisTicksEveryM * 60), i += xAxisTicksEveryM) { if (i % xAxisLabelEveryM) { ticksAndLabelsList.push(i); } else { var currentDate = new Date(x * 1000); // Hours part from the timestamp var hours = "0" + currentDate.getHours(); // Minutes part from the timestamp var minutes = "0" + currentDate.getMinutes(); // Seconds part from the timestamp var seconds = "0" + currentDate.getSeconds(); var formattedTime = hours.slice(-2) + ':' + minutes.slice(-2); ticksAndLabelsList.push(String(i) + "^" + formattedTime); } } ticksAndLabels = ticksAndLabelsList.join("+"); let list = []; let offSetTime = Math.round(result.result[0].ts / 1000); let counter = Math.round((result.result[result.result.length -1 ].ts / 1000 - offSetTime) / maxX); for (var i = 0; i < result.result.length; i++) { var time = Math.round(((result.result[i].ts / 1000) - offSetTime) / counter); var value = Math.round(result.result[i].val * 10); if ((value != null) && (value != 0)){ list.push(time + ":" + value) } } coordinates = list.join("~"); cardLChartString = ticksAndLabels + '~' + coordinates setState(targetDP, cardLChartString, true); if (Debug) console.log(cardLChartString); }); });Der Datenpunkt der erstellt wird:
0^14:00+240^18:00+480^22:00+720^02:00+960^06:00+1200^10:00~843:322~885:310~926:312~967:339~1008:332~1049:338~1090:326~1131:269~1173:248~1214:237~1255:228~1296:219~1337:214~1378:207~1419:203und mein Panel Skript
let Temp_Gewaechshaus = <PageChart>
{
    "type": "cardLChart",
    "heading": "Gewächshaus",
    "useColor": true,
    'items': [<PageItem>{
                id: 'alias.0.NSPanel_1.Chart_temp_gewaechshaus',
                yAxis: 'Temperatur [°C]',
                yAxisTicks: [0,50,100,150,200,250,300,350,400],
                onColor: Yellow
             }]
};
Ich würde schätzen, dass die zusätzlichen Angaben im Skript (um Zeile 42?) zum Graph die neu eingefügte Zeitachse mit start_date und end_date überschreiben, aus jeden Fall übernimmt er aber auch nicht die Temperaturskala aus dem Panel-Skript.
Leider verstehe ich den Code nur minimal. -
@armilar Hallo Armilar, ich bin zurück aber leider nicht weiter. Nachdem mein ganzes Zigbee Netzwerk 3 Wochen ausgefallen war läuft jetzt alles wieder und der Graph hat was zum anzeigen. Leider zeigt er nicht den ganzen Tag an, sondern bringt die Achsen durcheinander:
Oben der Graph aus Flot wie er sein sollte, unten was das Panel anzeigt. Das Panel "hinkt" etwa 9 Stunden hinterher und die eingestellten Werte der Y-Achse aus dem Skript werden auch ignoriert.
Das Skript zum erstellen des Graph:const sourceDP = 'alias.0.NSPanel_1.Sensor_temp_gewächshaus.ACTUAL'; const targetDP = '0_userdata.0.NSPanel.1.Charts.Temp_Gewächshaus'; const numberOfHoursAgo = 24; // Period of time in hours which shall be visualized const xAxisTicksEveryM = 240; // Time after x axis gets a tick in minutes const xAxisLabelEveryM = 240; // Time after x axis is labeled in minutes const historyInstance = 'history.0'; const date = new Date(); const start_date = new Date(date.getFullYear(), date.getMonth(), date.getDate(), 0, 0, 0); const end_date = new Date(date.getFullYear(), date.getMonth(), date.getDate(), 23, 59, 59); const Debug = false; const maxX = 1420; const limitMeasurements = 35; createState(targetDP, "", { name: 'SensorGrid', desc: 'Sensor Values [~<time>:<value>]*', type: 'string', role: 'value', }); on({id: sourceDP, change: "any"}, async function (obj) { sendTo(historyInstance, 'getHistory', { id: sourceDP, options: { start: start_date, end: end_date, count: limitMeasurements, limit: limitMeasurements, aggregate: 'average' } }, function (result) { var ticksAndLabels = "" var coordinates = ""; var cardLChartString = ""; let ticksAndLabelsList = [] var date = new Date(); date.setMinutes(0, 0, 0); var ts = Math.round(date.getTime() / 1000); var tsYesterday = ts - (numberOfHoursAgo * 3600); for (var x = tsYesterday, i = 0; x < ts; x += (xAxisTicksEveryM * 60), i += xAxisTicksEveryM) { if (i % xAxisLabelEveryM) { ticksAndLabelsList.push(i); } else { var currentDate = new Date(x * 1000); // Hours part from the timestamp var hours = "0" + currentDate.getHours(); // Minutes part from the timestamp var minutes = "0" + currentDate.getMinutes(); // Seconds part from the timestamp var seconds = "0" + currentDate.getSeconds(); var formattedTime = hours.slice(-2) + ':' + minutes.slice(-2); ticksAndLabelsList.push(String(i) + "^" + formattedTime); } } ticksAndLabels = ticksAndLabelsList.join("+"); let list = []; let offSetTime = Math.round(result.result[0].ts / 1000); let counter = Math.round((result.result[result.result.length -1 ].ts / 1000 - offSetTime) / maxX); for (var i = 0; i < result.result.length; i++) { var time = Math.round(((result.result[i].ts / 1000) - offSetTime) / counter); var value = Math.round(result.result[i].val * 10); if ((value != null) && (value != 0)){ list.push(time + ":" + value) } } coordinates = list.join("~"); cardLChartString = ticksAndLabels + '~' + coordinates setState(targetDP, cardLChartString, true); if (Debug) console.log(cardLChartString); }); });Der Datenpunkt der erstellt wird:
0^14:00+240^18:00+480^22:00+720^02:00+960^06:00+1200^10:00~843:322~885:310~926:312~967:339~1008:332~1049:338~1090:326~1131:269~1173:248~1214:237~1255:228~1296:219~1337:214~1378:207~1419:203und mein Panel Skript
let Temp_Gewaechshaus = <PageChart>
{
    "type": "cardLChart",
    "heading": "Gewächshaus",
    "useColor": true,
    'items': [<PageItem>{
                id: 'alias.0.NSPanel_1.Chart_temp_gewaechshaus',
                yAxis: 'Temperatur [°C]',
                yAxisTicks: [0,50,100,150,200,250,300,350,400],
                onColor: Yellow
             }]
};
Ich würde schätzen, dass die zusätzlichen Angaben im Skript (um Zeile 42?) zum Graph die neu eingefügte Zeitachse mit start_date und end_date überschreiben, aus jeden Fall übernimmt er aber auch nicht die Temperaturskala aus dem Panel-Skript.
Leider verstehe ich den Code nur minimal.das Problem ist du liest die Daten aus der Datenbank von 0:00 bis 23:59 aus, die X-achse wird aber von jetzt 24h zurück berechnet. Damit hast du nur um 23:59 den kompletten Graph. Man müsste das Script statisch anpassen. (auf ein Tag )
-
Hallo, ich wollte noch mal wegen dem Timer Pop-up nachfragen.
Ich habe versucht alles wie im Wiki angegeben an zu legen.
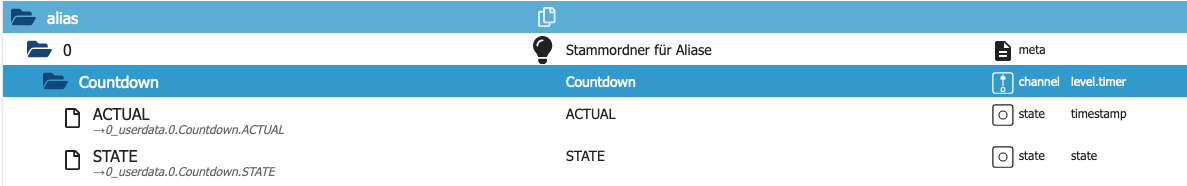
Für den zu erstellenden Datenpunkt "ACTUAL" soll die Rolle "timestamp" verwendet werden. Die habe ich aber gar nicht zur Auswahl.
Ist das ein Fehler im Wiki, obwohl auf dem Bild ja "timestamp" zu sehen ist, oder woran kann das liegen, dass ich die nicht auswählen kann?
-
Hallo, ich wollte noch mal wegen dem Timer Pop-up nachfragen.
Ich habe versucht alles wie im Wiki angegeben an zu legen.
Für den zu erstellenden Datenpunkt "ACTUAL" soll die Rolle "timestamp" verwendet werden. Die habe ich aber gar nicht zur Auswahl.
Ist das ein Fehler im Wiki, obwohl auf dem Bild ja "timestamp" zu sehen ist, oder woran kann das liegen, dass ich die nicht auswählen kann?
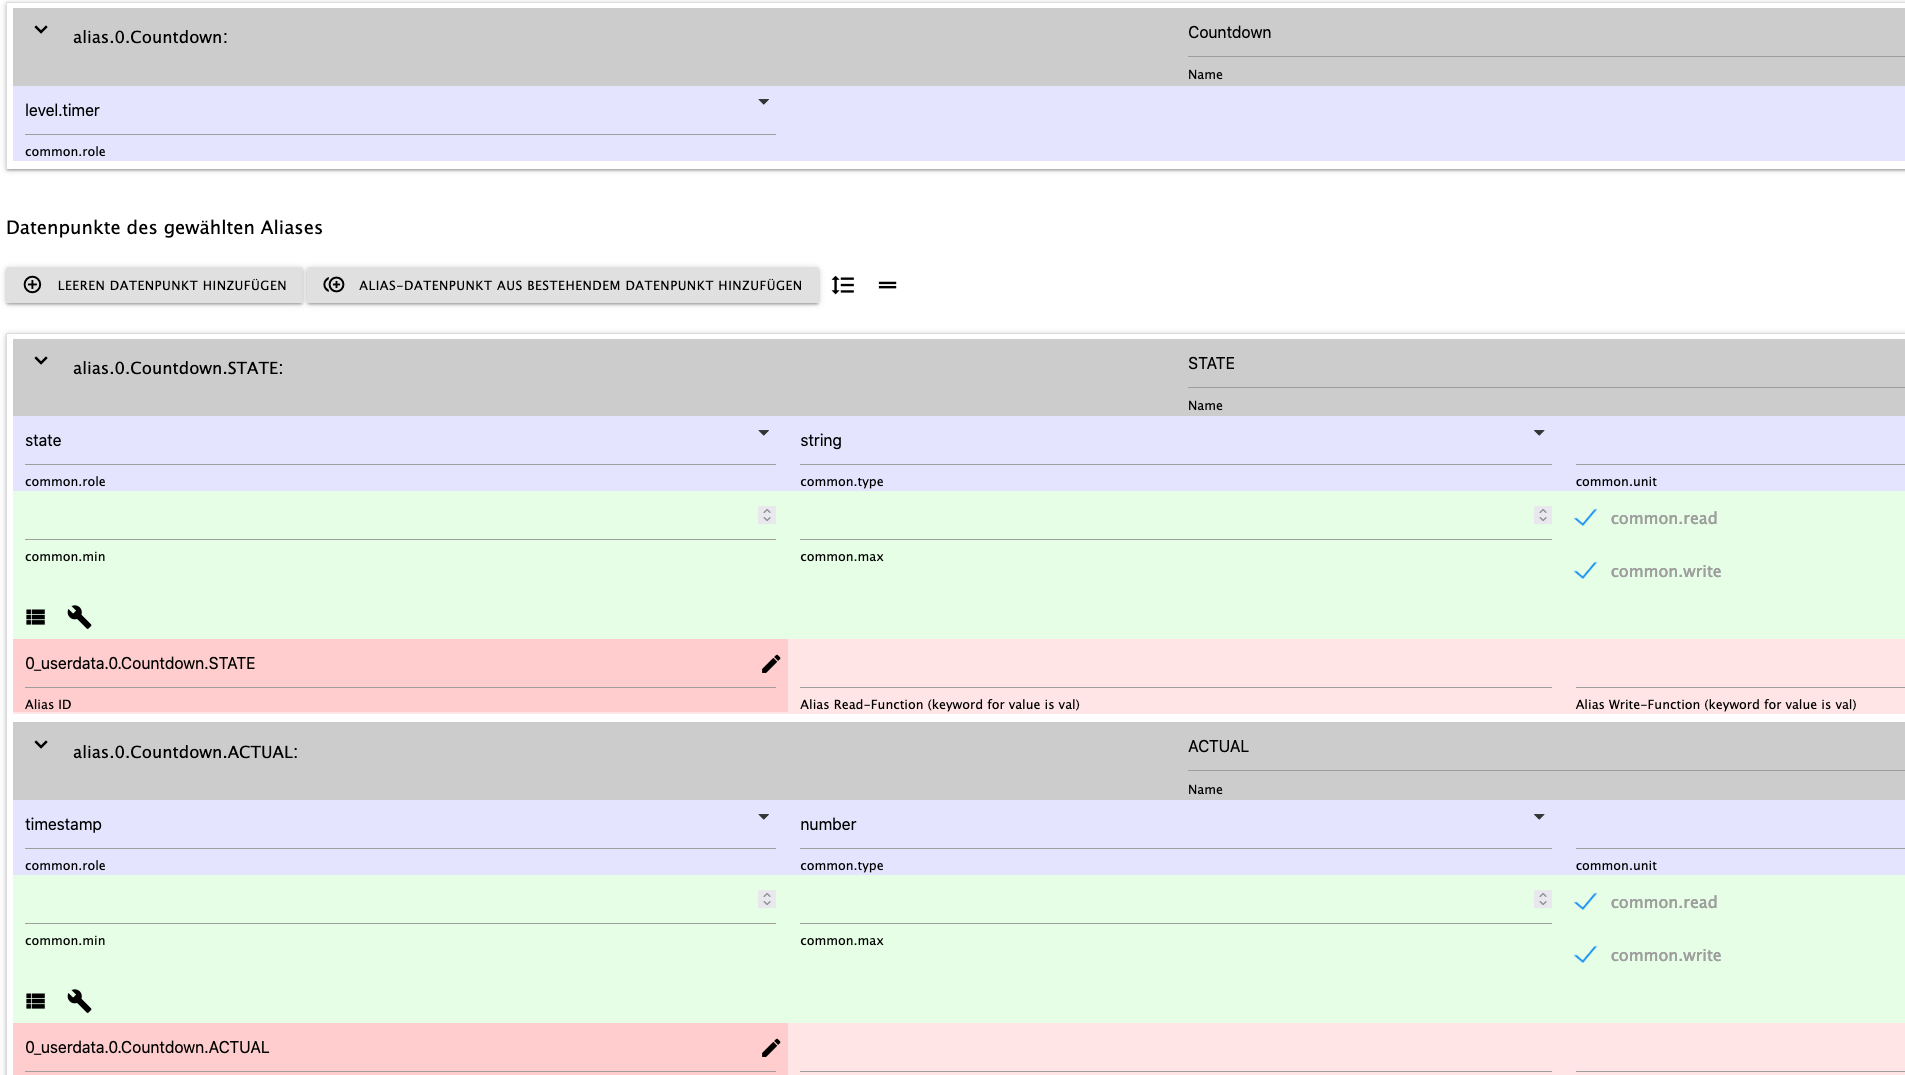
sorry, habe mir das ganze jetzt noch einmal im Wiki durchgelesen und nachvollzogen. Die Rollen sind bei mir auch nicht vorhanden, werden aber vom Script benötigt.
Ich habe folgendes gemacht. die Beiden Datenpunkte unter 0_userdata angelegt und dann mit dem AliasManager die Alias automatisch erstellen lassen, achte auf den Pfad beim Alias, ggf. anpassen. Dann mit dem AliasManager die Rollen angepasst durch einfaches eintragen der Daten und gespeichert, fertig.
-
das Problem ist du liest die Daten aus der Datenbank von 0:00 bis 23:59 aus, die X-achse wird aber von jetzt 24h zurück berechnet. Damit hast du nur um 23:59 den kompletten Graph. Man müsste das Script statisch anpassen. (auf ein Tag )
@tt-tom Genau sowas dachte ich mir schon. Weiß jemand wie das Skript angepasst werden muss?
-
@tt-tom Genau sowas dachte ich mir schon. Weiß jemand wie das Skript angepasst werden muss?
wenn du warten kannst, sehe ich mir das die Tage mal an.
EDIT: du hast mit deinen Script ein Problem:
const date = new Date;
const start_date = new Date(date.getFullYear(), date.getMonth(), date.getDate(), 0, 0, 0);
const end_date = new Date(date.getFullYear(), date.getMonth(), date.getDate(), 23, 59, 59);
du hast ein konstantes Start- und Enddatum, welches beim Start des Script gesetzt wird und kann dann nicht mehr geändert werden im Script. Bedeutet du liest immer die selben Daten aus der History DB.
Das muss du schon mal anpassen und austauschen.
on({id: sourceDP, change: "any"}, async function (obj) { let date = new Date; let start_date = new Date(date.getFullYear(), date.getMonth(), date.getDate(), 0, 0, 0); let end_date = new Date(date.getFullYear(), date.getMonth(), date.getDate(), 23, 59, 59); sendTo(historyInstance, 'getHistory', { id: sourceDP, options: { start: start_date, end: end_date, count: limitMeasurements, limit: limitMeasurements, aggregate: 'average' } }, function (result) { var ticksAndLabels = "" var coordinates = ""; var cardLChartString = ""; let ticksAndLabelsList = [] var ts = Math.round(start_date.getTime() / 1000); var tsYesterday = Math.round(end_date.getTime() / 1000); for (var x = tsYesterday, i = 0; x < ts; x += (xAxisTicksEveryM * 60), i += xAxisTicksEveryM) -
sorry, habe mir das ganze jetzt noch einmal im Wiki durchgelesen und nachvollzogen. Die Rollen sind bei mir auch nicht vorhanden, werden aber vom Script benötigt.
Ich habe folgendes gemacht. die Beiden Datenpunkte unter 0_userdata angelegt und dann mit dem AliasManager die Alias automatisch erstellen lassen, achte auf den Pfad beim Alias, ggf. anpassen. Dann mit dem AliasManager die Rollen angepasst durch einfaches eintragen der Daten und gespeichert, fertig.
-
@tt-tom Ok, also war ich doch nicht zu blind es zu finden. Wie hast du die Rollen angepasst, bzw wie sehen deine fertigen Alias Datenpunkte aus?

Support us
180
Online32.4k
Users81.3k
Topics1.3m
Posts