NEWS

HowTo: Zusatz-Programme fuer jarvis v3
-
@mcu Oben links kann ich meine Grafana-Plots durchswitchen ja.
Unten Links würde ich das gleiche gerne mit "StateLists" machen.
Ober eben halt nur die ausgewählte/rechts angeklickte anzeigen. -
@mcu
Sry nein das ist unabhängig.Mit Klicks auf die grün markiertern Leistungswerte Toggle ich oben links durch die Grafiken.
Das funktioniert bereits 1A.Mit Klicks auf die orange markierten Kreise (werden evtl. noch mehr) würde ich gerne durch StateLists "togglen" welche dann unten Links stehen sollen.
Ich hoff ,ich konnte mich verständlich ausdrücken.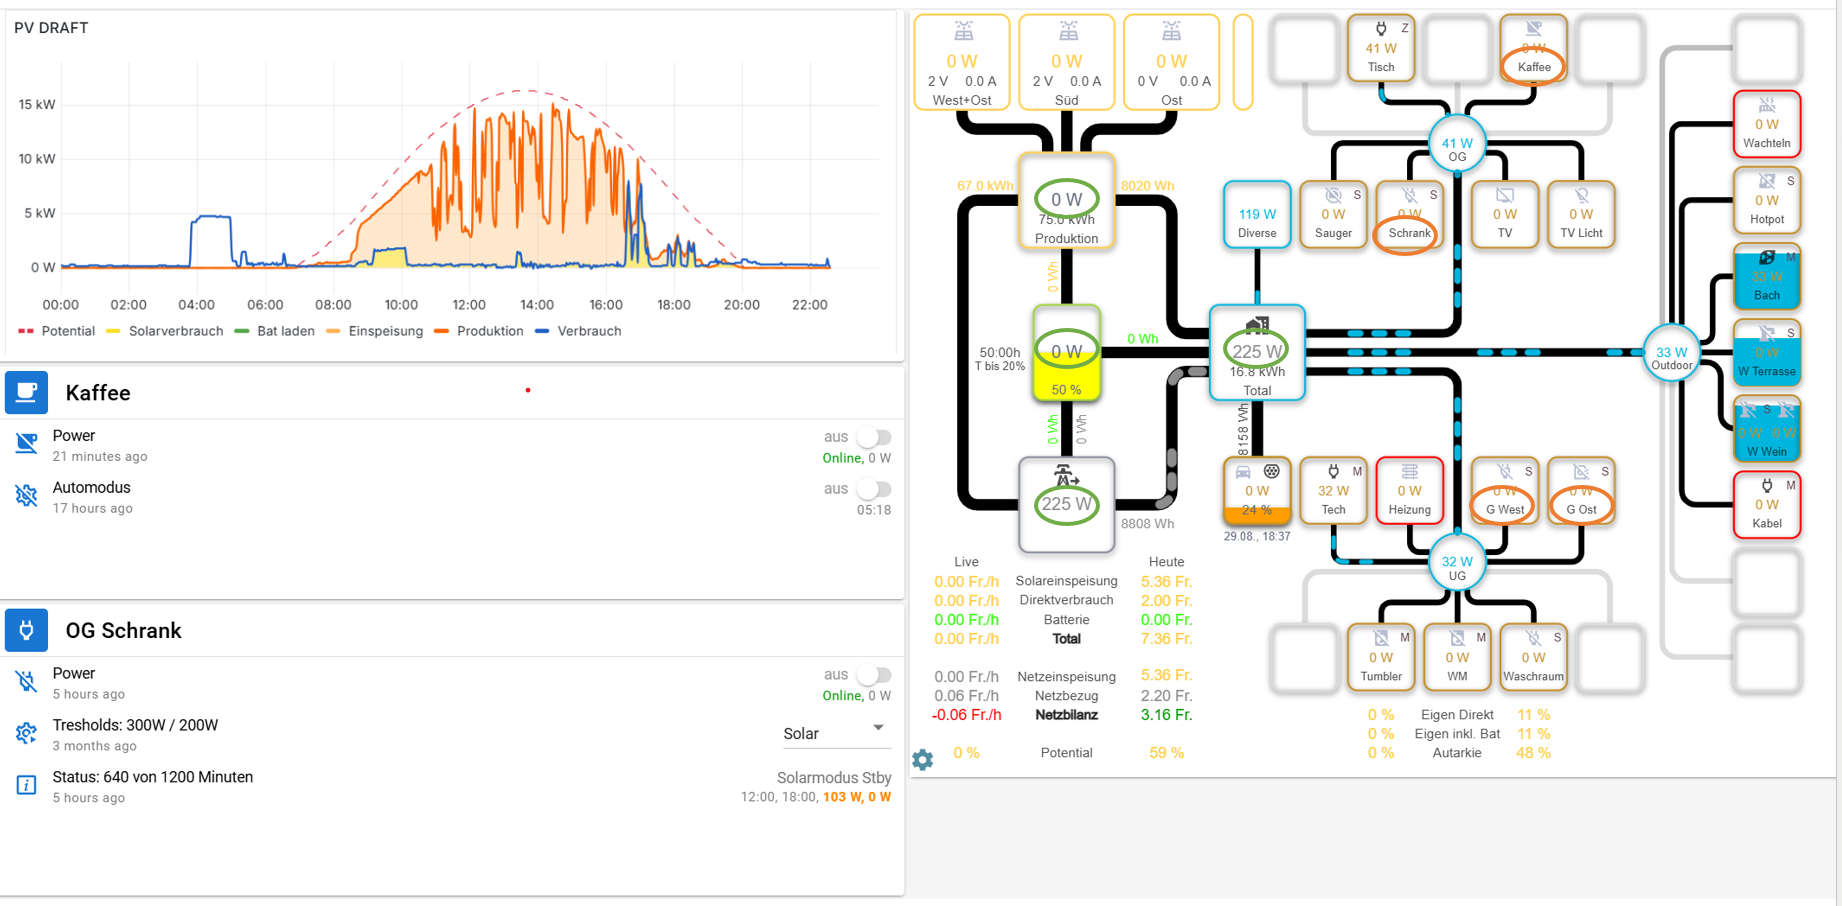
-
@mcu
Sry nein das ist unabhängig.Mit Klicks auf die grün markiertern Leistungswerte Toggle ich oben links durch die Grafiken.
Das funktioniert bereits 1A.Mit Klicks auf die orange markierten Kreise (werden evtl. noch mehr) würde ich gerne durch StateLists "togglen" welche dann unten Links stehen sollen.
Ich hoff ,ich konnte mich verständlich ausdrücken.@mickemup
Order number ändern zieht nur auf dem Handy. Wäre schneller, da man nur die Reihenfolge ändern müsste.
Aber für PC und Tablet muss man alle nachfolgenden bzw. darunter liegenden Widgets neu berechnen, in Abhängigkeit von der Anzeige (einige sind ja ausgeblendet) und den Werten vom aktuellen Widget, welches man an die neue Position setzen will. -
@mabbi Stell bitte die JSON der Modul-Konfiguration hinein, damit man sich daran orientieren kann, wenn man es nachbauen möchte. Danke.
Würde ich grne machen, aber wo finde ich die ?
Ich habe die beiden Anzeigen komplett mit dem Diagramme-Editor gebaut und dann in vis eingfügt.
Finde dort aber keine Möglichkeit, ein json anzuzeigen oder zu exportieren.In Dateien/echart liegen zwar json Dateien drin, die haben aber imho nichts direkt mit den Diagrammen zu tun ?
-
@mcu: Mir hätte der Hinweis gereicht, dass ich dazu Expertenmodus brauche
")
Das wäre z.B. der untere chart für die Akku-Visualisierung:
- die XXX repräsentieren Platzhalter für persönliche Daten
- die Skalierung bei der Energiefluss-Visualisierung ist auf 20 KW begrenzt obwohl die Anlage in der Spitze knapp 23 KW-Peak kann, mich interessieren die seltenen Spitzen einfach nicht und so ist es optisch besser dargestellt
{
  "common": {
    "name": "D_Akku"
  },
  "native": {
    "url": "",
    "data": {
      "lines": [
        {
          "name": "SOC",
          "id": "zendure-solarflow.0.XXX.XXX.electricLevel",
          "instance": "system.adapter.history.0",
          "thickness": "1",
          "chartType": "spline",
          "aggregate": "minmax",
          "isBoolean": null,
          "symbolSize": 3,
          "validTime": "",
          "unit": "  %",
          "color": "#0052ff",
          "fill": 0.4,
          "shadowsize": "",
          "min": "-100",
          "max": "100",
          "ignoreNull": "0",
          "noFuture": false,
          "percentile": 50,
          "integralUnit": 60,
          "integralInterpolation": "none",
          "yticks": "2",
          "xaxe": "",
          "xticks": "6",
          "yOffset": "0",
          "points": false,
          "hide": false,
          "yaxe": "off"
        },
        {
          "name": "Laden",
          "id": "zendure-solarflow.0.XXX.XXX.gridInputPower",
          "instance": "system.adapter.history.0",
          "thickness": "1",
          "chartType": "steps",
          "aggregate": "minmax",
          "symbolSize": 3,
          "validTime": "",
          "xaxe": "off",
          "unit": "  kw",
          "min": "-2.300",
          "max": "2.300",
          "color": "#147e4b",
          "fill": 0.2,
          "commonYAxis": "",
          "yticks": "-1",
          "ignoreNull": "0",
          "noFuture": false,
          "yaxe": "left",
          "convert": "val / 1000"
        },
        {
          "name": "Entladen",
          "id": "zendure-solarflow.0.XXX.XXX.outputHomePower",
          "instance": "system.adapter.history.0",
          "thickness": "1",
          "chartType": "steps",
          "aggregate": "minmax",
          "symbolSize": 3,
          "validTime": "",
          "xaxe": "off",
          "unit": "W",
          "color": "#901d1e",
          "convert": "val * -1 / 1000",
          "max": "2.300",
          "min": "-2.300",
          "fill": 0.2,
          "yOffset": "",
          "ignoreNull": "0",
          "noFuture": false,
          "yticks": "1",
          "yaxe": "off",
          "commonYAxis": "1"
        },
        {
          "name": "Leistung gesamt",
          "id": "0_userdata.0.Datenpunkte.PV.Leistung_gesamt",
          "instance": "system.adapter.sql.0",
          "thickness": "1",
          "chartType": "line",
          "aggregate": "onchange",
          "isBoolean": null,
          "symbolSize": 3,
          "validTime": 35,
          "fill": 0.1,
          "min": "-8",
          "max": "22",
          "convert": "val / 1000",
          "color": "#b89021",
          "xticks": "4",
          "commonYAxis": "1",
          "ignoreNull": "0"
        }
      ],
      "marks": [
        {
          "color": "#0051ff",
          "lineId": "0",
          "upperValueOrId": "10",
          "lowerValueOrId": "",
          "lineStyle": "dashed",
          "text": "10 % ",
          "textColor": "#0051ff"
        },
        {
          "color": "#5c1011",
          "lineId": "2",
          "upperValueOrId": "-0.5",
          "lowerValueOrId": "",
          "fill": 0,
          "lineStyle": "dotted",
          "text": "500 W ",
          "textSize": "10",
          "textColor": "#9b2e2f"
        },
        {
          "color": "#5c1011",
          "lineId": "2",
          "upperValueOrId": "-1",
          "lowerValueOrId": "",
          "fill": 0,
          "lineStyle": "dotted",
          "text": "1000 W ",
          "textSize": "10",
          "textColor": "#9b2e2f"
        },
        {
          "color": "#5c1011",
          "lineId": "2",
          "upperValueOrId": "-1.5",
          "lowerValueOrId": "",
          "fill": 0,
          "lineStyle": "dotted",
          "text": "1500 W ",
          "textSize": "10",
          "textColor": "#9b2e2f"
        },
        {
          "color": "#1d6923",
          "lineId": "1",
          "upperValueOrId": "2",
          "lowerValueOrId": "",
          "fill": 0,
          "lineStyle": "dotted",
          "text": "2000 W ",
          "textSize": "10",
          "textColor": "#1d6923"
        },
        {
          "color": "#1d6923",
          "lineId": "1",
          "upperValueOrId": "1.5",
          "lowerValueOrId": "",
          "fill": 0,
          "lineStyle": "dotted",
          "text": "1500 W ",
          "textSize": "10",
          "textColor": "#1d6923"
        },
        {
          "color": "#1d6923",
          "lineId": "1",
          "upperValueOrId": "1",
          "lowerValueOrId": "",
          "fill": 0,
          "lineStyle": "dotted",
          "text": "1000 W ",
          "textSize": "10",
          "textColor": "#1d6923"
        },
        {
          "color": "#1d6923",
          "lineId": "1",
          "upperValueOrId": "0.5",
          "lowerValueOrId": "",
          "fill": 0,
          "lineStyle": "dotted",
          "text": "500 W ",
          "textSize": "10",
          "textColor": "#1d6923"
        },
        {
          "color": "#5c1011",
          "lineId": "2",
          "upperValueOrId": "-2",
          "lowerValueOrId": "",
          "fill": 0,
          "lineStyle": "dotted",
          "text": "2000 W ",
          "textSize": "10",
          "textColor": "#9b2e2f"
        }
      ],
      "timeType": "relative",
      "relativeEnd": "now",
      "range": "1440",
      "aggregateType": "step",
      "aggregateSpan": "1",
      "legend": "",
      "hoverDetail": true,
      "zoom": true,
      "animation": 0,
      "live": "300",
      "ticks": "",
      "width": "",
      "height": "",
      "noBorder": "",
      "window_bg": "#000000",
      "bg_custom": "",
      "x_labels_color": "",
      "y_labels_color": "",
      "border_color": "#343434",
      "grid_color": "",
      "grid_hideX": true,
      "grid_hideY": true,
      "border_width": "5",
      "barColor": "",
      "barLabels": "topover",
      "barWidth": "",
      "barFontSize": "",
      "barFontColor": "",
      "title": "",
      "titlePos": "",
      "titleColor": "",
      "titleSize": "",
      "legColumns": "",
      "legBgOpacity": "",
      "legBg": "",
      "timeFormat": "",
      "export": false,
      "legendDirection": "",
      "useComma": false,
      "noBackground": true,
      "legActual": false,
      "legFontSize": "",
      "legendHeight": "",
      "resetZoom": "600",
      "autoGridPadding": false,
      "theme": "default",
      "hoverNoInterpolate": false,
      "hoverNoNulls": false,
      "timeFormatCustom": false,
      "border_style": "ridge",
      "border_padding": "5"
    }
  },
  "type": "chart",
  "_id": "echarts.0.D_Akku",
  "acl": {
    "object": XXX,
    "owner": "XXX.XXX.XXX",
    "ownerGroup": "XXX.XXX.XXX"
  },
  "from": "XXX.XXX.XXX.0",
  "user": "XXX.XXX.XXX",
  "ts": XXX
}
Und der obere Energiefluss-Visualisierung:
{
  "common": {
    "name": "D_Energie"
  },
  "native": {
    "url": "",
    "data": {
      "lines": [
        {
          "name": "PV-Leistung",
          "id": "0_userdata.0.Datenpunkte.PV.Leistung_gesamt",
          "instance": "system.adapter.sql.0",
          "thickness": "1",
          "chartType": "auto",
          "aggregate": "max",
          "isBoolean": null,
          "symbolSize": 3,
          "validTime": "",
          "unit": "  kW",
          "color": "#1a98a6",
          "fill": 0.2,
          "shadowsize": "",
          "min": "-14",
          "max": "20",
          "ignoreNull": "0",
          "noFuture": false,
          "percentile": 50,
          "integralUnit": 60,
          "integralInterpolation": "none",
          "yticks": "-1",
          "xaxe": "",
          "xticks": "6",
          "yOffset": "0",
          "points": false,
          "hide": false,
          "yaxe": "left",
          "convert": "val / 1000",
          "afterComma": "3"
        },
        {
          "name": "EV-Ladestrom",
          "id": "0_userdata.0.Datenpunkte.EV_Wallbox.EV-Ladestrom",
          "instance": "system.adapter.history.0",
          "thickness": "1",
          "chartType": "auto",
          "aggregate": "max",
          "isBoolean": null,
          "symbolSize": 3,
          "validTime": "",
          "fill": 0.2,
          "min": "-8",
          "max": "22",
          "convert": "val / 1000 * -1",
          "color": "#702ce6",
          "xticks": "4",
          "commonYAxis": "0",
          "ignoreNull": "0",
          "afterComma": "3"
        },
        {
          "name": "Eigenverbrauch",
          "id": "0_userdata.0.Datenpunkte.Strom.Eigenverbrauch",
          "instance": "system.adapter.sql.0",
          "thickness": "1",
          "chartType": "auto",
          "aggregate": "onchange",
          "isBoolean": null,
          "symbolSize": 3,
          "validTime": 35,
          "fill": 0.2,
          "min": "-8",
          "max": "22",
          "convert": "val / 1000 * -1",
          "color": "#00687d",
          "xticks": "4",
          "commonYAxis": "0",
          "ignoreNull": "0",
          "afterComma": "3"
        },
        {
          "name": "Netzbezug",
          "id": "0_userdata.0.Datenpunkte.Strom.Netzbezug",
          "instance": "system.adapter.sql.0",
          "thickness": "1",
          "chartType": "auto",
          "aggregate": "onchange",
          "isBoolean": null,
          "symbolSize": 3,
          "validTime": 35,
          "fill": 0.3,
          "min": "-8",
          "max": "22",
          "convert": "val / 1000 * -1",
          "color": "#b82124",
          "xticks": "4",
          "commonYAxis": "0",
          "ignoreNull": "0",
          "afterComma": "3"
        },
        {
          "name": "Einspeisung",
          "id": "0_userdata.0.Datenpunkte.Strom.Einspeisung",
          "instance": "system.adapter.sql.0",
          "thickness": "1",
          "chartType": "auto",
          "aggregate": "onchange",
          "isBoolean": null,
          "symbolSize": 3,
          "validTime": 35,
          "fill": 0.4,
          "min": "-8",
          "max": "22",
          "convert": "val / 1000",
          "color": "#10952f",
          "xticks": "4",
          "commonYAxis": "0",
          "ignoreNull": "0",
          "afterComma": "3"
        },
        {
          "name": "Klima Buero OG Betrieb",
          "id": "0_userdata.0.Datenpunkte.Temperatur-Steuerung.Klima_Buero_OG_Betrieb",
          "instance": "system.adapter.sql.0",
          "thickness": "1",
          "chartType": "line",
          "aggregate": "minmax",
          "isBoolean": null,
          "symbolSize": 3,
          "validTime": "",
          "fill": 1,
          "min": "0",
          "max": "10",
          "convert": "val * 0.25",
          "color": "#008b47",
          "xticks": "4",
          "commonYAxis": "",
          "ignoreNull": "false",
          "yOffset": "0",
          "percentile": 50,
          "integralUnit": 60,
          "integralInterpolation": "none",
          "yticks": "-1"
        },
        {
          "name": "Klima Buero Betrieb",
          "id": "0_userdata.0.Datenpunkte.Temperatur-Steuerung.Klima_Buero_Betrieb",
          "instance": "system.adapter.sql.0",
          "thickness": "1",
          "chartType": "line",
          "aggregate": "minmax",
          "isBoolean": null,
          "symbolSize": 3,
          "validTime": "",
          "fill": 1,
          "min": "0",
          "max": "10",
          "convert": "(val * 0.125)",
          "color": "#007583",
          "xticks": "4",
          "commonYAxis": "",
          "ignoreNull": "false",
          "yOffset": "0",
          "yticks": "-1"
        }
      ],
      "marks": [
        {
          "color": "#5c1011",
          "lineId": "0",
          "upperValueOrId": "-2",
          "lowerValueOrId": "",
          "fill": 0,
          "lineStyle": "dotted",
          "text": "2 KW ",
          "textSize": "10",
          "textColor": "#9b2e2f"
        },
        {
          "color": "#5c1011",
          "lineId": "0",
          "upperValueOrId": "-4",
          "lowerValueOrId": "",
          "fill": 0,
          "lineStyle": "dotted",
          "text": "4 KW ",
          "textSize": "10",
          "textColor": "#9b2e2f"
        },
        {
          "color": "#5c1011",
          "lineId": "0",
          "upperValueOrId": "-6",
          "lowerValueOrId": "",
          "fill": 0,
          "lineStyle": "dotted",
          "text": "6 KW ",
          "textSize": "10",
          "textColor": "#9b2e2f"
        },
        {
          "color": "#1d6923",
          "lineId": "0",
          "upperValueOrId": "2",
          "lowerValueOrId": "",
          "fill": 0,
          "lineStyle": "dotted",
          "text": "2 KW ",
          "textSize": "10",
          "textColor": "#1d6923"
        },
        {
          "color": "#1d6923",
          "lineId": "0",
          "upperValueOrId": "4",
          "lowerValueOrId": "",
          "fill": 0,
          "lineStyle": "dotted",
          "text": "4 KW ",
          "textSize": "10",
          "textColor": "#1d6923"
        },
        {
          "color": "#1d6923",
          "lineId": "0",
          "upperValueOrId": "6",
          "lowerValueOrId": "",
          "fill": 0,
          "lineStyle": "dotted",
          "text": "6 KW ",
          "textSize": "10",
          "textColor": "#1d6923"
        },
        {
          "color": "#1d6923",
          "lineId": "0",
          "upperValueOrId": "8",
          "lowerValueOrId": "",
          "fill": 0,
          "lineStyle": "dotted",
          "text": "8 KW ",
          "textSize": "10",
          "textColor": "#1d6923"
        },
        {
          "color": "#1d6923",
          "lineId": "0",
          "upperValueOrId": "10",
          "lowerValueOrId": "",
          "fill": 0,
          "lineStyle": "dotted",
          "text": "10 KW ",
          "textSize": "10",
          "textColor": "#1d6923"
        },
        {
          "color": "#1d6923",
          "lineId": "0",
          "upperValueOrId": "12",
          "lowerValueOrId": "",
          "fill": 0,
          "lineStyle": "dotted",
          "text": "12 KW ",
          "textSize": "10",
          "textColor": "#1d6923"
        },
        {
          "color": "#1d6923",
          "lineId": "0",
          "upperValueOrId": "14",
          "lowerValueOrId": "",
          "fill": 0,
          "lineStyle": "dotted",
          "text": "14 KW ",
          "textSize": "10",
          "textColor": "#1d6923"
        },
        {
          "color": "#1d6923",
          "lineId": "0",
          "upperValueOrId": "16",
          "lowerValueOrId": "",
          "fill": 0,
          "lineStyle": "dotted",
          "text": "16 KW ",
          "textSize": "10",
          "textColor": "#1d6923"
        },
        {
          "color": "#1d6923",
          "lineId": "0",
          "upperValueOrId": "18",
          "lowerValueOrId": "",
          "fill": 0,
          "lineStyle": "dotted",
          "text": "18 KW ",
          "textSize": "10",
          "textColor": "#1d6923"
        },
        {
          "color": "#5c1011",
          "lineId": "0",
          "upperValueOrId": "-8",
          "lowerValueOrId": "",
          "fill": 0,
          "lineStyle": "dotted",
          "text": "8 KW ",
          "textSize": "10",
          "textColor": "#9b2e2f"
        },
        {
          "color": "#5c1011",
          "lineId": "0",
          "upperValueOrId": "-10",
          "lowerValueOrId": "",
          "fill": 0,
          "lineStyle": "dotted",
          "text": "10 KW ",
          "textSize": "10",
          "textColor": "#9b2e2f"
        },
        {
          "color": "#5c1011",
          "lineId": "0",
          "upperValueOrId": "-12",
          "lowerValueOrId": "",
          "fill": 0,
          "lineStyle": "dotted",
          "text": "12 KW ",
          "textSize": "10",
          "textColor": "#9b2e2f"
        },
        {
          "color": "#5c1011",
          "lineId": "0",
          "upperValueOrId": "-14",
          "lowerValueOrId": "",
          "fill": 0,
          "lineStyle": "dotted",
          "text": "14 KW ",
          "textSize": "10",
          "textColor": "#9b2e2f"
        },
        {
          "color": "#1d6923",
          "lineId": "0",
          "upperValueOrId": "20",
          "lowerValueOrId": "",
          "fill": 0,
          "lineStyle": "dotted",
          "text": "20 KW ",
          "textSize": "10",
          "textColor": "#1d6923"
        }
      ],
      "timeType": "relative",
      "relativeEnd": "now",
      "range": "1440",
      "aggregateType": "step",
      "aggregateSpan": "1",
      "legend": "",
      "hoverDetail": true,
      "zoom": true,
      "animation": 0,
      "live": "300",
      "ticks": "",
      "width": "",
      "height": "",
      "noBorder": "",
      "window_bg": "#000000",
      "bg_custom": "",
      "x_labels_color": "",
      "y_labels_color": "",
      "border_color": "#343434",
      "grid_color": "",
      "grid_hideX": true,
      "grid_hideY": true,
      "border_width": "5",
      "barColor": "",
      "barLabels": "topover",
      "barWidth": "",
      "barFontSize": "",
      "barFontColor": "",
      "title": "",
      "titlePos": "",
      "titleColor": "",
      "titleSize": "",
      "legColumns": "",
      "legBgOpacity": "",
      "legBg": "",
      "timeFormat": "",
      "export": false,
      "legendDirection": "",
      "useComma": false,
      "noBackground": true,
      "legActual": false,
      "legFontSize": "",
      "legendHeight": "",
      "resetZoom": "600",
      "autoGridPadding": false,
      "theme": "default",
      "hoverNoInterpolate": false,
      "hoverNoNulls": false,
      "timeFormatCustom": false,
      "border_style": "ridge",
      "border_padding": "5"
    }
  },
  "type": "chart",
  "_id": "echarts.0.D_Energie",
  "acl": {
    "object": XXX,
    "owner": "XXX.XXX.XXX",
    "ownerGroup": "XXX.XXX.XXX"
  },
  "from": "XXX.XXX.XXX.XXX",
  "user": "XXX.XXX.XXX",
  "ts": XXX
}
Ich weiss aber nicht, ob das wirklich als Vorlage taugt, ich benutze ja viele eigene Datenpunkte die in scripts errechnet/geschrieben werden. Deren Bezeichnung ist allerdings imho ziemlich eindeutig.
Ich hoffe es hilft anderen User weiter.
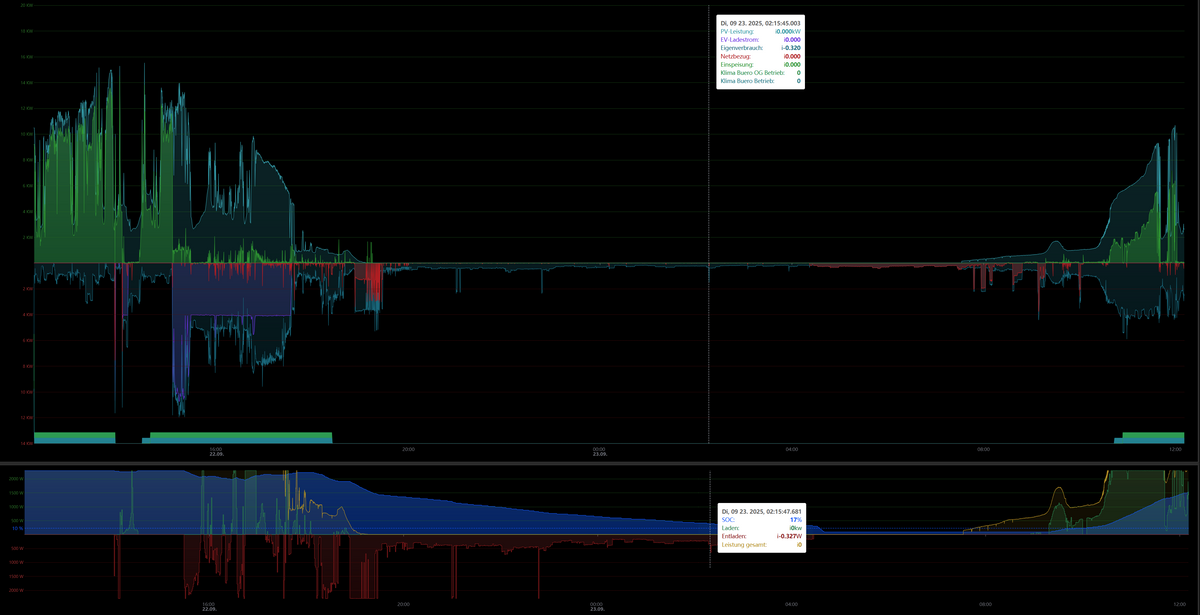
So sieht dann ein guter Tag aus:
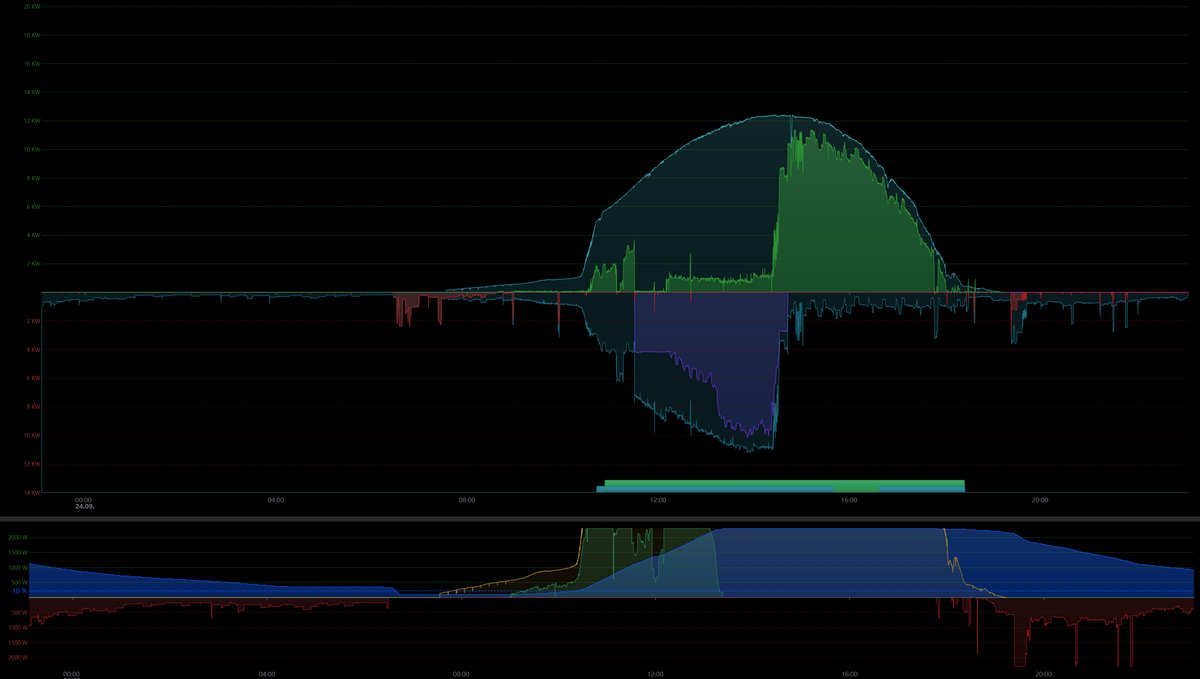
Viel Sonne, keine Wolken aber etwas dunstig...
Das sollte grob das ober Diagramm erklären:
- grün nach oben ist PV-Einspeisung, rot nach unten Netzbezug
- die fast transparenten Flächen mit Outlines nach oben und unten Gesamt-PV-Ertrag bzw. eigener Energiebedarf
- die beiden Balken unten repräsentieren die Verwendung der Klmaanlagen im EG und OG
- Morgens liegen wir leider bis ca. 10:30 im Baumschatten von hohen Eichen - wenig PC-Ertrag und 'nur' 10 Module auf der Ostseite
- zuerst wurde der Haus-Akku geladen (letzte Nacht völlig leer gefahren bis in die Abschaltung bei SOC 15% )
- als genug PV Überschuss da war kamen dann nacheinander die 4x Klimas dazu, repräsentiert durch die Balken unten im oberen Diagramm für EG und OG und heizten das Haus
- danach hat sich dann das PV-Überschussladen des EV mit ca. 4 kW Minimum zugeschaltet
- als der Hausakku voll war hat das EV bis zu 10.7 KW Ladeleistung erhalten, man sieht schön wie ich ab einem Level über 5 KW Ladeleistung anfange, einen 1 KW Einspeisepuffer aufzubauen, damit ich die Wallbox nicht zu oft ansteuern muss
- gegen 15:00 Uhr hatte sich das EV seine benötigten ca. 22 KWh gesichert und die Wallbox wurde runtergefahren
- gegen 18:45 Uhr gingen dann die Klimaanlagen mangels PV-Überschuss automatisch aus
- zwischendurch habe ich manuell die Klimaanlagen im EG aus und später wieder eingeschaltet, mir war nachmittags einfach gefühlt zu warm im Büro
Das untere Akku-Diagramm ist glaube ich selbsterklärend, SOC ist blau, grün ist Akku laden, rot Akku entladen und die gelbe Linie ist die PV-Gesamtleistung
...und ja, es ist noch ein weiterer 3kwh Akkupack(dann knappe 9 kwh gesamt) unterwegs, habe mich bei unserem regulären nächtlichen Energiebedarf nach einem sonnigen Tag etwas verkalkuliert, der Sonnenschein wird halt täglich zeitlich kürzer aktuell
Fragen? Fragen!
-
Vorsicht kein Nodejs Update auf 22.21.0 siehe
https://forum.iobroker.net/topic/82601/vorsicht-jarvis-user-kein-nodejs-update-auf-22-21-0Hat sich mit Update auf Nodejs 22.21.1 erledigt.
Support us
480
Online32.4k
Users81.4k
Topics1.3m
Posts