NEWS


Material Design Widgets: JSON Chart Widget

-
JSON Chart Widget
Sämtliche Fragen zu Einstellungen (VIS Editor, Bedienung, JSON strings, etc.) des Widgets hier stellen
Das ist sicher besser für die Übersichtlichkeit und Dokumentation.
@Scrounger sehr cool. kannst du mir das Beispiel aud dem bild geben
-
@Scrounger sehr cool. kannst du mir das Beispiel aud dem bild geben
@Meistertr sagte in Material Design Widgets: JSON Chart Widget:
@Scrounger sehr cool. kannst du mir das Beispiel aud dem bild geben
Das geht leider nicht so ohne weiteres, kommt aber bald als Parktische Anwendung.
Gutes Beispiel zum lernen wie man das JSON Chart verwendet findest du hier:
https://forum.iobroker.net/topic/26925/test-adapter-material-design-widgets-v0-2-x/857 -
@Meistertr sagte in Material Design Widgets: JSON Chart Widget:
@Scrounger sehr cool. kannst du mir das Beispiel aud dem bild geben
Das geht leider nicht so ohne weiteres, kommt aber bald als Parktische Anwendung.
Gutes Beispiel zum lernen wie man das JSON Chart verwendet findest du hier:
https://forum.iobroker.net/topic/26925/test-adapter-material-design-widgets-v0-2-x/857@Scrounger und User:
Gibt es ein funktionierendes Beispiel, wie man Daten aus der Datenbank bekommt und ins JSON umwandelt? Nicht, dass ich das nicht auch selber bauen könnte, aber wenn sich jemand schon die Mühe gemacht hat, dann würde ich mir die Zeit gerne sparen.
Wie unterschiedlich ist eigentlich das Line History Chart Widget und das JSON Chart Widget in der Implementierung? Gibt es die Möglichkeit, deren Funktionalität zu mergen? Oder ist das zu verschieden?
-
@Scrounger und User:
Gibt es ein funktionierendes Beispiel, wie man Daten aus der Datenbank bekommt und ins JSON umwandelt? Nicht, dass ich das nicht auch selber bauen könnte, aber wenn sich jemand schon die Mühe gemacht hat, dann würde ich mir die Zeit gerne sparen.
Wie unterschiedlich ist eigentlich das Line History Chart Widget und das JSON Chart Widget in der Implementierung? Gibt es die Möglichkeit, deren Funktionalität zu mergen? Oder ist das zu verschieden?
@cmorlok sagte in Material Design Widgets: JSON Chart Widget:
@Scrounger und User:
Gibt es ein funktionierendes Beispiel, wie man Daten aus der Datenbank bekommt und ins JSON umwandelt?
Ein
out of the boxfunktionierendes Beispiel gibt es noch nicht, da musst dich noch etwas gedulden.Anbei ein Beispielcode wie man die History Daten in den Chart bekommt:
// imports NPM Module
const moment = require("moment");
moment.locale("de");

// Skript Einstellungen *************************************************************************************************************************************************
let debug = true;                                                                                           // Debug Meldungen anzeigen
let strukturChannel = '0_userdata.0.vis.System.Chart';                                                      // Übergeordnete Id, wo die Datenpunkte angelegt werden sollen

let idTimeIntervalDatenpunkt = `${strukturChannel}.Control.timeInterval`                                    // Datenpunkt um Zeitinterval bei Graph zu ändern

let historyInstance = 'sql.0';                                                                              // History Instanz die verwendet werden soll
let historyDefaultAggregate = 'max';                                                                        // History Daten Aggregation, siehe https://github.com/ioBroker/ioBroker.javascript/blob/master/docs/en/javascript.md#gethistory
let historyDefaultCount = 20;                                                                               // Anzahl der History Daten die dargestellt werden
let historyDefaultTimeout = 2000;                                                                           // History Instance Timeout in ms, nur erhöhen wenn graph Fehlemeldung zu timeout anzeigt

let channels = [                                                                                            // Channels des Systems die verwendet werden sollen
    {
        idTarget: 'IoBroker',                                                                               // Name Eures Ziel Datenpunktes, wird aus 'strukturChannel' + 'idDatenpunkt' zusammengesetzt
        idChannel: 'linkeddevices.0.System.LXC.IoBroker'                                                    // id des Channels des Coronavirus-Statistics die verwendet werden sollen
    }
]

let datenpunkte = [
    {
        id: 'CPU.Auslastung',                                                                                                                           // Ids die verwendet werden sollen und deren Einstellungen
        graphSettings: { type: 'bar', color: '#FF8C00', legendText: 'CPU', yAxis_id: 0, displayOrder: 1 }                                               // Einstellung für graph
    },
    {
        id: 'CPU.Durchschnitt',                                                                                                                         // Ids die verwendet werden sollen und deren Einstellungen
        graphSettings: { type: 'line', color: '#44739e', legendText: 'CPU Durchschnitt', yAxis_id: 0, line_UseFillColor: true, displayOrder: 0 }        // Einstellung für graph
    },
]

let globalGraphSettings = {                                                                                 // gemeinsam verwendet Chart Einstellungen, details siehe https://github.com/Scrounger/ioBroker.vis-materialdesign#json-chart
    line_Thickness: 2,
    line_pointSize: 0,
    datalabel_show: false,
    yAxis_min: 0,
    yAxis_max: 100,
    yAxis_zeroLineWidth: 0,
    xAxis_bounds: 'ticks',
    xAxis_timeFormats: {
        millisecond: "H:mm:ss.SSS",
        second: "H:mm:ss",
        minute: "H:mm",
        hour: "dd.[\\n]H:mm",
        day: "dd[\\n]DD.MM",
        week: "dd[\\n]DD.MM",
        month: "MMM[\\n]YYYY",
        quarter: "[Q]Q - YYYY",
        year: "YYYY"
    }
}

// **********************************************************************************************************************************************************************

function refreshData() {
    try {
        createControlDatapoints();

        let start = getChartStart();
        let end = moment();
        if (debug) console.debug(`[refreshData]: chart time interval: start: ${start.format('LLL')}, end: ${end.format('LLL')}`)

        let historyOptions = {
            start: start.valueOf(),
            end: end.valueOf()
        }

        for (const channel of channels) {
            let graphs = [];

            for (const datenpunkt of datenpunkte) {
                let idSource = `${channel.idChannel}.${datenpunkt.id}`;

                if (existsState(idSource)) {
                    // create Json Data for Graph
                    if (debug) console.debug(`[refreshData]: get history data for datapoint '${idSource}'`);

                    historyOptions.aggregate = (datenpunkt.graphSettings.aggregate) ? datenpunkt.graphSettings.aggregate : historyDefaultAggregate;
                    historyOptions.count = (datenpunkt.graphSettings.count) ? datenpunkt.graphSettings.count : historyDefaultCount;
                    historyOptions.timeout = (datenpunkt.graphSettings.timeout) ? datenpunkt.graphSettings.timeout : historyDefaultTimeout;

                    if (debug) console.debug(`[refreshData]: chart options for '${datenpunkt.id}': ${JSON.stringify(historyOptions)}`);

                    let historyData = getHistoryGraphData(idSource, historyInstance, historyOptions, datenpunkt.graphSettings);

                    if (historyData) {
                        graphs.push(historyData);
                    }

                } else {
                    if (debug) console.warn(`[refreshData]: datapoint '${idSource}' not exist! Perhaps you must activate it in the settings of Coronavirus-Statistics Adapter or delete it from the skript`);
                }

                Promise.all(graphs).then((result) => {
                    mySetState(`${strukturChannel}.${channel.idTarget}`, JSON.stringify({ graphs: result }), 'string', `${channel.idTarget} Daten für JsonChart Widget`);
                });
            }
        }

    } catch (err) {
        console.error(`[refreshData] error: ${err.message}, stack: ${err.stack}`);
    }
}

refreshData();

function createControlDatapoints() {
    if (!existsState(idTimeIntervalDatenpunkt)) {
        if (debug) console.debug(`[createControlDatapoints]: create datapoint '${idTimeIntervalDatenpunkt}'`);
        mySetState(idTimeIntervalDatenpunkt, '7 days', 'string', `Filter für Charts`);
    }
}

function getChartStart() {
    let startDateTime = moment();

    if (existsState(idTimeIntervalDatenpunkt)) {
        let val = getState(idTimeIntervalDatenpunkt).val;

        if (val === '1 hour') {
            startDateTime.add('-1', 'hours');
            // startDateTime = startDateTime.startOf('hour');
        } else if (val === '1 day') {
            startDateTime.add('-1', 'days');
        } else if (val === '3 days') {
            startDateTime.add('-3', 'days');
            startDateTime = startDateTime.startOf('day');
        } else if (val === '7 days') {
            startDateTime.add('-7', 'days');
            startDateTime = startDateTime.startOf('day');
        } else if (val === '14 days') {
            startDateTime.add('-14', 'days');
            startDateTime = startDateTime.startOf('day');
        } else if (val === '1 month') {
            startDateTime.add('-1', 'months');
            startDateTime = startDateTime.startOf('day');
        } else if (val === '2 months') {
            startDateTime.add('-2', 'months');
            startDateTime = startDateTime.startOf('day');
        } else if (val === '3 months') {
            startDateTime.add('-3', 'months');
            startDateTime = startDateTime.startOf('day');
        } else if (val === '6 months') {
            startDateTime.add('-6', 'months');
            startDateTime = startDateTime.startOf('day');
        } else if (val === '1 year') {
            startDateTime.add('-1', 'years');
            startDateTime = startDateTime.startOf('day');
        } else {
            startDateTime.add('-7', 'days');
            startDateTime = startDateTime.startOf('day');
        }
    } else {
        startDateTime.add('-7', 'days');
        startDateTime = startDateTime.startOf('day');
    }

    return startDateTime;
}

function getHistoryGraphData(id, historyInstance, options, graphSettings) {
    try {
        // graphSettings must be cloned to new var, prevent pointing to same memory adress because promise is in for loop
        let graph = Object.assign({ ...graphSettings }, globalGraphSettings);

        let obj = getObject(id);
        if (obj && obj.common && obj.common.custom && obj.common.custom[historyInstance]) {
            return new Promise((resolve, reject) => {
                sendTo(historyInstance, 'getHistory', {
                    id: id,
                    options: options
                }, function (query) {
                    graph.data = getPreparedData(query.result)
                    resolve(graph);
                });

            });
        } else {
            if (debug) console.warn(`[getHistoryGraphData]: no history instance '${historyInstance}' exist for datapoint '${id}'!`);
        }

        return undefined

        function getPreparedData(data) {
            if (data) {
                return data.map(elm => ({
                    t: (elm.ts !== null && elm.ts !== undefined) ? elm.ts : null,
                    y: (elm.val !== null && elm.val !== undefined) ? elm.val : null
                }));
            }
            return [];
        };
    } catch (ex) {
        console.error(`[getHistoryGraphData]: error: ${ex.message}, stack: ${ex.stack}`);
    }
};

function mySetState(id, val, type, name) {
    if (existsState(id)) {
        if (debug) console.debug(`[mySetState]: history chart data stored to '${id}'`);
        setState(id, val, true);
    } else {
        if (debug) console.debug(`[mySetState]: create datapoint '${id}'`);
        createUserStates(false, [
            id, {
                'name': name,
                'type': type,
                'read': true,
                'write': true
            }
        ], function () {
            setState(id, val, true);
        });
    }
}

/**
 * Create states under 0_userdata.0 or javascript.x
 * Current Version:     https://github.com/Mic-M/iobroker.createUserStates
 * Support:             https://forum.iobroker.net/topic/26839/
 * Autor:               Mic (ioBroker) | Mic-M (github)
 * Version:             1.1 (26 January 2020)
 * Example:             see https://github.com/Mic-M/iobroker.createUserStates#beispiel
 * -----------------------------------------------
 * PLEASE NOTE: Per https://github.com/ioBroker/ioBroker.javascript/issues/474, the used function setObject()
 *              executes the callback PRIOR to completing the state creation. Therefore, we use a setTimeout and counter.
 * -----------------------------------------------
 * @param {boolean} force         Force state creation (overwrite), if state is existing.
 * @param {array} statesToCreate  State(s) to create. single array or array of arrays
 * @param {object} [callback]     Optional: a callback function -- This provided function will be executed after all states are created.
 */
function createUserStates(force, statesToCreate, callback = undefined) {
    const where = '0_userdata.0'

    const WARN = false; // Only for 0_userdata.0: Throws warning in log, if state is already existing and force=false. Default is false, so no warning in log, if state exists.
    const LOG_DEBUG = false; // To debug this function, set to true
    // Per issue #474 (https://github.com/ioBroker/ioBroker.javascript/issues/474), the used function setObject() executes the callback
    // before the state is actual created. Therefore, we use a setTimeout and counter as a workaround.
    const DELAY = 50; // Delay in milliseconds (ms). Increase this to 100, if it is not working.

    // Validate "where"
    if (where.endsWith('.')) where = where.slice(0, -1); // Remove trailing dot
    if ((where.match(/^((javascript\.([1-9][0-9]|[0-9]))$|0_userdata\.0$)/) == null)) {
        log('This script does not support to create states under [' + where + ']', 'error');
        return;
    }

    // Prepare "statesToCreate" since we also allow a single state to create
    if (!Array.isArray(statesToCreate[0])) statesToCreate = [statesToCreate]; // wrap into array, if just one array and not inside an array

    // Add "where" to STATES_TO_CREATE
    for (let i = 0; i < statesToCreate.length; i++) {
        let lpPath = statesToCreate[i][0].replace(/\.*\./g, '.'); // replace all multiple dots like '..', '...' with a single '.'
        lpPath = lpPath.replace(/^((javascript\.([1-9][0-9]|[0-9])\.)|0_userdata\.0\.)/, '') // remove any javascript.x. / 0_userdata.0. from beginning
        lpPath = where + '.' + lpPath; // add where to beginning of string
        statesToCreate[i][0] = lpPath;
    }

    if (where != '0_userdata.0') {
        // Create States under javascript.x
        let numStates = statesToCreate.length;
        statesToCreate.forEach(function (loopParam) {
            if (LOG_DEBUG) log('[Debug] Now we are creating new state [' + loopParam[0] + ']');
            let loopInit = (loopParam[1]['def'] == undefined) ? null : loopParam[1]['def']; // mimic same behavior as createState if no init value is provided
            createState(loopParam[0], loopInit, force, loopParam[1], function () {
                numStates--;
                if (numStates === 0) {
                    if (LOG_DEBUG) log('[Debug] All states processed.');
                    if (typeof callback === 'function') { // execute if a function was provided to parameter callback
                        if (LOG_DEBUG) log('[Debug] Function to callback parameter was provided');
                        return callback();
                    } else {
                        return;
                    }
                }
            });
        });
    } else {
        // Create States under 0_userdata.0
        let numStates = statesToCreate.length;
        let counter = -1;
        statesToCreate.forEach(function (loopParam) {
            counter += 1;
            if (LOG_DEBUG) log('[Debug] Currently processing following state: [' + loopParam[0] + ']');
            if (($(loopParam[0]).length > 0) && (existsState(loopParam[0]))) { // Workaround due to https://github.com/ioBroker/ioBroker.javascript/issues/478
                // State is existing.
                if (WARN && !force) log('State [' + loopParam[0] + '] is already existing and will no longer be created.', 'warn');
                if (!WARN && LOG_DEBUG) log('[Debug] State [' + loopParam[0] + '] is already existing. Option force (=overwrite) is set to [' + force + '].');
                if (!force) {
                    // State exists and shall not be overwritten since force=false
                    // So, we do not proceed.
                    numStates--;
                    if (numStates === 0) {
                        if (LOG_DEBUG) log('[Debug] All states successfully processed!');
                        if (typeof callback === 'function') { // execute if a function was provided to parameter callback
                            if (LOG_DEBUG) log('[Debug] An optional callback function was provided, which we are going to execute now.');
                            return callback();
                        }
                    } else {
                        // We need to go out and continue with next element in loop.
                        return; // https://stackoverflow.com/questions/18452920/continue-in-cursor-foreach
                    }
                } // if(!force)
            }

            // State is not existing or force = true, so we are continuing to create the state through setObject().
            let obj = {};
            obj.type = 'state';
            obj.native = {};
            obj.common = loopParam[1];
            setObject(loopParam[0], obj, function (err) {
                if (err) {
                    log('Cannot write object for state [' + loopParam[0] + ']: ' + err);
                } else {
                    if (LOG_DEBUG) log('[Debug] Now we are creating new state [' + loopParam[0] + ']')
                    let init = null;
                    if (loopParam[1].def === undefined) {
                        if (loopParam[1].type === 'number') init = 0;
                        if (loopParam[1].type === 'boolean') init = false;
                        if (loopParam[1].type === 'string') init = '';
                    } else {
                        init = loopParam[1].def;
                    }
                    setTimeout(function () {
                        setState(loopParam[0], init, true, function () {
                            if (LOG_DEBUG) log('[Debug] setState durchgeführt: ' + loopParam[0]);
                            numStates--;
                            if (numStates === 0) {
                                if (LOG_DEBUG) log('[Debug] All states processed.');
                                if (typeof callback === 'function') { // execute if a function was provided to parameter callback
                                    if (LOG_DEBUG) log('[Debug] Function to callback parameter was provided');
                                    return callback();
                                }
                            }
                        });
                    }, DELAY + (20 * counter));
                }
            });
        });
    }
}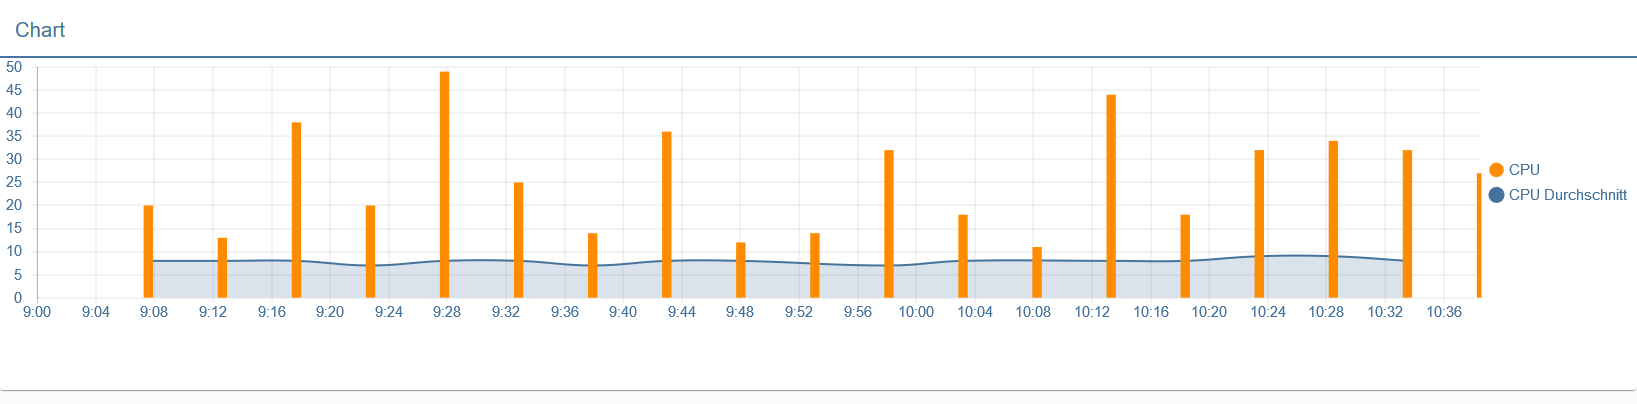
-
@cmorlok sagte in Material Design Widgets: JSON Chart Widget:
@Scrounger und User:
Gibt es ein funktionierendes Beispiel, wie man Daten aus der Datenbank bekommt und ins JSON umwandelt?
Ein
out of the boxfunktionierendes Beispiel gibt es noch nicht, da musst dich noch etwas gedulden.Anbei ein Beispielcode wie man die History Daten in den Chart bekommt:
// imports NPM Module const moment = require("moment"); moment.locale("de"); // Skript Einstellungen ************************************************************************************************************************************************* let debug = true; // Debug Meldungen anzeigen let strukturChannel = '0_userdata.0.vis.System.Chart'; // Übergeordnete Id, wo die Datenpunkte angelegt werden sollen let idTimeIntervalDatenpunkt = `${strukturChannel}.Control.timeInterval` // Datenpunkt um Zeitinterval bei Graph zu ändern let historyInstance = 'sql.0'; // History Instanz die verwendet werden soll let historyDefaultAggregate = 'max'; // History Daten Aggregation, siehe https://github.com/ioBroker/ioBroker.javascript/blob/master/docs/en/javascript.md#gethistory let historyDefaultCount = 20; // Anzahl der History Daten die dargestellt werden let historyDefaultTimeout = 2000; // History Instance Timeout in ms, nur erhöhen wenn graph Fehlemeldung zu timeout anzeigt let channels = [ // Channels des Systems die verwendet werden sollen { idTarget: 'IoBroker', // Name Eures Ziel Datenpunktes, wird aus 'strukturChannel' + 'idDatenpunkt' zusammengesetzt idChannel: 'linkeddevices.0.System.LXC.IoBroker' // id des Channels des Coronavirus-Statistics die verwendet werden sollen } ] let datenpunkte = [ { id: 'CPU.Auslastung', // Ids die verwendet werden sollen und deren Einstellungen graphSettings: { type: 'bar', color: '#FF8C00', legendText: 'CPU', yAxis_id: 0, displayOrder: 1 } // Einstellung für graph }, { id: 'CPU.Durchschnitt', // Ids die verwendet werden sollen und deren Einstellungen graphSettings: { type: 'line', color: '#44739e', legendText: 'CPU Durchschnitt', yAxis_id: 0, line_UseFillColor: true, displayOrder: 0 } // Einstellung für graph }, ] let globalGraphSettings = { // gemeinsam verwendet Chart Einstellungen, details siehe https://github.com/Scrounger/ioBroker.vis-materialdesign#json-chart line_Thickness: 2, line_pointSize: 0, datalabel_show: false, yAxis_min: 0, yAxis_max: 100, yAxis_zeroLineWidth: 0, xAxis_bounds: 'ticks', xAxis_timeFormats: { millisecond: "H:mm:ss.SSS", second: "H:mm:ss", minute: "H:mm", hour: "dd.[\\n]H:mm", day: "dd[\\n]DD.MM", week: "dd[\\n]DD.MM", month: "MMM[\\n]YYYY", quarter: "[Q]Q - YYYY", year: "YYYY" } } // ********************************************************************************************************************************************************************** function refreshData() { try { createControlDatapoints(); let start = getChartStart(); let end = moment(); if (debug) console.debug(`[refreshData]: chart time interval: start: ${start.format('LLL')}, end: ${end.format('LLL')}`) let historyOptions = { start: start.valueOf(), end: end.valueOf() } for (const channel of channels) { let graphs = []; for (const datenpunkt of datenpunkte) { let idSource = `${channel.idChannel}.${datenpunkt.id}`; if (existsState(idSource)) { // create Json Data for Graph if (debug) console.debug(`[refreshData]: get history data for datapoint '${idSource}'`); historyOptions.aggregate = (datenpunkt.graphSettings.aggregate) ? datenpunkt.graphSettings.aggregate : historyDefaultAggregate; historyOptions.count = (datenpunkt.graphSettings.count) ? datenpunkt.graphSettings.count : historyDefaultCount; historyOptions.timeout = (datenpunkt.graphSettings.timeout) ? datenpunkt.graphSettings.timeout : historyDefaultTimeout; if (debug) console.debug(`[refreshData]: chart options for '${datenpunkt.id}': ${JSON.stringify(historyOptions)}`); let historyData = getHistoryGraphData(idSource, historyInstance, historyOptions, datenpunkt.graphSettings); if (historyData) { graphs.push(historyData); } } else { if (debug) console.warn(`[refreshData]: datapoint '${idSource}' not exist! Perhaps you must activate it in the settings of Coronavirus-Statistics Adapter or delete it from the skript`); } Promise.all(graphs).then((result) => { mySetState(`${strukturChannel}.${channel.idTarget}`, JSON.stringify({ graphs: result }), 'string', `${channel.idTarget} Daten für JsonChart Widget`); }); } } } catch (err) { console.error(`[refreshData] error: ${err.message}, stack: ${err.stack}`); } } refreshData(); function createControlDatapoints() { if (!existsState(idTimeIntervalDatenpunkt)) { if (debug) console.debug(`[createControlDatapoints]: create datapoint '${idTimeIntervalDatenpunkt}'`); mySetState(idTimeIntervalDatenpunkt, '7 days', 'string', `Filter für Charts`); } } function getChartStart() { let startDateTime = moment(); if (existsState(idTimeIntervalDatenpunkt)) { let val = getState(idTimeIntervalDatenpunkt).val; if (val === '1 hour') { startDateTime.add('-1', 'hours'); // startDateTime = startDateTime.startOf('hour'); } else if (val === '1 day') { startDateTime.add('-1', 'days'); } else if (val === '3 days') { startDateTime.add('-3', 'days'); startDateTime = startDateTime.startOf('day'); } else if (val === '7 days') { startDateTime.add('-7', 'days'); startDateTime = startDateTime.startOf('day'); } else if (val === '14 days') { startDateTime.add('-14', 'days'); startDateTime = startDateTime.startOf('day'); } else if (val === '1 month') { startDateTime.add('-1', 'months'); startDateTime = startDateTime.startOf('day'); } else if (val === '2 months') { startDateTime.add('-2', 'months'); startDateTime = startDateTime.startOf('day'); } else if (val === '3 months') { startDateTime.add('-3', 'months'); startDateTime = startDateTime.startOf('day'); } else if (val === '6 months') { startDateTime.add('-6', 'months'); startDateTime = startDateTime.startOf('day'); } else if (val === '1 year') { startDateTime.add('-1', 'years'); startDateTime = startDateTime.startOf('day'); } else { startDateTime.add('-7', 'days'); startDateTime = startDateTime.startOf('day'); } } else { startDateTime.add('-7', 'days'); startDateTime = startDateTime.startOf('day'); } return startDateTime; } function getHistoryGraphData(id, historyInstance, options, graphSettings) { try { // graphSettings must be cloned to new var, prevent pointing to same memory adress because promise is in for loop let graph = Object.assign({ ...graphSettings }, globalGraphSettings); let obj = getObject(id); if (obj && obj.common && obj.common.custom && obj.common.custom[historyInstance]) { return new Promise((resolve, reject) => { sendTo(historyInstance, 'getHistory', { id: id, options: options }, function (query) { graph.data = getPreparedData(query.result) resolve(graph); }); }); } else { if (debug) console.warn(`[getHistoryGraphData]: no history instance '${historyInstance}' exist for datapoint '${id}'!`); } return undefined function getPreparedData(data) { if (data) { return data.map(elm => ({ t: (elm.ts !== null && elm.ts !== undefined) ? elm.ts : null, y: (elm.val !== null && elm.val !== undefined) ? elm.val : null })); } return []; }; } catch (ex) { console.error(`[getHistoryGraphData]: error: ${ex.message}, stack: ${ex.stack}`); } }; function mySetState(id, val, type, name) { if (existsState(id)) { if (debug) console.debug(`[mySetState]: history chart data stored to '${id}'`); setState(id, val, true); } else { if (debug) console.debug(`[mySetState]: create datapoint '${id}'`); createUserStates(false, [ id, { 'name': name, 'type': type, 'read': true, 'write': true } ], function () { setState(id, val, true); }); } } /** * Create states under 0_userdata.0 or javascript.x * Current Version: https://github.com/Mic-M/iobroker.createUserStates * Support: https://forum.iobroker.net/topic/26839/ * Autor: Mic (ioBroker) | Mic-M (github) * Version: 1.1 (26 January 2020) * Example: see https://github.com/Mic-M/iobroker.createUserStates#beispiel * ----------------------------------------------- * PLEASE NOTE: Per https://github.com/ioBroker/ioBroker.javascript/issues/474, the used function setObject() * executes the callback PRIOR to completing the state creation. Therefore, we use a setTimeout and counter. * ----------------------------------------------- * @param {boolean} force Force state creation (overwrite), if state is existing. * @param {array} statesToCreate State(s) to create. single array or array of arrays * @param {object} [callback] Optional: a callback function -- This provided function will be executed after all states are created. */ function createUserStates(force, statesToCreate, callback = undefined) { const where = '0_userdata.0' const WARN = false; // Only for 0_userdata.0: Throws warning in log, if state is already existing and force=false. Default is false, so no warning in log, if state exists. const LOG_DEBUG = false; // To debug this function, set to true // Per issue #474 (https://github.com/ioBroker/ioBroker.javascript/issues/474), the used function setObject() executes the callback // before the state is actual created. Therefore, we use a setTimeout and counter as a workaround. const DELAY = 50; // Delay in milliseconds (ms). Increase this to 100, if it is not working. // Validate "where" if (where.endsWith('.')) where = where.slice(0, -1); // Remove trailing dot if ((where.match(/^((javascript\.([1-9][0-9]|[0-9]))$|0_userdata\.0$)/) == null)) { log('This script does not support to create states under [' + where + ']', 'error'); return; } // Prepare "statesToCreate" since we also allow a single state to create if (!Array.isArray(statesToCreate[0])) statesToCreate = [statesToCreate]; // wrap into array, if just one array and not inside an array // Add "where" to STATES_TO_CREATE for (let i = 0; i < statesToCreate.length; i++) { let lpPath = statesToCreate[i][0].replace(/\.*\./g, '.'); // replace all multiple dots like '..', '...' with a single '.' lpPath = lpPath.replace(/^((javascript\.([1-9][0-9]|[0-9])\.)|0_userdata\.0\.)/, '') // remove any javascript.x. / 0_userdata.0. from beginning lpPath = where + '.' + lpPath; // add where to beginning of string statesToCreate[i][0] = lpPath; } if (where != '0_userdata.0') { // Create States under javascript.x let numStates = statesToCreate.length; statesToCreate.forEach(function (loopParam) { if (LOG_DEBUG) log('[Debug] Now we are creating new state [' + loopParam[0] + ']'); let loopInit = (loopParam[1]['def'] == undefined) ? null : loopParam[1]['def']; // mimic same behavior as createState if no init value is provided createState(loopParam[0], loopInit, force, loopParam[1], function () { numStates--; if (numStates === 0) { if (LOG_DEBUG) log('[Debug] All states processed.'); if (typeof callback === 'function') { // execute if a function was provided to parameter callback if (LOG_DEBUG) log('[Debug] Function to callback parameter was provided'); return callback(); } else { return; } } }); }); } else { // Create States under 0_userdata.0 let numStates = statesToCreate.length; let counter = -1; statesToCreate.forEach(function (loopParam) { counter += 1; if (LOG_DEBUG) log('[Debug] Currently processing following state: [' + loopParam[0] + ']'); if (($(loopParam[0]).length > 0) && (existsState(loopParam[0]))) { // Workaround due to https://github.com/ioBroker/ioBroker.javascript/issues/478 // State is existing. if (WARN && !force) log('State [' + loopParam[0] + '] is already existing and will no longer be created.', 'warn'); if (!WARN && LOG_DEBUG) log('[Debug] State [' + loopParam[0] + '] is already existing. Option force (=overwrite) is set to [' + force + '].'); if (!force) { // State exists and shall not be overwritten since force=false // So, we do not proceed. numStates--; if (numStates === 0) { if (LOG_DEBUG) log('[Debug] All states successfully processed!'); if (typeof callback === 'function') { // execute if a function was provided to parameter callback if (LOG_DEBUG) log('[Debug] An optional callback function was provided, which we are going to execute now.'); return callback(); } } else { // We need to go out and continue with next element in loop. return; // https://stackoverflow.com/questions/18452920/continue-in-cursor-foreach } } // if(!force) } // State is not existing or force = true, so we are continuing to create the state through setObject(). let obj = {}; obj.type = 'state'; obj.native = {}; obj.common = loopParam[1]; setObject(loopParam[0], obj, function (err) { if (err) { log('Cannot write object for state [' + loopParam[0] + ']: ' + err); } else { if (LOG_DEBUG) log('[Debug] Now we are creating new state [' + loopParam[0] + ']') let init = null; if (loopParam[1].def === undefined) { if (loopParam[1].type === 'number') init = 0; if (loopParam[1].type === 'boolean') init = false; if (loopParam[1].type === 'string') init = ''; } else { init = loopParam[1].def; } setTimeout(function () { setState(loopParam[0], init, true, function () { if (LOG_DEBUG) log('[Debug] setState durchgeführt: ' + loopParam[0]); numStates--; if (numStates === 0) { if (LOG_DEBUG) log('[Debug] All states processed.'); if (typeof callback === 'function') { // execute if a function was provided to parameter callback if (LOG_DEBUG) log('[Debug] Function to callback parameter was provided'); return callback(); } } }); }, DELAY + (20 * counter)); } }); }); } }@Scrounger Danke, das ist sehr hilfreich.
-
@Scrounger und User:
Gibt es ein funktionierendes Beispiel, wie man Daten aus der Datenbank bekommt und ins JSON umwandelt? Nicht, dass ich das nicht auch selber bauen könnte, aber wenn sich jemand schon die Mühe gemacht hat, dann würde ich mir die Zeit gerne sparen.
Wie unterschiedlich ist eigentlich das Line History Chart Widget und das JSON Chart Widget in der Implementierung? Gibt es die Möglichkeit, deren Funktionalität zu mergen? Oder ist das zu verschieden?
@cmorlok sagte in Material Design Widgets: JSON Chart Widget:
Wie unterschiedlich ist eigentlich das Line History Chart Widget und das JSON Chart Widget in der Implementierung? Gibt es die Möglichkeit, deren Funktionalität zu mergen? Oder ist das zu verschieden?
Eine Frage vergessen. Die sind vollkommen unterschiedlich, d.h. mergen geht nicht.
Ich persönlich verwende das Line History Chart jetzt gar nicht mehr, da das JSON Chart meiner Meinung nach zwei wesentliche Vorteile bietet:
- Die Last zum Daten holen und aufbereiten liegt beim Server, somit wird der VIS Client entlastet
- Die Variablität des JSON Charts ist quasi grenzenlos ;-)
-
@cmorlok sagte in Material Design Widgets: JSON Chart Widget:
Wie unterschiedlich ist eigentlich das Line History Chart Widget und das JSON Chart Widget in der Implementierung? Gibt es die Möglichkeit, deren Funktionalität zu mergen? Oder ist das zu verschieden?
Eine Frage vergessen. Die sind vollkommen unterschiedlich, d.h. mergen geht nicht.
Ich persönlich verwende das Line History Chart jetzt gar nicht mehr, da das JSON Chart meiner Meinung nach zwei wesentliche Vorteile bietet:
- Die Last zum Daten holen und aufbereiten liegt beim Server, somit wird der VIS Client entlastet
- Die Variablität des JSON Charts ist quasi grenzenlos ;-)
@Scrounger said in Material Design Widgets: JSON Chart Widget:
- Die Last zum Daten holen und aufbereiten liegt beim Server, somit wird der VIS Client entlastet
Stimmt, so weit hatte ich gar nicht gedacht. Das wäre dann evtl die Aufgabe für einen Adapter im Server? Vielleicht versuch ich mich mal an einem, der so die Standard-Graphen abdeckt und das JSON dazu baut. Oder alternativ ein npm-Modul fürs Javascript.
-
@Scrounger said in Material Design Widgets: JSON Chart Widget:
- Die Last zum Daten holen und aufbereiten liegt beim Server, somit wird der VIS Client entlastet
Stimmt, so weit hatte ich gar nicht gedacht. Das wäre dann evtl die Aufgabe für einen Adapter im Server? Vielleicht versuch ich mich mal an einem, der so die Standard-Graphen abdeckt und das JSON dazu baut. Oder alternativ ein npm-Modul fürs Javascript.
Ich hab das Skript oben nochmal aktualisiert, weil da noch Fehler drin war und jetzt noch variabler ausgeführt ist.
@cmorlok sagte in Material Design Widgets: JSON Chart Widget:
Stimmt, so weit hatte ich gar nicht gedacht. Das wäre dann evtl die Aufgabe für einen Adapter im Server? Vielleicht versuch ich mich mal an einem, der so die Standard-Graphen abdeckt und das JSON dazu baut. Oder alternativ ein npm-Modul fürs Javascript.
Ok, ich versteh aber nicht den Hintergrund. Warum einen Adapter dafür entwickeln. Das würde die variablität wieder einschränken bzw. der Adapter müsste diese gewährleisten.
Und da denke ich das eine Skriptvorlage diese Aufgabe besser übernehmen kann. Weil jeder hat andere Punkte auf die er Wert legt und könnte die Vorlage dann entsprechend anpassen.Das skript oben ist ja schon sehr unviersell und einfach zu konfigurieren. Müsst man nur noch die Channel abhängigkeit entfernen, nur Datenpunkte verwenden und schon hätte man meiner Meinung nach die Skriptvorlage.
Außerdem denke ich das das JSON Chart eher was für fortgeschrittene User ist, die sich ein bischen mit Javascript auskennen.Das soll aber nicht heißen, dass du nicht einen Adapter dafür entwicklen sollst ;-)
Hab einfach mal meine Gedanken dazu geschrieben. -
Ich hab das Skript oben nochmal aktualisiert, weil da noch Fehler drin war und jetzt noch variabler ausgeführt ist.
@cmorlok sagte in Material Design Widgets: JSON Chart Widget:
Stimmt, so weit hatte ich gar nicht gedacht. Das wäre dann evtl die Aufgabe für einen Adapter im Server? Vielleicht versuch ich mich mal an einem, der so die Standard-Graphen abdeckt und das JSON dazu baut. Oder alternativ ein npm-Modul fürs Javascript.
Ok, ich versteh aber nicht den Hintergrund. Warum einen Adapter dafür entwickeln. Das würde die variablität wieder einschränken bzw. der Adapter müsste diese gewährleisten.
Und da denke ich das eine Skriptvorlage diese Aufgabe besser übernehmen kann. Weil jeder hat andere Punkte auf die er Wert legt und könnte die Vorlage dann entsprechend anpassen.Das skript oben ist ja schon sehr unviersell und einfach zu konfigurieren. Müsst man nur noch die Channel abhängigkeit entfernen, nur Datenpunkte verwenden und schon hätte man meiner Meinung nach die Skriptvorlage.
Außerdem denke ich das das JSON Chart eher was für fortgeschrittene User ist, die sich ein bischen mit Javascript auskennen.Das soll aber nicht heißen, dass du nicht einen Adapter dafür entwicklen sollst ;-)
Hab einfach mal meine Gedanken dazu geschrieben.@Scrounger said in Material Design Widgets: JSON Chart Widget:
Und da denke ich das eine Skriptvorlage diese Aufgabe besser übernehmen kann. Weil jeder hat andere Punkte auf die er Wert legt und könnte die Vorlage dann entsprechend anpassen.
Das skript oben ist ja schon sehr unviersell und einfach zu konfigurieren. Müsst man nur noch die Channel abhängigkeit entfernen, nur Datenpunkte verwenden und schon hätte man meiner Meinung nach die Skriptvorlage.
Außerdem denke ich das das JSON Chart eher was für fortgeschrittene User ist, die sich ein bischen mit Javascript auskennen.Das soll aber nicht heißen, dass du nicht einen Adapter dafür entwicklen sollst ;-)
Hab einfach mal meine Gedanken dazu geschrieben.Das stimmt schon. Ich bin auch eher der Skript-Typ. Nur manchmal ist es auch ganz nett, was zusammen klicken zu können :)
Tatsächlich fände ich aber eine Bibliothek sinnvoller, die einem gewisse Standardaufgaben abnimmt, statt diese immer wieder in die Skripte copy-pasten zu müssen. So Sachen wie Daten auslesen aus der History und ins richtige Format bringen, Formatierungen standardisieren über mehrere Charts hinweg,... Keine Ahnung, ob sich da ein Modul lohnt, ich werde mir da erst mal ein globales Skript für zusammenstellen.
-
V0.3.0
Adapter: TankerkönigIch hab nur einen Ladekreis wenn ich einen JSON DP hinterlege
-
Hallo.
Ich bin noch in der Anfangsphase was das alles hier betrifft.
Ich bin auch recht unwissend was JAVA betrifft und klicke mich mehr durch Blockly daher scheinen deine Widgets sehr Interessant zu sein.Das was ich jetzt nirgendwo gefunden habe ist wie ich Daten in das JSON Chart Widget rein bekomme.
Gehe einfach einmal davon aus das ich total unwissend bin.
Ich habe mir selber über Blockly einen JSON Datensatz erzeugt.
Welches Format muss das JSON haben um Angezeigt zu werden.
Mein Datensatz enthält
[{"Zeitstempel":"1586556000000","Wert":"15","Uhrzeit":"00:00"},{"Zeitstempel":"1586556060000","Wert":"15","Uhrzeit":"00:01"},{"Zeitstempel":"1586556120000","Wert":"15","Uhrzeit":"00:02"},{"Zeitstempel":"1586556180000","Wert":"15","Uhrzeit":"00:03"},{"Zeitstempel":"1586556240000","Wert":"15","Uhrzeit":"00:04"},"
.
.
.
{"Zeitstempel":"1586642040000","Wert":"1434","Uhrzeit":"23:54"},{"Zeitstempel":"1586642100000","Wert":"1435","Uhrzeit":"23:55"},{"Zeitstempel":"1586642160000","Wert":"1436","Uhrzeit":"23:56"},{"Zeitstempel":"1586642220000","Wert":"1437","Uhrzeit":"23:57"},{"Zeitstempel":"1586642280000","Wert":"1438","Uhrzeit":"23:58"},{"Zeitstempel":"1586642340000","Wert":"1439","Uhrzeit":"23:59"},{"Zeitstempel":"1586642400000","Wert":"1440","Uhrzeit":"00:00"}]Wie bekomme ich diese Werte angezeigt und wie kann ich auswählen was angezeigt wird.
In diesem Fall möchte ich die Werte in Abhängigkeit von der Uhrzeit angezeigt bekommen.
Ist dieses möglich oder denke ich einfach nur Falsch.
Irgendwo muss ich doch angeben was Angezeigt werden soll.
Danke schon einmal für eine mögliche Erklärung.
Andreas
-
@Scrounger sehr cool. kannst du mir das Beispiel aud dem bild geben
@Meistertr sagte in Material Design Widgets: JSON Chart Widget:
@Scrounger sehr cool. kannst du mir das Beispiel aud dem bild geben
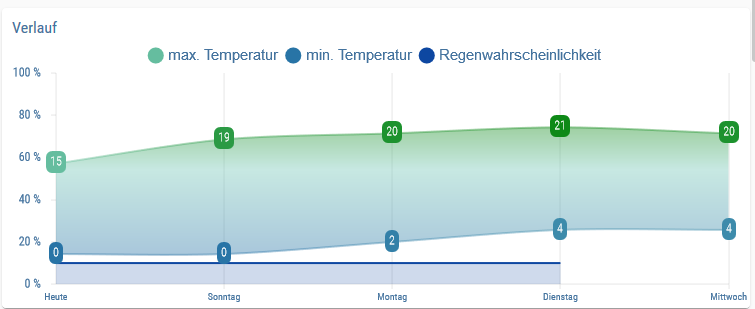
Beispiel in dem es enthalten ist findest du hier:
https://forum.iobroker.net/topic/32232/material-design-widgets-wetter-view -
@Meistertr sagte in Material Design Widgets: JSON Chart Widget:
@Scrounger sehr cool. kannst du mir das Beispiel aud dem bild geben
Beispiel in dem es enthalten ist findest du hier:
https://forum.iobroker.net/topic/32232/material-design-widgets-wetter-viewich habe leider das gleiche Problem wie @Stephan-Schleich
Ich wollte mir den UV Index vom OpenUV Adapter auslesen und habe versucht das Script von dir anzupassen.
Anpassungen erfolgten in folgenden Zeilen:
7
22
28
19
24-31
39Die Daten sollen aus folgenden Datenpunkt vom History Adapter geholt werden:
"openuv.0.UV"Folgendes Json wird geschrieben:
{"graphs":[{"type":"linie","color":"#FF8C00","legendText":"UV-Index","yAxis_id":0,"line_UseFillColor":true,"displayOrder":0,"line_Thickness":2,"line_pointSize":0,"datalabel_show":false,"yAxis_min":0,"yAxis_max":15,"yAxis_zeroLineWidth":0,"xAxis_bounds":"ticks","xAxis_timeFormats":{"millisecond":"H:mm:ss.SSS","second":"H:mm:ss","minute":"H:mm","hour":"dd.[\\n]H:mm","day":"dd[\\n]DD.MM","week":"dd[\\n]DD.MM","month":"MMM[\\n]YYYY","quarter":"[Q]Q - YYYY","year":"YYYY"},"data":[{"t":1586556000000,"y":null},{"t":1586572168731,"y":0.7257},{"t":1586604506194,"y":0},{"t":1586636843656,"y":0},{"t":1586669181118,"y":4.5307},{"t":1586701518581,"y":5.5938},{"t":1586733856043,"y":0},{"t":1586766193505,"y":5.5113},{"t":1586798530968,"y":4.6673},{"t":1586830868430,"y":0.6749},{"t":1586863205892,"y":5.7168},{"t":1586895543355,"y":0.8337},{"t":1586927880817,"y":4.325},{"t":1586960218279,"y":5.555},{"t":1586992555742,"y":0},{"t":1587024893204,"y":5.8891},{"t":1587057230666,"y":4.8084},{"t":1587089568129,"y":0.6144},{"t":1587121905591,"y":5.341},{"t":1587154243053,"y":0.8423},{"t":1587186580516,"y":4.1001}]}]}Die bisherige Darstellung erfolgte über Flot Diagramme
Wo mache ich hier bitte den Fehler?
Datenpunkte lassen auch nur unter userdata anlegen.
-
Hallo.
Ich bin noch in der Anfangsphase was das alles hier betrifft.
Ich bin auch recht unwissend was JAVA betrifft und klicke mich mehr durch Blockly daher scheinen deine Widgets sehr Interessant zu sein.Das was ich jetzt nirgendwo gefunden habe ist wie ich Daten in das JSON Chart Widget rein bekomme.
Gehe einfach einmal davon aus das ich total unwissend bin.
Ich habe mir selber über Blockly einen JSON Datensatz erzeugt.
Welches Format muss das JSON haben um Angezeigt zu werden.
Mein Datensatz enthält
[{"Zeitstempel":"1586556000000","Wert":"15","Uhrzeit":"00:00"},{"Zeitstempel":"1586556060000","Wert":"15","Uhrzeit":"00:01"},{"Zeitstempel":"1586556120000","Wert":"15","Uhrzeit":"00:02"},{"Zeitstempel":"1586556180000","Wert":"15","Uhrzeit":"00:03"},{"Zeitstempel":"1586556240000","Wert":"15","Uhrzeit":"00:04"},"
.
.
.
{"Zeitstempel":"1586642040000","Wert":"1434","Uhrzeit":"23:54"},{"Zeitstempel":"1586642100000","Wert":"1435","Uhrzeit":"23:55"},{"Zeitstempel":"1586642160000","Wert":"1436","Uhrzeit":"23:56"},{"Zeitstempel":"1586642220000","Wert":"1437","Uhrzeit":"23:57"},{"Zeitstempel":"1586642280000","Wert":"1438","Uhrzeit":"23:58"},{"Zeitstempel":"1586642340000","Wert":"1439","Uhrzeit":"23:59"},{"Zeitstempel":"1586642400000","Wert":"1440","Uhrzeit":"00:00"}]Wie bekomme ich diese Werte angezeigt und wie kann ich auswählen was angezeigt wird.
In diesem Fall möchte ich die Werte in Abhängigkeit von der Uhrzeit angezeigt bekommen.
Ist dieses möglich oder denke ich einfach nur Falsch.
Irgendwo muss ich doch angeben was Angezeigt werden soll.
Danke schon einmal für eine mögliche Erklärung.
Andreas
@Atredis sagte in Material Design Widgets: JSON Chart Widget:
Welches Format muss das JSON haben um Angezeigt zu werden.
steht in der Doku:
https://github.com/Scrounger/ioBroker.vis-materialdesign#json-chartSchau dir die Beispiele an:
https://forum.iobroker.net/topic/26925/test-adapter-material-design-widgets-v0-2-x/857@Stephan-Schleich sagte in Material Design Widgets: JSON Chart Widget:
Ich hab nur einen Ladekreis wenn ich einen JSON DP hinterlege
@Oli sagte in Material Design Widgets: JSON Chart Widget:
ich habe leider das gleiche Problem wie @Stephan-Schleich
Benötige den json string und die skripte, damit ich weiterhelfen kann.
-
danke schon mal im Voraus, das Script ist bereits im Spoiler vorhanden.
Was meinst du mit json string?
-
danke
@Oli
axislabel fehltEdit:
Oh sollte echt mal richtig lesen. ;-) Du verwendest timestamps für die x-achse.Hast nen tipp fehler:
"type": "linie",muss
"type": "line",Das steht auch in der console log, wenn man den debug modus aktiviert hat.
-
@Oli
axislabel fehltEdit:
Oh sollte echt mal richtig lesen. ;-) Du verwendest timestamps für die x-achse.Hast nen tipp fehler:
"type": "linie",muss
"type": "line",Das steht auch in der console log, wenn man den debug modus aktiviert hat.
super, danke funktioniert
-
@Oli
axislabel fehltEdit:
Oh sollte echt mal richtig lesen. ;-) Du verwendest timestamps für die x-achse.Hast nen tipp fehler:
"type": "linie",muss
"type": "line",Das steht auch in der console log, wenn man den debug modus aktiviert hat.
hast du auch mal nach dem 2 Thema aus meinem Poste geschaut?
Wenn ich im Script Zeile 7
let strukturChannel = '0_userdata.0.Wetter.Diagramme.UvIndex';"0_userdata.0.Wetter.Diagramme.UvIndex" gegen "javascript.0.Wetter.Diagramme.UvIndex" tausche bringt er mir folgende Warnungen und die Datenpunkte werden nicht angelegt
javascript.0	2020-04-18 13:25:55.275	warn	(5564) at process._tickCallback (internal/process/next_tick.js:68:7)
javascript.0	2020-04-18 13:25:55.275	warn	(5564) at Promise.all.then (script.js.Diagramme.Diagramm_Test:97:21)
javascript.0	2020-04-18 13:25:55.275	warn	(5564) at mySetState (script.js.Diagramme.Diagramm_Test:206:9)
javascript.0	2020-04-18 13:25:55.275	warn	(5564) at createUserStates (script.js.Diagramme.Diagramm_Test:284:24)
javascript.0	2020-04-18 13:25:55.274	warn	(5564) at Array.forEach (<anonymous>:null:null)
javascript.0	2020-04-18 13:25:55.274	warn	(5564) at script.js.Diagramme.Diagramm_Test:299:36
javascript.0	2020-04-18 13:25:55.274	warn	(5564) at script.js.Diagramme.Diagramm_Test:214:13
javascript.0	2020-04-18 13:25:55.274	warn	(5564) at setState (/opt/iobroker/node_modules/iobroker.javascript/lib/sandbox.js:1404:20)
javascript.0	2020-04-18 13:25:55.273	warn	(5564) State "javascript.0.Wetter.Diagramme.UvIndex.UvIndex" not found
Gruß
Oliver
Support us
730
Online32.4k
Benutzer81.4k
Themen1.3m
Beiträge