NEWS


Forecast.solar mit dem Systeminfo Adapter
-
@jb_sullivan Hab noch etwas rumgespielt , Es geht auch 'stacked'

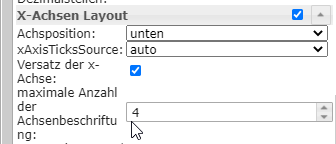
Du kannst auch noch die Sekunden in der X-Achse wegfallen lassen : Zeile 117 die 12 in 5 ändern
let time = watts1[n].Uhrzeit.substr(11, 5); -
gestapelt ist auch cool - Da bekommt man in einem Balken quasi die Werte für OST / West angezeigt?
@jb_sullivan ja.
const SolarJSON1        = "javascript.0.SolarForecast.JSON1";
const SolarJSON2        = "javascript.0.SolarForecast.JSON2";
const SolarJSONAll1        = "javascript.0.SolarForecast.JSONAll1";
const SolarJSONAll2        = "javascript.0.SolarForecast.JSONAll2";
const SolarJSONGraphAll1        = "javascript.0.SolarForecast.JSONGraphAll1";
const SolarJSONGraphAll2        = "javascript.0.SolarForecast.JSONGraphAll2";
const SolarJSONTable    = "javascript.0.SolarForecast.JSONTable";
const SolarJSONGraph    = "javascript.0.SolarForecast.JSONGraph";

const creatStateList = [
    {name :SolarJSON1, type:"string", role : "value"},
    {name :SolarJSON2, type:"string", role : "value"},
    {name :SolarJSONAll1, type:"string", role : "value"},
    {name :SolarJSONAll2, type:"string", role : "value"},
    {name :SolarJSONGraphAll1, type:"string", role : "value"},
    {name :SolarJSONGraphAll2, type:"string", role : "value"},
    {name :SolarJSONTable, type:"string", role : "value"},
    {name :SolarJSONGraph, type:"string", role : "value"}
]


creatStateList.forEach (function(item) {
    createState(item.name, {
        type: item.type,
        min: 0,
        def: 0,
        role: item.role
    });
});

var request = require('request');
var options1 = {url: 'https://api.forecast.solar/estimate/xx.35/xx.24/40/90/7.26', method: 'GET', headers: { 'User-Agent': 'request' }};
var options2 = {url: 'https://api.forecast.solar/estimate/xx.35/xx.24/40/-90/2.64', method: 'GET', headers: { 'User-Agent': 'request' }};


var urls = [
  {myUrl:options1,mySolarJSON:SolarJSON1,mySolarJSONAll:SolarJSONAll1,mySolarJSONGraphAll:SolarJSONGraphAll1},
  {myUrl:options2,mySolarJSON:SolarJSON2,mySolarJSONAll:SolarJSONAll2,mySolarJSONGraphAll:SolarJSONGraphAll2}
]

var promises = urls.map(myAsyncRequest);
schedule('6 6-22 * * *', getSolar);

getSolar();


function myAsyncRequest(myUrl) {
  log('Request '+myUrl.myUrl.url);
  return new Promise((resolve, reject) => {
     request(myUrl.myUrl.url, function(error, response, body) {
        if (!error && response.statusCode == 200) {
            let today = formatDate(new Date(), 'YYYY-MM-DD');
            let watts = JSON.parse(body).result.watts;
            setState(myUrl.mySolarJSONAll, JSON.stringify(watts), true);
            let table = [];
            for(let time in watts) {
                let pos1 = time.indexOf(':00:00');
                let pos2 = time.indexOf(':30:00');
                if((pos1 != -1) || (pos2 != -1)) {
                    let entry = {};
                    entry.Uhrzeit = time;
                    entry.Leistung = watts[time];
                    table.push(entry);
                }
            }
            log ('JSON: '+myUrl.mySolarJSON);
            setState(myUrl.mySolarJSON, JSON.stringify(table), true);
        // make GraphTable

            let graphTimeData = [];

                for(let time in watts) {
                    let graphEntry ={};
                    graphEntry.t = Date.parse(time);
                    graphEntry.y = watts[time];
                    graphTimeData.push(graphEntry);
            }
            var graph = {};
            var graphData ={};
            var graphAllData = [];
            graphData.data = graphTimeData;
            graphAllData.push(graphData);
            graph.graphs=graphAllData;
            setState(myUrl.mySolarJSONGraphAll, JSON.stringify(graph), true);

            resolve (body);
        }
    });
  })
}

function makeTable () {
    log ('MakeTable');
    let watts1 = JSON.parse(getState(SolarJSON1).val);
    let watts2 = JSON.parse(getState(SolarJSON2).val);
    log ('Items: '+watts1.length);
    let today = formatDate(new Date(), 'YYYY-MM-DD');
    let table = [];
    let graphTimeData = [];
	let axisLabels = [];

    for(var n=0;n<watts1.length;n++) {
            let entry = {};
            let graphEntry ={};
            let thisTime = watts1[n].Uhrzeit;
            entry.Uhrzeit = watts1[n].Uhrzeit;
            entry.Leistung1 = watts1[n].Leistung;
            entry.Leistung2 = watts2[n].Leistung;
            entry.Summe = watts1[n].Leistung + watts2[n].Leistung;
            table.push(entry);
			 /*
            graphEntry.t = Date.parse(thisTime);
            graphEntry.y = watts1[n].Leistung + watts2[n].Leistung;
            graphTimeData.push(graphEntry);
			graphTimeData.push(watts1[n].Leistung + watts2[n].Leistung);
            let time = watts1[n].Uhrzeit.substr(11, 12);
            axisLabels.push(time);
			*/
    }

	let graphTimeData1 = [];
    for(var n=0;n<watts1.length;n++) {
    	graphTimeData1.push(watts1[n].Leistung);
        let time = watts1[n].Uhrzeit.substr(11,5);
        axisLabels.push(time);
    }

	let graphTimeData2 = [];
    for(var n=0;n<watts2.length;n++) {
   		graphTimeData2.push(watts2[n].Leistung);
    }


    var graph = {};
    var graphAllData = [];
    var graphData = {"legendText": "West","yAxis_id": 1,"type": "bar","displayOrder": 1,"barIsStacked": true,"color":"green","barStackId":1,"datalabel_rotation":-90,"datalabel_color":"lightgreen","datalabel_fontSize":10};
    graphData.data = graphTimeData1;
    graphAllData.push(graphData);
	graphData = {"legendText": "Ost","yAxis_id": 1,"type": "bar","displayOrder": 1,"barIsStacked": true,"color":"red","barStackId":1,"datalabel_rotation":-90,"datalabel_color":"lightblue","datalabel_fontSize":10};
    graphData.data = graphTimeData2;
    graphAllData.push(graphData);
    graph.graphs=graphAllData;
	graph.axisLabels =  axisLabels;
    setState(SolarJSONTable, JSON.stringify(table), true);
    setState(SolarJSONGraph, JSON.stringify(graph), true);
}

function getSolar() {
  Promise.all(promises)
  .then(function(bodys) {
    console.log("All url loaded");
    makeTable();
  })
}
Bei "legendText" musst Du noch schauen , welcher Ost und West ist
-
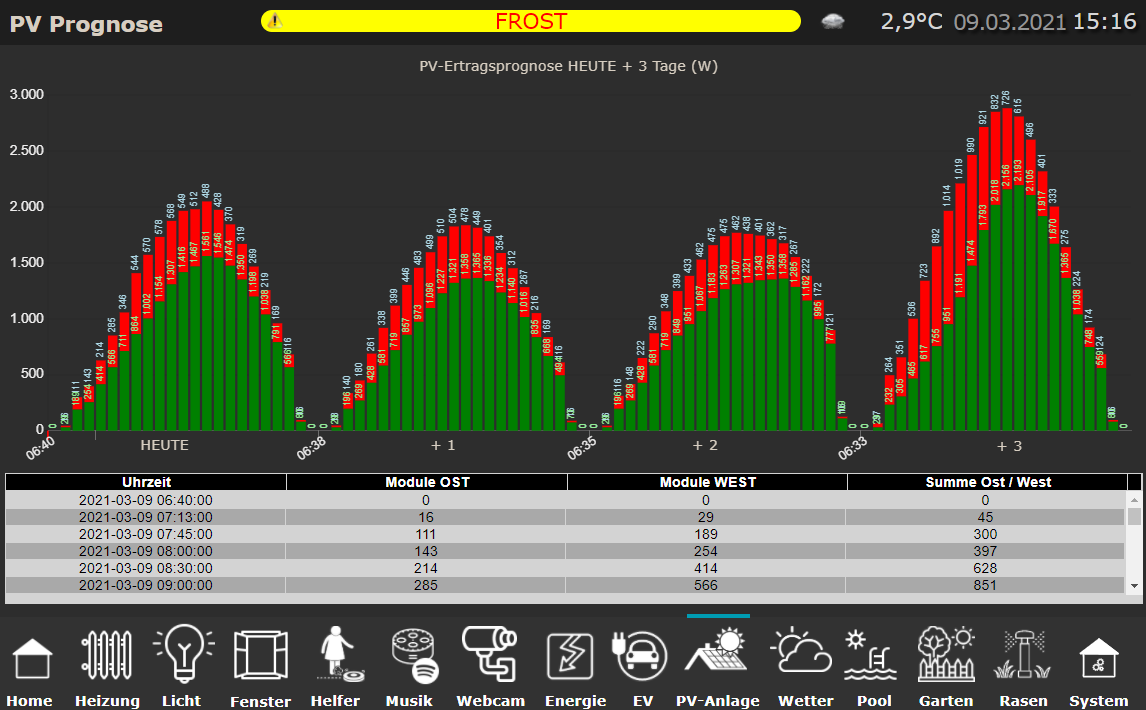
@gargano MEGA !!!
Da kann man gleich sehen wann von welcher Dachseite mit welchem Ertrag zu rechnen ist :+1: :+1:
-
@jb_sullivan Wie hast Du denn die x-Achse hinbekommen ?
Ich hab oben nochmal geändert wegen Legende , wenn Du magstX-Achse ist getrickst - "Heute +1 , +2, +3" sind einfache VIS Textfelder und die Werte habe ich im Widget begrenzt.
Wie kann man die Darstellung drehen? Also die Stapelwerte mit der höheren Wertigkeit (WEST) nach hinten und die niederen (OST) nach vorne?
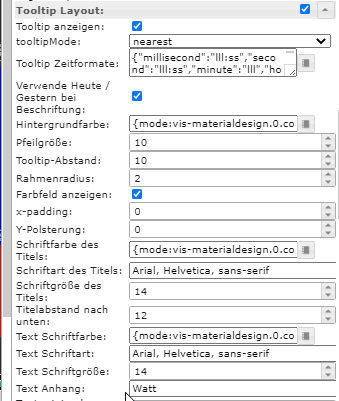
Außerdem scheint im Widget ein kleiner BUG zu sein. Wenn man im Tooltip Layout "text Anhang" auswählt und etwas einträgt, wird das nirgends hinzu gefügt.
ioBroker (since 2018) auf Intel Core i3-5005U NUC und Windwos10 Pro
-
X-Achse ist getrickst - "Heute +1 , +2, +3" sind einfache VIS Textfelder und die Werte habe ich im Widget begrenzt.
Wie kann man die Darstellung drehen? Also die Stapelwerte mit der höheren Wertigkeit (WEST) nach hinten und die niederen (OST) nach vorne?
Außerdem scheint im Widget ein kleiner BUG zu sein. Wenn man im Tooltip Layout "text Anhang" auswählt und etwas einträgt, wird das nirgends hinzu gefügt.
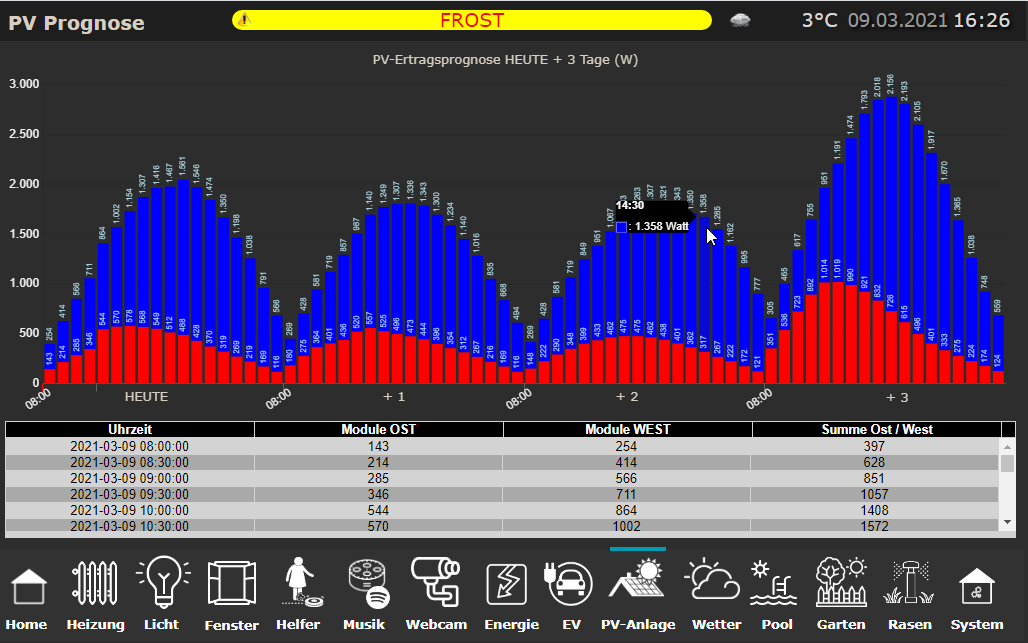
@jb_sullivan Also oben und unten vertauschen ?
Einfach displayOrder ändern in 2 und 1 in Zeile 136 und 139
-
X-Achse ist getrickst - "Heute +1 , +2, +3" sind einfache VIS Textfelder und die Werte habe ich im Widget begrenzt.
Wie kann man die Darstellung drehen? Also die Stapelwerte mit der höheren Wertigkeit (WEST) nach hinten und die niederen (OST) nach vorne?
Außerdem scheint im Widget ein kleiner BUG zu sein. Wenn man im Tooltip Layout "text Anhang" auswählt und etwas einträgt, wird das nirgends hinzu gefügt.
-
@jb_sullivan ToolTip Anhang geht auch im Script :
"tooltip_AppendText": " kWh"
Wieder in Zeile 136 und 139 voranstellen.
Ich bin glücklich !!!! Super alles so wie ich es mir vorgestellt hatte - PERFEKT !!!
Deine Änderungen haben auch gegriffen - aber trotzdem bleibt aus dem Widget heraus der BUG bestehen das er die Eingabe nicht annimmt. Wenn man es über Script macht so wie du oben geschrieben hast - dann funktioniert es. Aber wie gesagt aus dem Widget heraus nicht (zumindest bei mir)
ioBroker (since 2018) auf Intel Core i3-5005U NUC und Windwos10 Pro
-
Ich bin glücklich !!!! Super alles so wie ich es mir vorgestellt hatte - PERFEKT !!!
Deine Änderungen haben auch gegriffen - aber trotzdem bleibt aus dem Widget heraus der BUG bestehen das er die Eingabe nicht annimmt. Wenn man es über Script macht so wie du oben geschrieben hast - dann funktioniert es. Aber wie gesagt aus dem Widget heraus nicht (zumindest bei mir)
-
@jb_sullivan Das Widget ist vom Scrounger.
Wenn Du magst, kannst ein Issue im Github aufmachen.Ja werde ich mal machen. Was mir gerade auffällt - hast du noch was an den Zeiten geändert?
Bei dem Diagramm weiter oben (#112) hat das Diagramm quasi genau so begonnen und geendet, wie aus den Rohdaten auch kommt - jetzt sind alle Diagramme fix von 8:00 bis 16:30 Uhr formatiert.
ioBroker (since 2018) auf Intel Core i3-5005U NUC und Windwos10 Pro
-
Ja werde ich mal machen. Was mir gerade auffällt - hast du noch was an den Zeiten geändert?
Bei dem Diagramm weiter oben (#112) hat das Diagramm quasi genau so begonnen und geendet, wie aus den Rohdaten auch kommt - jetzt sind alle Diagramme fix von 8:00 bis 16:30 Uhr formatiert.
@jb_sullivan Man kann ja nur die Summe von gleichen Zeiten bilden. Daher die Begrenzung auf 00:00 und 30:00. War ja früher auch so.
Wenn Du mal schaust , wie die Rohdaten ausschauen und eine evtl. Ungenauigkeit in den Zeiten verschmerzen kannst, dann kommentiere die Zeilen 59if((pos1 != -1) || (pos2 != -1)) {und 64 aus.
} -
@gargano wenn ich das so auskomatiere, spuckt mir der script Editor den folgenden Fehler aus.

@jb_sullivan Zeig mal bitte den Code.
(nur die beiden Zeilen auskommentieren mit //. Nicht den ganzen Block) -
@jb_sullivan Zeig mal bitte den Code.
(nur die beiden Zeilen auskommentieren mit //. Nicht den ganzen Block)@gargano Habe es schon gefunden - kaum macht man es richtig, funktioniert es ;)
//} = Fehler
// } = Kein Fehler
-
@gargano Habe es schon gefunden - kaum macht man es richtig, funktioniert es ;)
//} = Fehler
// } = Kein Fehler
-
@gerald123 Die Glaskugel ist mir leider entfallen.
Welches Script verwendest Du. das obige ?
Du brauchst nur Lat und Long entsprechend eintragen.
Habs gerade probiert für Wien, geht. -
@gerald123 Die Glaskugel ist mir leider entfallen.
Welches Script verwendest Du. das obige ?
Du brauchst nur Lat und Long entsprechend eintragen.
Habs gerade probiert für Wien, geht. -
@jb_sullivan Zeig mal bitte den Code.
(nur die beiden Zeilen auskommentieren mit //. Nicht den ganzen Block)Guten Morgen gargano - ich wollte mal fragen, ob du ähnliches beobachtet hast. Es scheint so, als ob das Scrit die Daten nach einem Tageswechsel nicht mehr aktualisiert.
Obwohl Rohdaten von der Webseite vorhanden sind, bleibt das Script und somit die Trendausgabe im Vortag stehen.
Hier ein Screenshot von heute morgen - 13.3.
Lt. Chronjob sollten die Daten ja immer zur Minute 0 und Minute 30 einer jeden Stunde abgeholt werden.
var promises = urls.map(myAsyncRequest);
schedule('0,30 * * * *', getSolar);
Wenn ich das Script stoppe und dann neu starte werden die Datenpunkt Einträge auch aktualisiert. Nur über den Tageswechsel schafft das Script das scheinbar nicht.
Vielleicht hängt es ja auch mit BackItUp zusammen. Soweit ich weiß stoppt BackItUp ja auch die Instanzen wenn es eine Sicherung macht. Das passiert bei mir jede Nacht um 2:00 Uhr. Allerdings sind morgens alle Instanzen Grün incl. js-engine.
-
@jb_sullivan Jetzt , wo Du das sagst, ist es mir auch aufgefallen. Die Daten sind von gestern.
Mit Backup glaube ich nicht, dann müsste ja es ja danach wieder starten und im Log steht ja bei mir das er das ausgeführt hat. Und ich hab BackitUp nur jede WocheKannst Du mal nach Zeile 51 dies einfügen, also nach
if (!error && response.statusCode == 200) {console.log (body);und nach Zeile 92 (jetzt dann Zeile 93) nach
  resolve (body);
        }
else console.log ('Error '+error +'Status '+ response.statusCode);Ich machs bei mir auch, dann werden wir morgen sehen
OK, habe ich gemacht, aber du hast anscheinend noch mehr Codezeilen denn
resolve (body);ist bei mir in Zeile 87
ioBroker (since 2018) auf Intel Core i3-5005U NUC und Windwos10 Pro
409
Online32.7k
Users82.4k
Topics1.3m
Posts