

Visualisierungsvorlage Photovoltaik
-
@alexho sagte in Visualisierungsvorlage Photovoltaik:
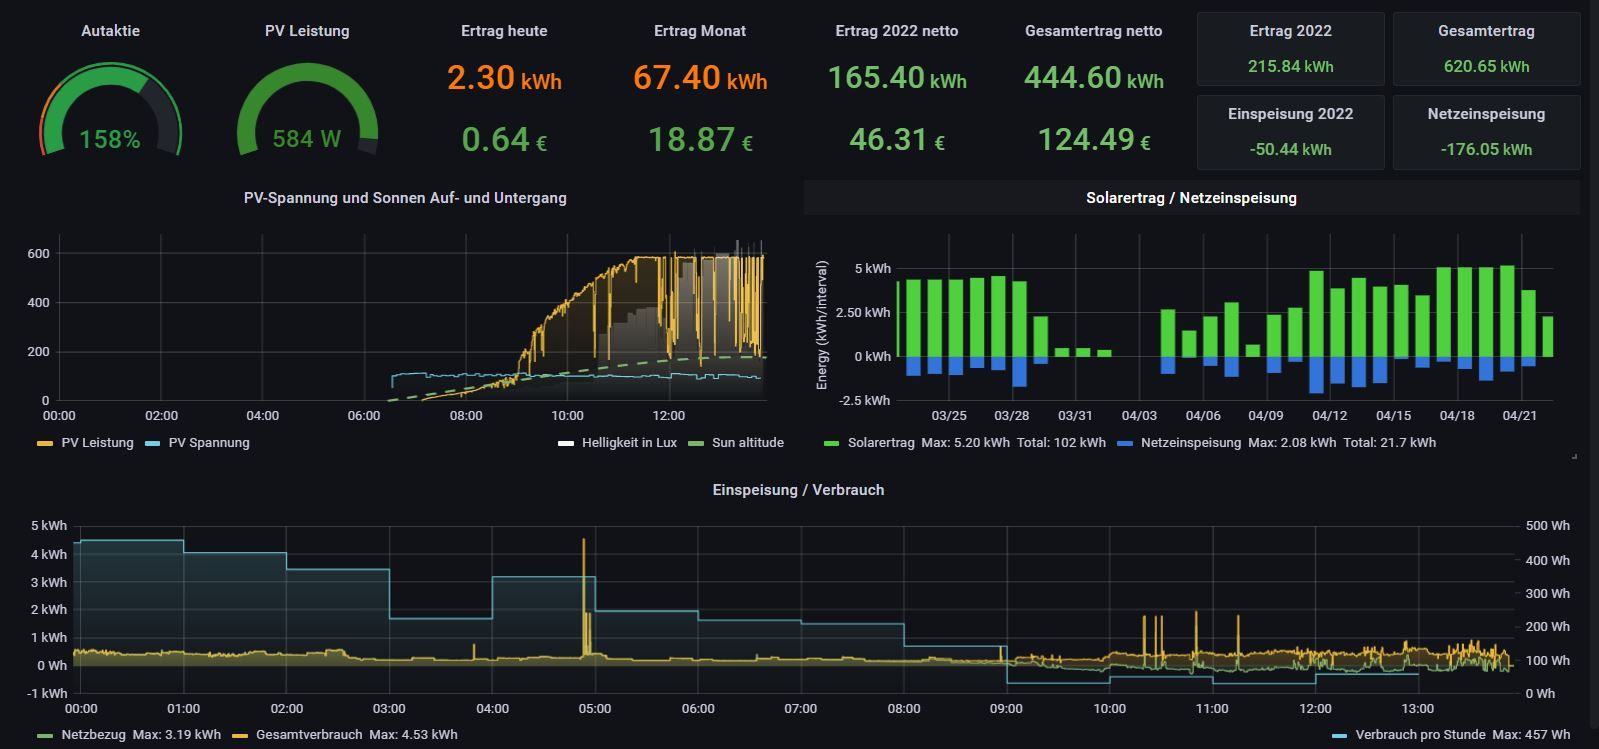
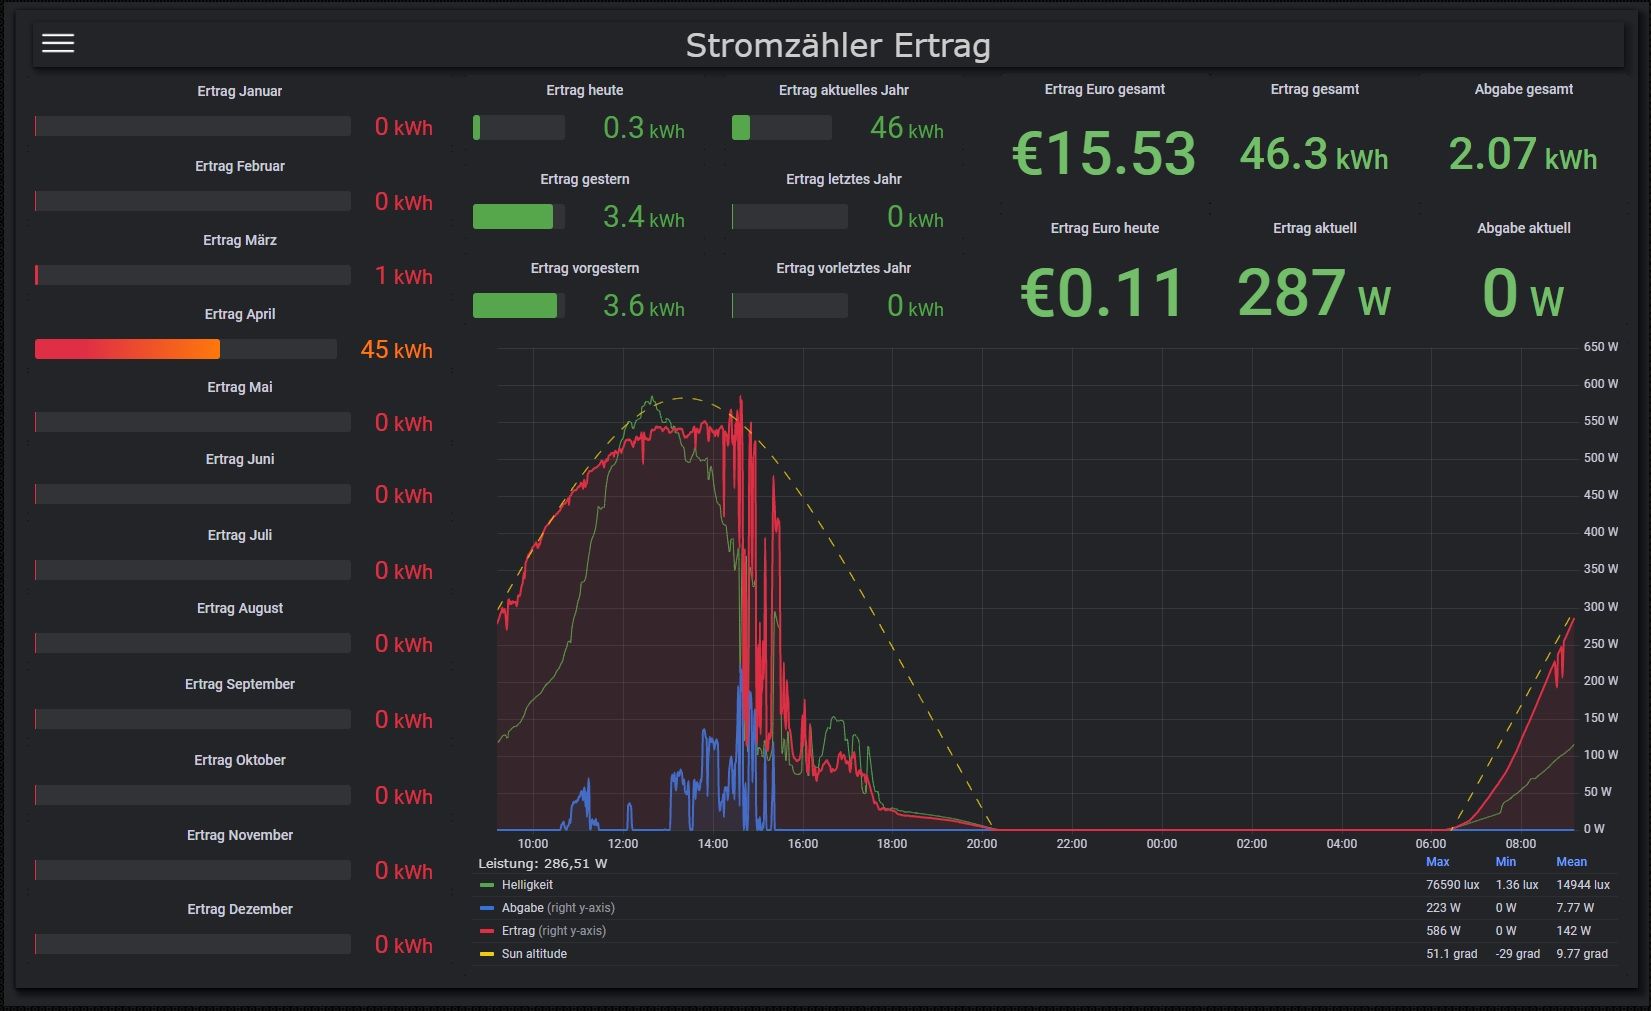
Hier ist meine Umsetzung, mit einigen Scripts und Grafana
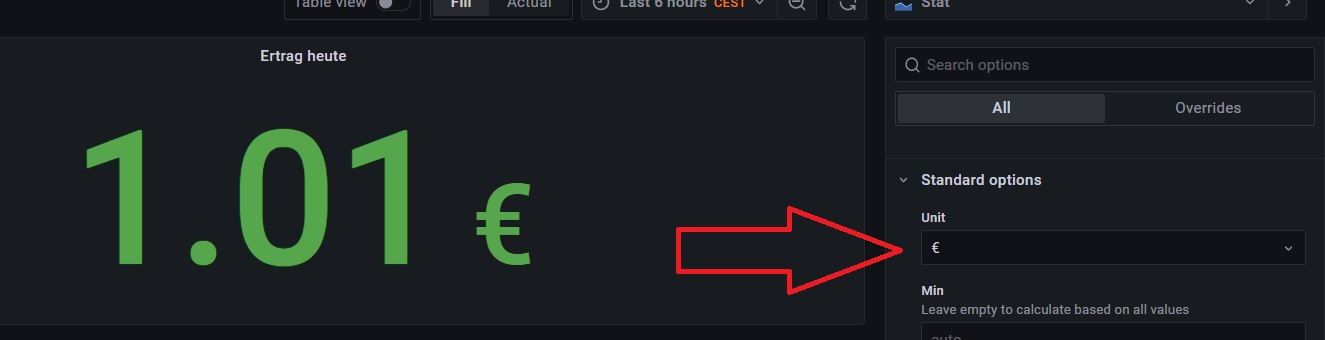
Wie bekommst du in grafana das € Zeichen hinter den Wert? Bei mir steht das immer vor dem Wert und das sieht irgendwie blöd aus...
-
@alexho sagte in Visualisierungsvorlage Photovoltaik:
Hier ist meine Umsetzung, mit einigen Scripts und Grafana
Wie bekommst du in grafana das € Zeichen hinter den Wert? Bei mir steht das immer vor dem Wert und das sieht irgendwie blöd aus...
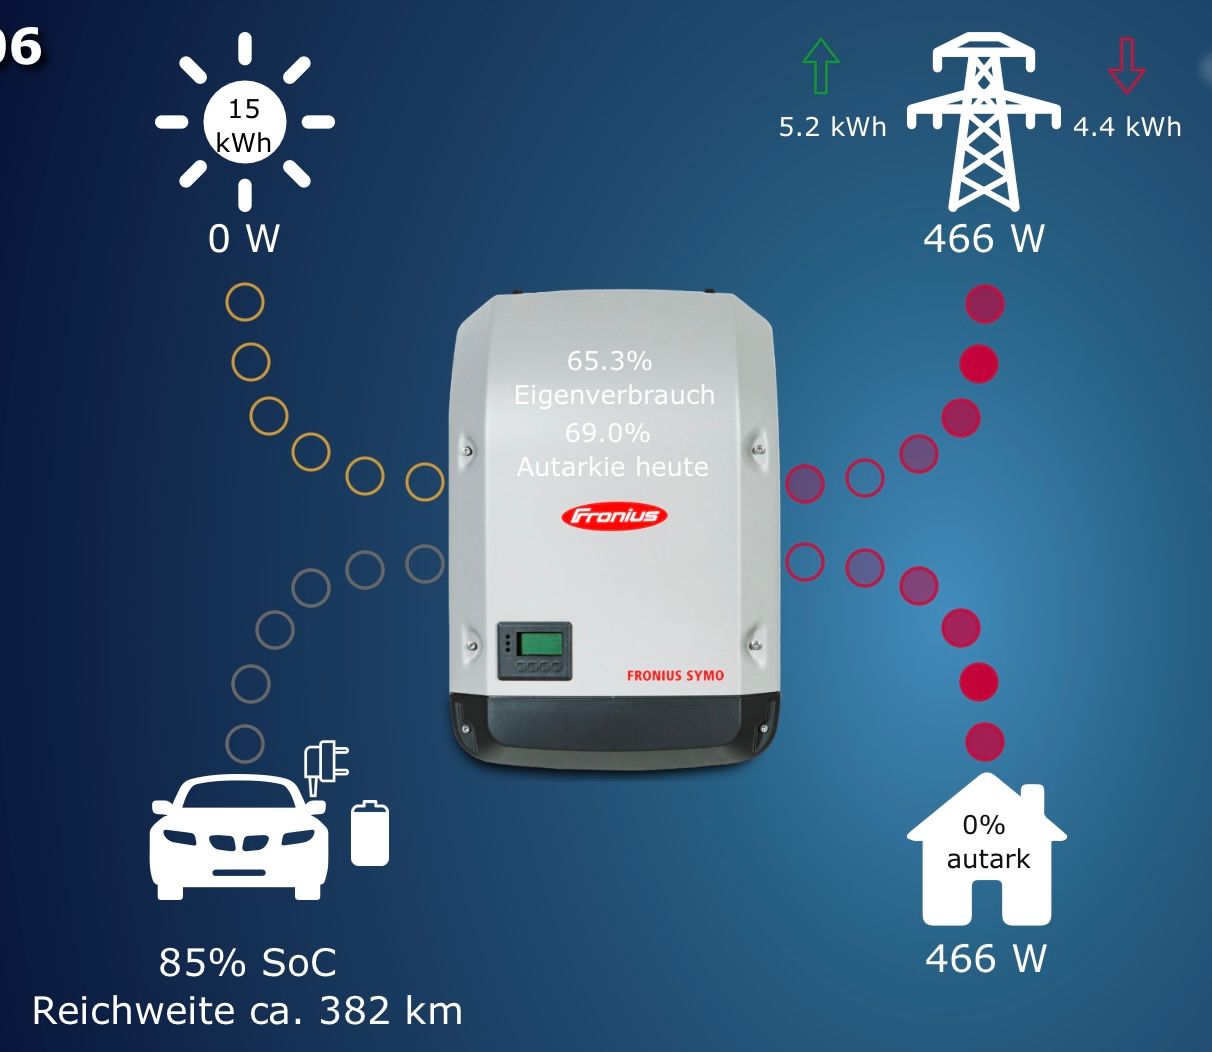
Hi, hier mal meine Version im Material Design:
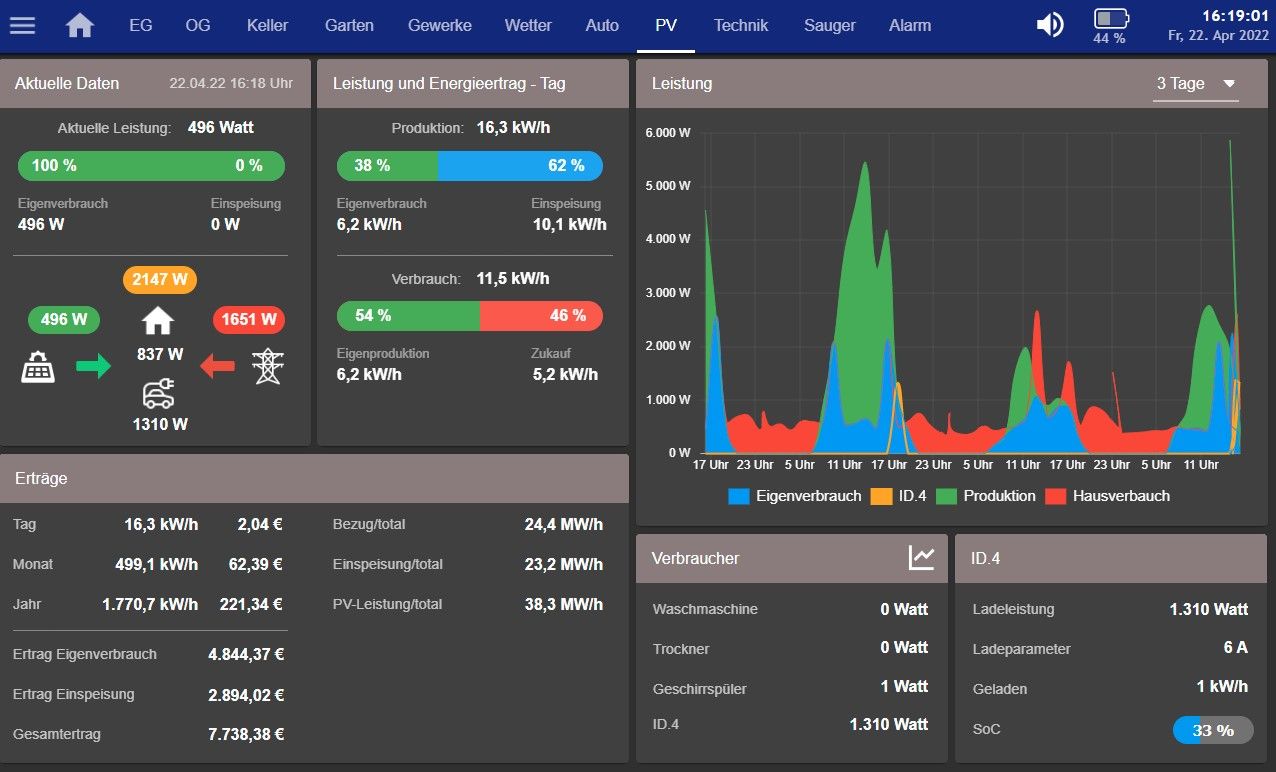
Statt dem E-Auto könntest du deinen Speicher einsetzen.
-
@alexho sagte in Visualisierungsvorlage Photovoltaik:
Hier ist meine Umsetzung, mit einigen Scripts und Grafana
Wie bekommst du in grafana das € Zeichen hinter den Wert? Bei mir steht das immer vor dem Wert und das sieht irgendwie blöd aus...
@saeft_2003
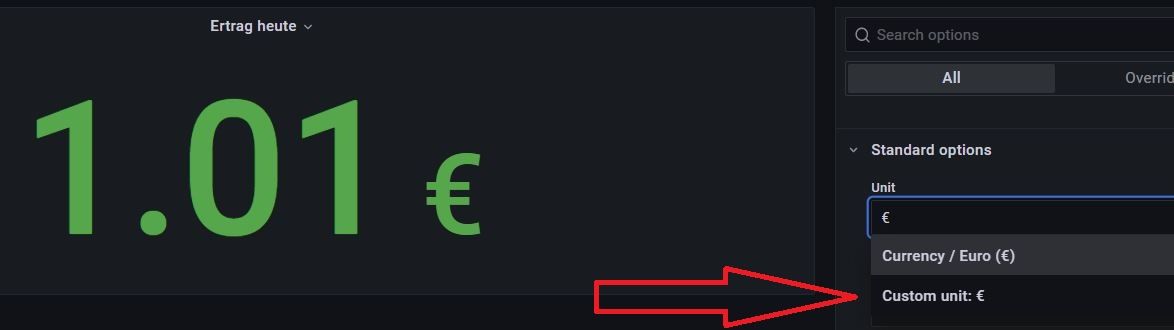
Bei "Standard options > Units" einfach EURO-Zeichen eingeben und dann Custom unit: € auswählen.
-
Hi, hier mal meine Version im Material Design:
Statt dem E-Auto könntest du deinen Speicher einsetzen.
@lesiflo said in Visualisierungsvorlage Photovoltaik:
Hi, hier mal meine Version im Material Design:
Statt dem E-Auto könntest du deinen Speicher einsetzen.
Hallo.
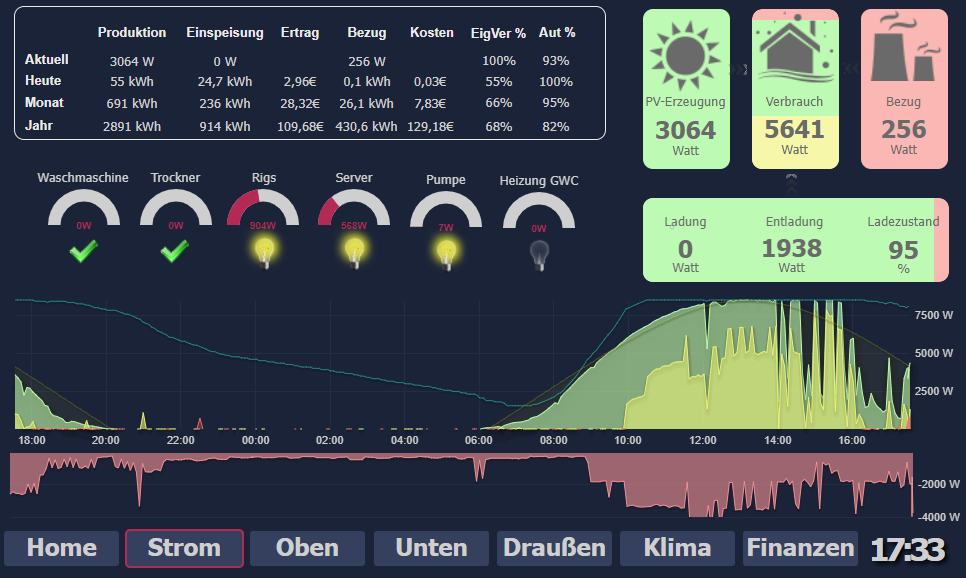
Wie hast Du die BAlken bei Verbrauch, Leistung und Produktion gemacht?
Würdest Du deine View von der PV zur Verfügung stellen?Danke.
-
@lesiflo said in Visualisierungsvorlage Photovoltaik:
Hi, hier mal meine Version im Material Design:
Statt dem E-Auto könntest du deinen Speicher einsetzen.
Hallo.
Wie hast Du die BAlken bei Verbrauch, Leistung und Produktion gemacht?
Würdest Du deine View von der PV zur Verfügung stellen?Danke.
-
@cbrocker said in Visualisierungsvorlage Photovoltaik:
@sopha Hey, sieht klasse aus. Wie hast du die Monats-/Jahressummen kWh erstellt?
dank dir.
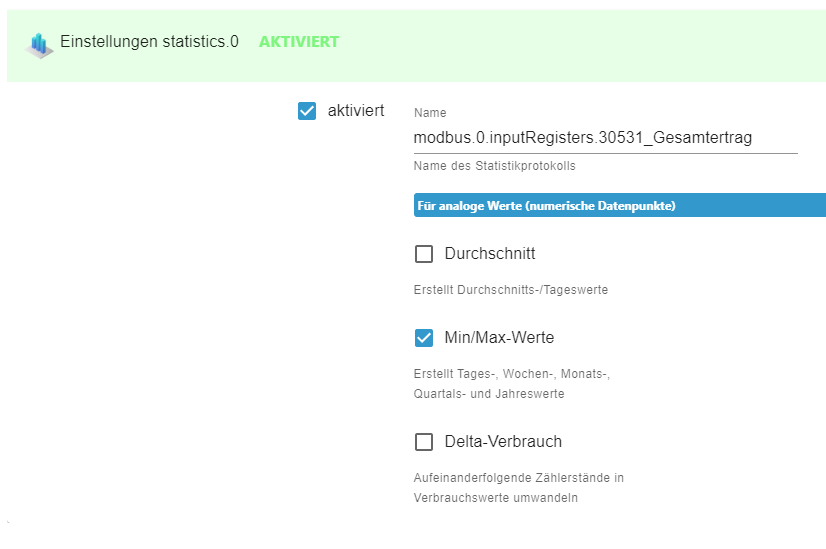
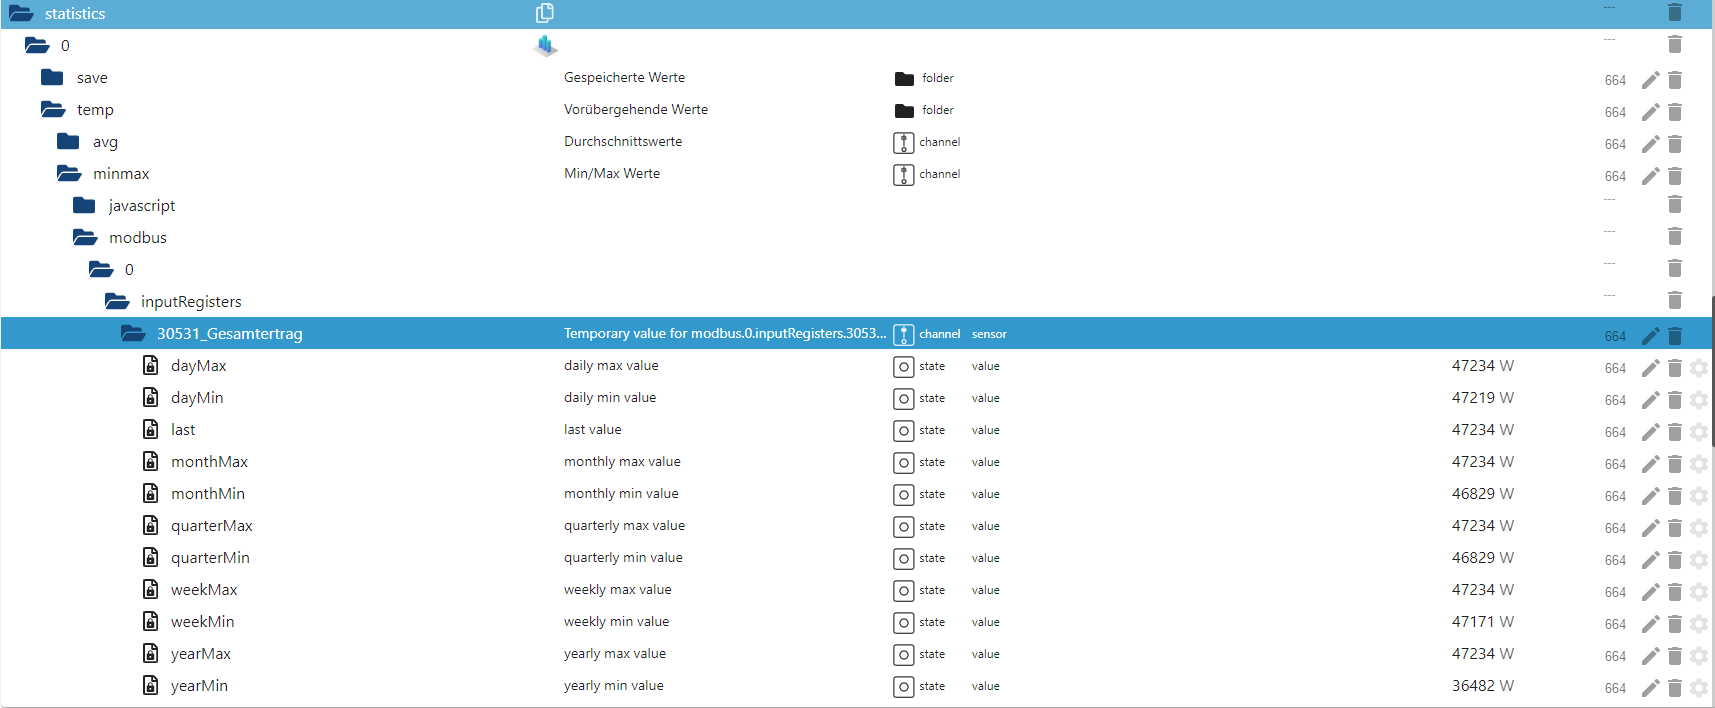
mit der "minmax" Funktion des Statistics Adapters auf den "Gesamtertrag" Wert des Wechselrichters. und dann einfach Month max minues Month min als neue Variable -
@cbrocker said in Visualisierungsvorlage Photovoltaik:
@sopha Hey, sieht klasse aus. Wie hast du die Monats-/Jahressummen kWh erstellt?
dank dir.
mit der "minmax" Funktion des Statistics Adapters auf den "Gesamtertrag" Wert des Wechselrichters. und dann einfach Month max minues Month min als neue Variable -
@mading said in Visualisierungsvorlage Photovoltaik:
@sopha Gesamtertrag pro Tag?
nicht ganz sicher ob ich die Frage richtig verstehe.
Gesamtertrag pro Tag ist der gleiche Ansatz wie Monat, Jahr oder Woche. einfach die Differenz der min und max Werte aus dem Statistics Adapter -
@mading said in Visualisierungsvorlage Photovoltaik:
@sopha Gesamtertrag pro Tag?
nicht ganz sicher ob ich die Frage richtig verstehe.
Gesamtertrag pro Tag ist der gleiche Ansatz wie Monat, Jahr oder Woche. einfach die Differenz der min und max Werte aus dem Statistics Adapter -
@sopha sorry mein Post war etwas kurz. Welchen Wert nimmst du in den Statistics Adapter deiner PV auf, damit du die monatlichen/ jährlichen Werte hast? Der statistics Adapter berechned die monatl/ jährlichen ja, oder berechnest du noch selbst?
-
Bei mir sieht das ganze so aus, allerdings handelt es sich nur um eine mini PV, eine Einspeisung ins Netz spielt bei mir keine große Rolle...
@saeft_2003 sagte in Visualisierungsvorlage Photovoltaik:
Bei mir sieht das ganze so aus, allerdings handelt es sich nur um eine mini PV, eine Einspeisung ins Netz spielt bei mir keine große Rolle...
Könntest -du Dein Dashboard zur Verfügung stellen?
Würde es gerne übernehmen. -
@saeft_2003 sagte in Visualisierungsvorlage Photovoltaik:
Bei mir sieht das ganze so aus, allerdings handelt es sich nur um eine mini PV, eine Einspeisung ins Netz spielt bei mir keine große Rolle...
Könntest -du Dein Dashboard zur Verfügung stellen?
Würde es gerne übernehmen.@g-polat
siehe hier https://forum.iobroker.net/post/805964
-
@g-polat
siehe hier https://forum.iobroker.net/post/805964
hätte ich schon selber nicht mehr gewusst :D es gibt allerdings dazu etwas neues, wenn ich dran denk poste ich das das heute Abend mal...
-
@g-polat
siehe hier https://forum.iobroker.net/post/805964
@glasfaser sagte in Visualisierungsvorlage Photovoltaik:
@g-polat
siehe hier https://forum.iobroker.net/post/805964
Perfekt, vielen Dank.
Hey! Du scheinst an dieser Unterhaltung interessiert zu sein, hast aber noch kein Konto.
Hast du es satt, bei jedem Besuch durch die gleichen Beiträge zu scrollen? Wenn du dich für ein Konto anmeldest, kommst du immer genau dorthin zurück, wo du zuvor warst, und kannst dich über neue Antworten benachrichtigen lassen (entweder per E-Mail oder Push-Benachrichtigung). Du kannst auch Lesezeichen speichern und Beiträge positiv bewerten, um anderen Community-Mitgliedern deine Wertschätzung zu zeigen.
Mit deinem Input könnte dieser Beitrag noch besser werden 💗
Registrieren AnmeldenSupport us
225
Online33.0k
Benutzer83.3k
Themen1.3m
Beiträge