

Forecast.solar mit dem Systeminfo Adapter
-
@jb_sullivan Probier mal aus. Da wird noch "javascript.0.SolarForecast.JSONGraphAll1" und "javascript.0.SolarForecast.JSONGraphAll2" angelegt. mit denen sollte der JsonChart zurecht kommen
const SolarJSON1        = "javascript.0.SolarForecast.JSON1";
const SolarJSON2        = "javascript.0.SolarForecast.JSON2";
const SolarJSONAll1        = "javascript.0.SolarForecast.JSONAll1";
const SolarJSONAll2        = "javascript.0.SolarForecast.JSONAll2";
const SolarJSONGraphAll1        = "javascript.0.SolarForecast.JSONGraphAll1";
const SolarJSONGraphAll2        = "javascript.0.SolarForecast.JSONGraphAll2";
const SolarJSONTable    = "javascript.0.SolarForecast.JSONTable";
const SolarJSONGraph    = "javascript.0.SolarForecast.JSONGraph";

const creatStateList = [
    {name :SolarJSON1, type:"string", role : "value"},
    {name :SolarJSON2, type:"string", role : "value"},
    {name :SolarJSONAll1, type:"string", role : "value"},
    {name :SolarJSONAll2, type:"string", role : "value"},
    {name :SolarJSONGraphAll1, type:"string", role : "value"},
    {name :SolarJSONGraphAll2, type:"string", role : "value"},
    {name :SolarJSONTable, type:"string", role : "value"},
    {name :SolarJSONGraph, type:"string", role : "value"}
]


creatStateList.forEach (function(item) {
    createState(item.name, {
        type: item.type,
        min: 0,
        def: 0,
        role: item.role
    });
});

var request = require('request');
var options1 = {url: 'https://api.forecast.solar/estimate/52.xx/10.xx/40/90/7.26', method: 'GET', headers: { 'User-Agent': 'request' }};
var options2 = {url: 'https://api.forecast.solar/estimate/52.xx/10.xx/40/-90/2.64', method: 'GET', headers: { 'User-Agent': 'request' }};


var urls = [
  {myUrl:options1,mySolarJSON:SolarJSON1,mySolarJSONAll:SolarJSONAll1,mySolarJSONGraphAll:SolarJSONGraphAll1},
  {myUrl:options2,mySolarJSON:SolarJSON2,mySolarJSONAll:SolarJSONAll2,mySolarJSONGraphAll:SolarJSONGraphAll2}
]

var promises = urls.map(myAsyncRequest);
schedule('6 6-22 * * *', getSolar);

getSolar();


function myAsyncRequest(myUrl) {
  log('Request '+myUrl.myUrl.url);
  return new Promise((resolve, reject) => {
     request(myUrl.myUrl.url, function(error, response, body) {
        if (!error && response.statusCode == 200) {
            let today = formatDate(new Date(), 'YYYY-MM-DD');
            let watts = JSON.parse(body).result.watts;
            setState(myUrl.mySolarJSONAll, JSON.stringify(watts), true);
            let table = [];
            for(let time in watts) {
                let pos = time.indexOf(':00:00');
                if(time.includes(today) && pos != -1) {
                    let entry = {};
                    entry.Uhrzeit = time.substr(pos - 2, 5);
                    entry.Leistung = watts[time];
                    table.push(entry);
                }
            }
            log ('JSON: '+myUrl.mySolarJSON);
            setState(myUrl.mySolarJSON, JSON.stringify(table), true);
        // make GraphTable

            let graphTimeData = [];

            for(let time in watts) {
                    let graphEntry ={};
                    graphEntry.t = Date.parse(time);
                    graphEntry.y = watts[time];
                    graphTimeData.push(graphEntry);
            }
            var graph = {};
            var graphData ={};
            var graphAllData = [];
            graphData.data = graphTimeData;
            graphAllData.push(graphData);
            graph.graphs=graphAllData;
            setState(myUrl.mySolarJSONGraphAll, JSON.stringify(graph), true);

            resolve (body);
        }
    });
  })
}

function makeTable () {
    log ('MakeTable');
    let watts1 = JSON.parse(getState(SolarJSON1).val);
    let watts2 = JSON.parse(getState(SolarJSON2).val);
    log ('Items: '+watts1.length);
    let today = formatDate(new Date(), 'YYYY-MM-DD');
    let table = [];
    let graphTimeData = [];

    for(var n=0;n<watts1.length;n++) {
            let entry = {};
            let graphEntry ={};
            let thisTime = today +' '+ watts1[n].Uhrzeit;
            log (thisTime);
            entry.Uhrzeit = watts1[n].Uhrzeit;
            entry.Leistung1 = watts1[n].Leistung;
            entry.Leistung2 = watts2[n].Leistung;
            entry.Summe = watts1[n].Leistung + watts2[n].Leistung;
            table.push(entry);
            graphEntry.t = Date.parse(thisTime);
            graphEntry.y = watts1[n].Leistung + watts2[n].Leistung;
            graphTimeData.push(graphEntry);
    }

    var graph = {};
    var graphData ={};
    var graphAllData = [];
    graphData.data = graphTimeData;
    graphAllData.push(graphData);
    graph.graphs=graphAllData;
    setState(SolarJSONTable, JSON.stringify(table), true);
    setState(SolarJSONGraph, JSON.stringify(graph), true);
}

function getSolar() {
  Promise.all(promises)
  .then(function(bodys) {
    console.log("All url loaded");
    makeTable();
  })
}
und falls Du nur den heutigen Tag brauchst:
for(let time in watts) { if(time.includes(today){ let graphEntry ={}; graphEntry.t = Date.parse(time); graphEntry.y = watts[time]; graphTimeData.push(graphEntry); } }@gargano Scheint soweit zu funktionieren.
Der Tages Graph ist ja schon drin - das ist der DP "javascript.0.SolarForecast.JSONGraph".
Der basiert auf der javascript.0.SolarForecast.JSONTableDie beiden neuen DP`s - javascript.0.SolarForecast.JSONGraphAll1 und - javascript.0.SolarForecast.JSONGraphAll2 zeigen ja jeweils die mehrtägigen Werte einmal der OST und einmal der WEST Seite an.
Im Grunde fehlt jetzt noch ein Graph aus der Addition von OST & West als mehrtägige Darstellung ;)
ioBroker (since 2018) auf Intel Core i3-5005U NUC und Windwos10 Pro
-
@gargano Scheint soweit zu funktionieren.
Der Tages Graph ist ja schon drin - das ist der DP "javascript.0.SolarForecast.JSONGraph".
Der basiert auf der javascript.0.SolarForecast.JSONTableDie beiden neuen DP`s - javascript.0.SolarForecast.JSONGraphAll1 und - javascript.0.SolarForecast.JSONGraphAll2 zeigen ja jeweils die mehrtägigen Werte einmal der OST und einmal der WEST Seite an.
Im Grunde fehlt jetzt noch ein Graph aus der Addition von OST & West als mehrtägige Darstellung ;)
-
@jb_sullivan Kannst mal probeiren , indem Du in der Zeile
if(time.includes(today) && pos != -1) {time.includes(today) &&weglässt
let table = []; for(let time in watts) { let pos = time.indexOf(':00:00'); if(pos != -1) {Ne, ich glaube das war es nicht was ich meine. Die mehrtägigen Graphen stellen ja jeweils nur die OST bzw. die WEST Seite da. Es gibt keinen Graphen der die mehrtägigen Graphen O/W addiert.
Mit der Änderung wird nur die Tabelle um einen weiteren Tag in der Stunden Anzeige verlängert.
ioBroker (since 2018) auf Intel Core i3-5005U NUC und Windwos10 Pro
-
Ne, ich glaube das war es nicht was ich meine. Die mehrtägigen Graphen stellen ja jeweils nur die OST bzw. die WEST Seite da. Es gibt keinen Graphen der die mehrtägigen Graphen O/W addiert.
Mit der Änderung wird nur die Tabelle um einen weiteren Tag in der Stunden Anzeige verlängert.
@jb_sullivan Wenn Du wie oben beschreiben
time.includes(today) &&rausnimmst, dann müsste in "javascript.0.SolarForecast.JSONGraph" und "javascript.0.SolarForecast.JSONTable" die ganzen Tage enthalten sein mit der Summe
Noch was , zusätzlich in
entry.Uhrzeit = time.substr(pos - 2, 5)ändern in
entry.Uhrzeit = timeund in
function makeTable () {
    log ('MakeTable');
    let watts1 = JSON.parse(getState(SolarJSON1).val);
    let watts2 = JSON.parse(getState(SolarJSON2).val);
    log ('Items: '+watts1.length);
    let today = formatDate(new Date(), 'YYYY-MM-DD');
    let table = [];
    let graphTimeData = [];

    for(var n=0;n<watts1.length;n++) {
            let entry = {};
            let graphEntry ={};
            let thisTime = today +' '+ watts1[n].Uhrzeit;
let thisTime = today +' '+ watts1[n].Uhrzeit;ändern in
let thisTime = watts1[n].Uhrzeit; -
@jb_sullivan Wenn Du wie oben beschreiben
time.includes(today) &&rausnimmst, dann müsste in "javascript.0.SolarForecast.JSONGraph" und "javascript.0.SolarForecast.JSONTable" die ganzen Tage enthalten sein mit der Summe
Noch was , zusätzlich in
entry.Uhrzeit = time.substr(pos - 2, 5)ändern in
entry.Uhrzeit = timeund in
function makeTable () {
    log ('MakeTable');
    let watts1 = JSON.parse(getState(SolarJSON1).val);
    let watts2 = JSON.parse(getState(SolarJSON2).val);
    log ('Items: '+watts1.length);
    let today = formatDate(new Date(), 'YYYY-MM-DD');
    let table = [];
    let graphTimeData = [];

    for(var n=0;n<watts1.length;n++) {
            let entry = {};
            let graphEntry ={};
            let thisTime = today +' '+ watts1[n].Uhrzeit;
let thisTime = today +' '+ watts1[n].Uhrzeit;ändern in
let thisTime = watts1[n].Uhrzeit;So, was dein Skript betrifft, sieht jetzt alles ziemlich gut aus. Leider sind die Formatierungsmöglichkeiten in dem materialdesign json chart doch sehr begrenzt. Die Werte lassen sich z.B. nicht von den Balken für eine bessere Sichtbarkeit entkoppeln. Auch die Schriftfarbe der Werte ist immer die gleiche wie die der Balken.
Mal schauen, vielleicht meldet sich ja noch jemand zu dem anderen Thread zu Wort und wir bekommen die Werte irgendwie InfluxDB kompatibel verpackt.
Ich kann es nur immer wieder betonen, vielen Dank für die Zeit die du dir für dieses Script genommen hast. Ich hoffe du hast wenigstens auch etwas davon und kannst es ggf. auch irgendwie einsetzen oder verwenden.
-
@jb_sullivan Gern geschehen.
-
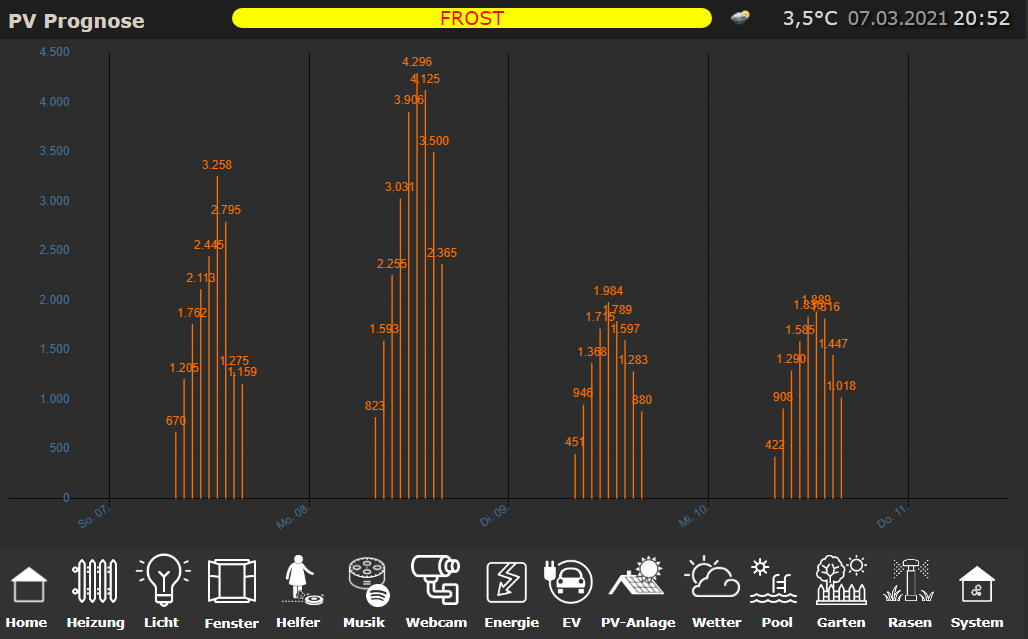
@jb_sullivan Folgende Änderung kannst Du machen für die Data Label Anzeige :
function makeTable () {
....

var graphData ={"datalabel_rotation":-90,"datalabel_color":"#ce2727"};
oder auch :
var graphData ={"datalabel_rotation":-90,"datalabel_color":"lightgreen","datalabel_fontSize":10};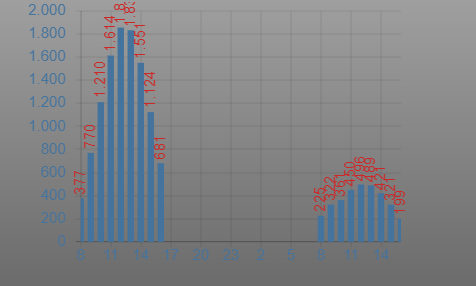
Weitere Properties gibt es
hier -
@jb_sullivan Folgende Änderung kannst Du machen für die Data Label Anzeige :
function makeTable () {
....

var graphData ={"datalabel_rotation":-90,"datalabel_color":"#ce2727"};
oder auch :
var graphData ={"datalabel_rotation":-90,"datalabel_color":"lightgreen","datalabel_fontSize":10};Weitere Properties gibt es
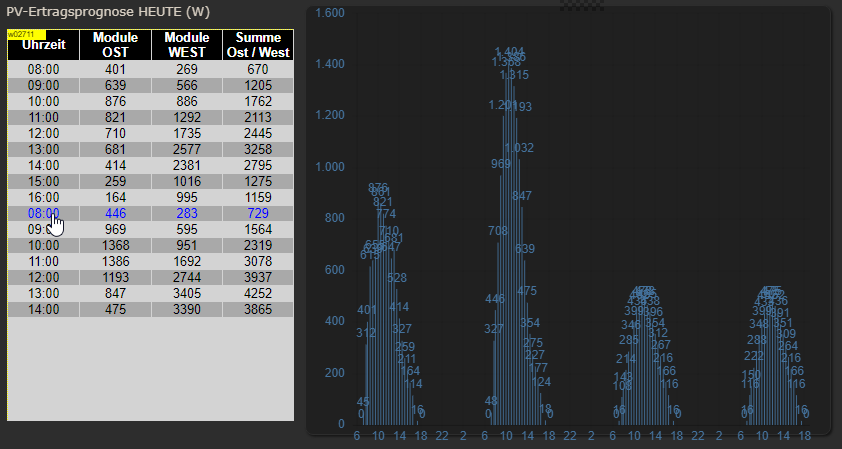
hierJa, super - das funktioniert ja schonmal Klasse. Dann ist das ganze optisch auch ein bisschen gefälliger und offensichtlich kommen wir wohl Wettertechnisch was die Vorschau betrifft aus einer ähnlichen Region (Niedersachsen?)
Was ich aber noch nicht wirklich verstehe ist die Menge an Trendlinien.
Wenn ich mir meinen API Aufruf ansehe, fängt dieser um 6:42 Uhr an und endet um 18:18 Uhr. Auch wenn die Berechnung auf volle Stunde ausgelegt ist, so beginnen die Trendlinien erst um 8:00 Uhr und enden um 16:00 Uhr.
Da wäre für mein Verständis noch Luft für 7:00 und 17:00 Uhr - oder wo liegt mein Denkfehler?
ioBroker (since 2018) auf Intel Core i3-5005U NUC und Windwos10 Pro
-
Ja, super - das funktioniert ja schonmal Klasse. Dann ist das ganze optisch auch ein bisschen gefälliger und offensichtlich kommen wir wohl Wettertechnisch was die Vorschau betrifft aus einer ähnlichen Region (Niedersachsen?)
Was ich aber noch nicht wirklich verstehe ist die Menge an Trendlinien.
Wenn ich mir meinen API Aufruf ansehe, fängt dieser um 6:42 Uhr an und endet um 18:18 Uhr. Auch wenn die Berechnung auf volle Stunde ausgelegt ist, so beginnen die Trendlinien erst um 8:00 Uhr und enden um 16:00 Uhr.
Da wäre für mein Verständis noch Luft für 7:00 und 17:00 Uhr - oder wo liegt mein Denkfehler?
@jb_sullivan Nee , bin in Niederbayern, auch wenn das Nieder gleich ist. Nur ist die letzten Tage endlich schönes Wetter.
Schau Dir mal die Rohdaten an, die werden die :00 Zeiten erst um 8 beginnen.
Kannst aber mal schauen , ob das mit 30 Minuten zusätzlich auch geht, ansonsten geht noch interpolieren
function makeResponse .... for(let time in watts) { let pos1 = time.indexOf(':00:00'); let pos2 = time.indexOf(':30:00'); if((pos1 != -1) || (pos2 != -1)) { -
@jb_sullivan Nee , bin in Niederbayern, auch wenn das Nieder gleich ist. Nur ist die letzten Tage endlich schönes Wetter.
Schau Dir mal die Rohdaten an, die werden die :00 Zeiten erst um 8 beginnen.
Kannst aber mal schauen , ob das mit 30 Minuten zusätzlich auch geht, ansonsten geht noch interpolieren
function makeResponse .... for(let time in watts) { let pos1 = time.indexOf(':00:00'); let pos2 = time.indexOf(':30:00'); if((pos1 != -1) || (pos2 != -1)) {@gargano Achso - :00 ist der Knackpunkt. Ich dachte das Script rechnet mit Minuten und brauch immer volle 60 Minuten als Stunde.
Also z.B. 6:42 - 7:42, 7:42 - 8:42 usw. alles was "hinten raus" nicht passt, wird dann nicht mehr als volle Stunde dargestellt - also z.B. 17:42 ..... 18:42
18:42 gibt es aber nicht, weil 18:18 der letzte Wert rein kommt und somit fällt diese Stunde weg.
-
@jb_sullivan Nee , bin in Niederbayern, auch wenn das Nieder gleich ist. Nur ist die letzten Tage endlich schönes Wetter.
Schau Dir mal die Rohdaten an, die werden die :00 Zeiten erst um 8 beginnen.
Kannst aber mal schauen , ob das mit 30 Minuten zusätzlich auch geht, ansonsten geht noch interpolieren
function makeResponse .... for(let time in watts) { let pos1 = time.indexOf(':00:00'); let pos2 = time.indexOf(':30:00'); if((pos1 != -1) || (pos2 != -1)) {@gargano sagte in Forecast.solar mit dem Systeminfo Adapter:
{ let pos1 = time.indexOf(':00:00'); let pos2 = time.indexOf(':30:00'); if((pos1 != -1) || (pos2 != -1)) {
Das scheint nicht zu gehen - er unterstreicht mir immer einen Klammerfehler in Zeile 90. Ich kann da aber nichts erkennen was falsch sein könnte.
Genauso habe ich jetzt gesehen, das er bei
var graphData = {"datalabel_rotation":-90,"datalabel_color":"lightgreen","datalabel_fontSize":10};Das
graphDataals Fehler? ~~~~ unterstreicht. Ausführen tut er es aber trotzdem.ioBroker (since 2018) auf Intel Core i3-5005U NUC und Windwos10 Pro
-
@gargano sagte in Forecast.solar mit dem Systeminfo Adapter:
{ let pos1 = time.indexOf(':00:00'); let pos2 = time.indexOf(':30:00'); if((pos1 != -1) || (pos2 != -1)) {
Das scheint nicht zu gehen - er unterstreicht mir immer einen Klammerfehler in Zeile 90. Ich kann da aber nichts erkennen was falsch sein könnte.
Genauso habe ich jetzt gesehen, das er bei
var graphData = {"datalabel_rotation":-90,"datalabel_color":"lightgreen","datalabel_fontSize":10};Das
graphDataals Fehler? ~~~~ unterstreicht. Ausführen tut er es aber trotzdem. -
const SolarJSON1        = "javascript.0.SolarForecast.JSON1";
const SolarJSON2        = "javascript.0.SolarForecast.JSON2";
const SolarJSONAll1        = "javascript.0.SolarForecast.JSONAll1";
const SolarJSONAll2        = "javascript.0.SolarForecast.JSONAll2";
const SolarJSONGraphAll1        = "javascript.0.SolarForecast.JSONGraphAll1";
const SolarJSONGraphAll2        = "javascript.0.SolarForecast.JSONGraphAll2";
const SolarJSONTable    = "javascript.0.SolarForecast.JSONTable";
const SolarJSONGraph    = "javascript.0.SolarForecast.JSONGraph";

const creatStateList = [
    {name :SolarJSON1, type:"string", role : "value"},
    {name :SolarJSON2, type:"string", role : "value"},
    {name :SolarJSONAll1, type:"string", role : "value"},
    {name :SolarJSONAll2, type:"string", role : "value"},
    {name :SolarJSONGraphAll1, type:"string", role : "value"},
    {name :SolarJSONGraphAll2, type:"string", role : "value"},
    {name :SolarJSONTable, type:"string", role : "value"},
    {name :SolarJSONGraph, type:"string", role : "value"}
]


creatStateList.forEach (function(item) {
    createState(item.name, {
        type: item.type,
        min: 0,
        def: 0,
        role: item.role
    });
});

var request = require('request');
var options1 = {url: 'https://api.forecast.solar/estimate/xx.35/xx.24/40/90/7.26', method: 'GET', headers: { 'User-Agent': 'request' }};
var options2 = {url: 'https://api.forecast.solar/estimate/xx.35/xx.24/40/-90/2.64', method: 'GET', headers: { 'User-Agent': 'request' }};


var urls = [
  {myUrl:options1,mySolarJSON:SolarJSON1,mySolarJSONAll:SolarJSONAll1,mySolarJSONGraphAll:SolarJSONGraphAll1},
  {myUrl:options2,mySolarJSON:SolarJSON2,mySolarJSONAll:SolarJSONAll2,mySolarJSONGraphAll:SolarJSONGraphAll2}
]

var promises = urls.map(myAsyncRequest);
schedule('6 6-22 * * *', getSolar);

getSolar();


function myAsyncRequest(myUrl) {
  log('Request '+myUrl.myUrl.url);
  return new Promise((resolve, reject) => {
     request(myUrl.myUrl.url, function(error, response, body) {
        if (!error && response.statusCode == 200) {
            let today = formatDate(new Date(), 'YYYY-MM-DD');
            let watts = JSON.parse(body).result.watts;
            setState(myUrl.mySolarJSONAll, JSON.stringify(watts), true);
            let table = [];
            for(let time in watts) {
                let pos = time.indexOf(':00:00');
                if(pos != -1) {
                    let entry = {};
                    entry.Uhrzeit = time;
                    entry.Leistung = watts[time];
                    table.push(entry);
                }
            }
            log ('JSON: '+myUrl.mySolarJSON);
            setState(myUrl.mySolarJSON, JSON.stringify(table), true);
        // make GraphTable

            let graphTimeData = [];

            for(let time in watts) {
                    let graphEntry ={};
                    graphEntry.t = Date.parse(time);
                    graphEntry.y = watts[time];
                    graphTimeData.push(graphEntry);
            }
            var graph = {};
            var graphData ={};
            var graphAllData = [];
            graphData.data = graphTimeData;
            graphAllData.push(graphData);
            graph.graphs=graphAllData;
            setState(myUrl.mySolarJSONGraphAll, JSON.stringify(graph), true);

            resolve (body);
        }
    });
  })
}

function makeTable () {
    log ('MakeTable');
    let watts1 = JSON.parse(getState(SolarJSON1).val);
    let watts2 = JSON.parse(getState(SolarJSON2).val);
    log ('Items: '+watts1.length);
    let today = formatDate(new Date(), 'YYYY-MM-DD');
    let table = [];
    let graphTimeData = [];

    for(var n=0;n<watts1.length;n++) {
            let entry = {};
            let graphEntry ={};
            let thisTime = watts1[n].Uhrzeit;
            log (thisTime);
            entry.Uhrzeit = watts1[n].Uhrzeit;
            entry.Leistung1 = watts1[n].Leistung;
            entry.Leistung2 = watts2[n].Leistung;
            entry.Summe = watts1[n].Leistung + watts2[n].Leistung;
            table.push(entry);
            graphEntry.t = Date.parse(thisTime);
            graphEntry.y = watts1[n].Leistung + watts2[n].Leistung;
            graphTimeData.push(graphEntry);
    }

    var graph = {};
    var graphData = {};
    var graphAllData = [];
    var graphData = {"datalabel_rotation":-90,"datalabel_color":"lightgreen","datalabel_fontSize":10};
    graphData.data = graphTimeData;
    graphAllData.push(graphData);
    graph.graphs=graphAllData;
    setState(SolarJSONTable, JSON.stringify(table), true);
    setState(SolarJSONGraph, JSON.stringify(graph), true);
}

function getSolar() {
  Promise.all(promises)
  .then(function(bodys) {
    console.log("All url loaded");
    makeTable();
  })
}
ioBroker (since 2018) auf Intel Core i3-5005U NUC und Windwos10 Pro
-
const SolarJSON1 = "javascript.0.SolarForecast.JSON1"; const SolarJSON2 = "javascript.0.SolarForecast.JSON2"; const SolarJSONAll1 = "javascript.0.SolarForecast.JSONAll1"; const SolarJSONAll2 = "javascript.0.SolarForecast.JSONAll2"; const SolarJSONGraphAll1 = "javascript.0.SolarForecast.JSONGraphAll1"; const SolarJSONGraphAll2 = "javascript.0.SolarForecast.JSONGraphAll2"; const SolarJSONTable = "javascript.0.SolarForecast.JSONTable"; const SolarJSONGraph = "javascript.0.SolarForecast.JSONGraph"; const creatStateList = [ {name :SolarJSON1, type:"string", role : "value"}, {name :SolarJSON2, type:"string", role : "value"}, {name :SolarJSONAll1, type:"string", role : "value"}, {name :SolarJSONAll2, type:"string", role : "value"}, {name :SolarJSONGraphAll1, type:"string", role : "value"}, {name :SolarJSONGraphAll2, type:"string", role : "value"}, {name :SolarJSONTable, type:"string", role : "value"}, {name :SolarJSONGraph, type:"string", role : "value"} ] creatStateList.forEach (function(item) { createState(item.name, { type: item.type, min: 0, def: 0, role: item.role }); }); var request = require('request'); var options1 = {url: 'https://api.forecast.solar/estimate/xx.35/xx.24/40/90/7.26', method: 'GET', headers: { 'User-Agent': 'request' }}; var options2 = {url: 'https://api.forecast.solar/estimate/xx.35/xx.24/40/-90/2.64', method: 'GET', headers: { 'User-Agent': 'request' }}; var urls = [ {myUrl:options1,mySolarJSON:SolarJSON1,mySolarJSONAll:SolarJSONAll1,mySolarJSONGraphAll:SolarJSONGraphAll1}, {myUrl:options2,mySolarJSON:SolarJSON2,mySolarJSONAll:SolarJSONAll2,mySolarJSONGraphAll:SolarJSONGraphAll2} ] var promises = urls.map(myAsyncRequest); schedule('6 6-22 * * *', getSolar); getSolar(); function myAsyncRequest(myUrl) { log('Request '+myUrl.myUrl.url); return new Promise((resolve, reject) => { request(myUrl.myUrl.url, function(error, response, body) { if (!error && response.statusCode == 200) { let today = formatDate(new Date(), 'YYYY-MM-DD'); let watts = JSON.parse(body).result.watts; setState(myUrl.mySolarJSONAll, JSON.stringify(watts), true); let table = []; for(let time in watts) { let pos = time.indexOf(':00:00'); if(pos != -1) { let entry = {}; entry.Uhrzeit = time; entry.Leistung = watts[time]; table.push(entry); } } log ('JSON: '+myUrl.mySolarJSON); setState(myUrl.mySolarJSON, JSON.stringify(table), true); // make GraphTable let graphTimeData = []; for(let time in watts) { let graphEntry ={}; graphEntry.t = Date.parse(time); graphEntry.y = watts[time]; graphTimeData.push(graphEntry); } var graph = {}; var graphData ={}; var graphAllData = []; graphData.data = graphTimeData; graphAllData.push(graphData); graph.graphs=graphAllData; setState(myUrl.mySolarJSONGraphAll, JSON.stringify(graph), true); resolve (body); } }); }) } function makeTable () { log ('MakeTable'); let watts1 = JSON.parse(getState(SolarJSON1).val); let watts2 = JSON.parse(getState(SolarJSON2).val); log ('Items: '+watts1.length); let today = formatDate(new Date(), 'YYYY-MM-DD'); let table = []; let graphTimeData = []; for(var n=0;n<watts1.length;n++) { let entry = {}; let graphEntry ={}; let thisTime = watts1[n].Uhrzeit; log (thisTime); entry.Uhrzeit = watts1[n].Uhrzeit; entry.Leistung1 = watts1[n].Leistung; entry.Leistung2 = watts2[n].Leistung; entry.Summe = watts1[n].Leistung + watts2[n].Leistung; table.push(entry); graphEntry.t = Date.parse(thisTime); graphEntry.y = watts1[n].Leistung + watts2[n].Leistung; graphTimeData.push(graphEntry); } var graph = {}; var graphData = {}; var graphAllData = []; var graphData = {"datalabel_rotation":-90,"datalabel_color":"lightgreen","datalabel_fontSize":10}; graphData.data = graphTimeData; graphAllData.push(graphData); graph.graphs=graphAllData; setState(SolarJSONTable, JSON.stringify(table), true); setState(SolarJSONGraph, JSON.stringify(graph), true); } function getSolar() { Promise.all(promises) .then(function(bodys) { console.log("All url loaded"); makeTable(); }) }@jb_sullivan Du hast zweimal graphData als Variable in
function makeTable ()
deklariert.
Lösch mal die Zeilevar graphData = {}; -
@jb_sullivan Du hast zweimal graphData als Variable in
function makeTable ()
deklariert.
Lösch mal die Zeilevar graphData = {};@gargano Achso - mache ich schnell wieder rein - moment
-
@jb_sullivan Du hast zweimal graphData als Variable in
function makeTable ()
deklariert.
Lösch mal die Zeilevar graphData = {};@gargano sagte in Forecast.solar mit dem Systeminfo Adapter:
Lösch mal die Zeile
var graphData = {};OK, damit ist der Fehler aus Zeile 121 weg - ein fehler in Zeile 90 bleibt noch. Liegt bestimmt auch an meinen Drag & Drop "Künsten" ;)
Im übrigen gibt es keine "makeResponse" - das hat mich sowieso gewundert.
const SolarJSON1        = "javascript.0.SolarForecast.JSON1";
const SolarJSON2        = "javascript.0.SolarForecast.JSON2";
const SolarJSONAll1        = "javascript.0.SolarForecast.JSONAll1";
const SolarJSONAll2        = "javascript.0.SolarForecast.JSONAll2";
const SolarJSONGraphAll1        = "javascript.0.SolarForecast.JSONGraphAll1";
const SolarJSONGraphAll2        = "javascript.0.SolarForecast.JSONGraphAll2";
const SolarJSONTable    = "javascript.0.SolarForecast.JSONTable";
const SolarJSONGraph    = "javascript.0.SolarForecast.JSONGraph";

const creatStateList = [
    {name :SolarJSON1, type:"string", role : "value"},
    {name :SolarJSON2, type:"string", role : "value"},
    {name :SolarJSONAll1, type:"string", role : "value"},
    {name :SolarJSONAll2, type:"string", role : "value"},
    {name :SolarJSONGraphAll1, type:"string", role : "value"},
    {name :SolarJSONGraphAll2, type:"string", role : "value"},
    {name :SolarJSONTable, type:"string", role : "value"},
    {name :SolarJSONGraph, type:"string", role : "value"}
]


creatStateList.forEach (function(item) {
    createState(item.name, {
        type: item.type,
        min: 0,
        def: 0,
        role: item.role
    });
});

var request = require('request');
var options1 = {url: 'https://api.forecast.solar/estimate/xx.35/xx.24/40/90/7.26', method: 'GET', headers: { 'User-Agent': 'request' }};
var options2 = {url: 'https://api.forecast.solar/estimate/xx.35/xx.24/40/-90/2.64', method: 'GET', headers: { 'User-Agent': 'request' }};


var urls = [
  {myUrl:options1,mySolarJSON:SolarJSON1,mySolarJSONAll:SolarJSONAll1,mySolarJSONGraphAll:SolarJSONGraphAll1},
  {myUrl:options2,mySolarJSON:SolarJSON2,mySolarJSONAll:SolarJSONAll2,mySolarJSONGraphAll:SolarJSONGraphAll2}
]

var promises = urls.map(myAsyncRequest);
schedule('6 6-22 * * *', getSolar);

getSolar();


function myAsyncRequest(myUrl) {
  log('Request '+myUrl.myUrl.url);
  return new Promise((resolve, reject) => {
     request(myUrl.myUrl.url, function(error, response, body) {
        if (!error && response.statusCode == 200) {
            let today = formatDate(new Date(), 'YYYY-MM-DD');
            let watts = JSON.parse(body).result.watts;
            setState(myUrl.mySolarJSONAll, JSON.stringify(watts), true);
            let table = [];
            for(let time in watts) {
                let pos = time.indexOf(':00:00');
                if(pos != -1) {
                    let entry = {};
                    entry.Uhrzeit = time;
                    entry.Leistung = watts[time];
                    table.push(entry);
                }
            }
            log ('JSON: '+myUrl.mySolarJSON);
            setState(myUrl.mySolarJSON, JSON.stringify(table), true);
        // make GraphTable

            let graphTimeData = [];

                for(let time in watts) {
                    let pos1 = time.indexOf(':00:00');
                    let pos2 = time.indexOf(':30:00');
                    if((pos1 != -1) || (pos2 != -1)) {
                    let graphEntry ={};
                    graphEntry.t = Date.parse(time);
                    graphEntry.y = watts[time];
                    graphTimeData.push(graphEntry);
            }
            var graph = {};
            var graphData ={};
            var graphAllData = [];
            graphData.data = graphTimeData;
            graphAllData.push(graphData);
            graph.graphs=graphAllData;
            setState(myUrl.mySolarJSONGraphAll, JSON.stringify(graph), true);

            resolve (body);
        }
    });
  })
}

function makeTable () {
    log ('MakeTable');
    let watts1 = JSON.parse(getState(SolarJSON1).val);
    let watts2 = JSON.parse(getState(SolarJSON2).val);
    log ('Items: '+watts1.length);
    let today = formatDate(new Date(), 'YYYY-MM-DD');
    let table = [];
    let graphTimeData = [];

    for(var n=0;n<watts1.length;n++) {
            let entry = {};
            let graphEntry ={};
            let thisTime = watts1[n].Uhrzeit;
            log (thisTime);
            entry.Uhrzeit = watts1[n].Uhrzeit;
            entry.Leistung1 = watts1[n].Leistung;
            entry.Leistung2 = watts2[n].Leistung;
            entry.Summe = watts1[n].Leistung + watts2[n].Leistung;
            table.push(entry);
            graphEntry.t = Date.parse(thisTime);
            graphEntry.y = watts1[n].Leistung + watts2[n].Leistung;
            graphTimeData.push(graphEntry);
    }

    var graph = {};
    var graphAllData = [];
    var graphData = {"datalabel_rotation":-90,"datalabel_color":"lightgreen","datalabel_fontSize":10};
    graphData.data = graphTimeData;
    graphAllData.push(graphData);
    graph.graphs=graphAllData;
    setState(SolarJSONTable, JSON.stringify(table), true);
    setState(SolarJSONGraph, JSON.stringify(graph), true);
}

function getSolar() {
  Promise.all(promises)
  .then(function(bodys) {
    console.log("All url loaded");
    makeTable();
  })
}
ioBroker (since 2018) auf Intel Core i3-5005U NUC und Windwos10 Pro
-
@gargano sagte in Forecast.solar mit dem Systeminfo Adapter:
Lösch mal die Zeile
var graphData = {};OK, damit ist der Fehler aus Zeile 121 weg - ein fehler in Zeile 90 bleibt noch. Liegt bestimmt auch an meinen Drag & Drop "Künsten" ;)
Im übrigen gibt es keine "makeResponse" - das hat mich sowieso gewundert.
const SolarJSON1 = "javascript.0.SolarForecast.JSON1"; const SolarJSON2 = "javascript.0.SolarForecast.JSON2"; const SolarJSONAll1 = "javascript.0.SolarForecast.JSONAll1"; const SolarJSONAll2 = "javascript.0.SolarForecast.JSONAll2"; const SolarJSONGraphAll1 = "javascript.0.SolarForecast.JSONGraphAll1"; const SolarJSONGraphAll2 = "javascript.0.SolarForecast.JSONGraphAll2"; const SolarJSONTable = "javascript.0.SolarForecast.JSONTable"; const SolarJSONGraph = "javascript.0.SolarForecast.JSONGraph"; const creatStateList = [ {name :SolarJSON1, type:"string", role : "value"}, {name :SolarJSON2, type:"string", role : "value"}, {name :SolarJSONAll1, type:"string", role : "value"}, {name :SolarJSONAll2, type:"string", role : "value"}, {name :SolarJSONGraphAll1, type:"string", role : "value"}, {name :SolarJSONGraphAll2, type:"string", role : "value"}, {name :SolarJSONTable, type:"string", role : "value"}, {name :SolarJSONGraph, type:"string", role : "value"} ] creatStateList.forEach (function(item) { createState(item.name, { type: item.type, min: 0, def: 0, role: item.role }); }); var request = require('request'); var options1 = {url: 'https://api.forecast.solar/estimate/xx.35/xx.24/40/90/7.26', method: 'GET', headers: { 'User-Agent': 'request' }}; var options2 = {url: 'https://api.forecast.solar/estimate/xx.35/xx.24/40/-90/2.64', method: 'GET', headers: { 'User-Agent': 'request' }}; var urls = [ {myUrl:options1,mySolarJSON:SolarJSON1,mySolarJSONAll:SolarJSONAll1,mySolarJSONGraphAll:SolarJSONGraphAll1}, {myUrl:options2,mySolarJSON:SolarJSON2,mySolarJSONAll:SolarJSONAll2,mySolarJSONGraphAll:SolarJSONGraphAll2} ] var promises = urls.map(myAsyncRequest); schedule('6 6-22 * * *', getSolar); getSolar(); function myAsyncRequest(myUrl) { log('Request '+myUrl.myUrl.url); return new Promise((resolve, reject) => { request(myUrl.myUrl.url, function(error, response, body) { if (!error && response.statusCode == 200) { let today = formatDate(new Date(), 'YYYY-MM-DD'); let watts = JSON.parse(body).result.watts; setState(myUrl.mySolarJSONAll, JSON.stringify(watts), true); let table = []; for(let time in watts) { let pos = time.indexOf(':00:00'); if(pos != -1) { let entry = {}; entry.Uhrzeit = time; entry.Leistung = watts[time]; table.push(entry); } } log ('JSON: '+myUrl.mySolarJSON); setState(myUrl.mySolarJSON, JSON.stringify(table), true); // make GraphTable let graphTimeData = []; for(let time in watts) { let pos1 = time.indexOf(':00:00'); let pos2 = time.indexOf(':30:00'); if((pos1 != -1) || (pos2 != -1)) { let graphEntry ={}; graphEntry.t = Date.parse(time); graphEntry.y = watts[time]; graphTimeData.push(graphEntry); } var graph = {}; var graphData ={}; var graphAllData = []; graphData.data = graphTimeData; graphAllData.push(graphData); graph.graphs=graphAllData; setState(myUrl.mySolarJSONGraphAll, JSON.stringify(graph), true); resolve (body); } }); }) } function makeTable () { log ('MakeTable'); let watts1 = JSON.parse(getState(SolarJSON1).val); let watts2 = JSON.parse(getState(SolarJSON2).val); log ('Items: '+watts1.length); let today = formatDate(new Date(), 'YYYY-MM-DD'); let table = []; let graphTimeData = []; for(var n=0;n<watts1.length;n++) { let entry = {}; let graphEntry ={}; let thisTime = watts1[n].Uhrzeit; log (thisTime); entry.Uhrzeit = watts1[n].Uhrzeit; entry.Leistung1 = watts1[n].Leistung; entry.Leistung2 = watts2[n].Leistung; entry.Summe = watts1[n].Leistung + watts2[n].Leistung; table.push(entry); graphEntry.t = Date.parse(thisTime); graphEntry.y = watts1[n].Leistung + watts2[n].Leistung; graphTimeData.push(graphEntry); } var graph = {}; var graphAllData = []; var graphData = {"datalabel_rotation":-90,"datalabel_color":"lightgreen","datalabel_fontSize":10}; graphData.data = graphTimeData; graphAllData.push(graphData); graph.graphs=graphAllData; setState(SolarJSONTable, JSON.stringify(table), true); setState(SolarJSONGraph, JSON.stringify(graph), true); } function getSolar() { Promise.all(promises) .then(function(bodys) { console.log("All url loaded"); makeTable(); }) }@jb_sullivan Da fehlt noch eine Klammer:
for(let time in watts) { let pos1 = time.indexOf(':00:00'); let pos2 = time.indexOf(':30:00'); if((pos1 != -1) || (pos2 != -1)) { let graphEntry ={}; graphEntry.t = Date.parse(time); graphEntry.y = watts[time]; graphTimeData.push(graphEntry); } // -< die fehlt } -
@jb_sullivan Da fehlt noch eine Klammer:
for(let time in watts) { let pos1 = time.indexOf(':00:00'); let pos2 = time.indexOf(':30:00'); if((pos1 != -1) || (pos2 != -1)) { let graphEntry ={}; graphEntry.t = Date.parse(time); graphEntry.y = watts[time]; graphTimeData.push(graphEntry); } // -< die fehlt }@gargano Jupp - Fehler ist weg und in den Einzelgraphen wird auch die :30 gesetzt. Allerdings fehlt dieser Zeitraum dann in den Additiations Tabellen.
jsonGraph & jsonTable
ioBroker (since 2018) auf Intel Core i3-5005U NUC und Windwos10 Pro
-
@gargano Jupp - Fehler ist weg und in den Einzelgraphen wird auch die :30 gesetzt. Allerdings fehlt dieser Zeitraum dann in den Additiations Tabellen.
jsonGraph & jsonTable
@jb_sullivan Weiter oben Zeile 57 mußt Du noch das Gleiche machen
                let pos = time.indexOf(':00:00');
                if(pos != -1) {
ändern in
                let pos1 = time.indexOf(':00:00');
                 let pos2 = time.indexOf(':30:00');
                if((pos1 != -1) || (pos2 != -1)){
Bei den Einzelgraphen brauchst Du eigentlich keine Abfrage der Zeit, da diese nur für die Synchronisation der Summenbildung benötigt wird. Zeile 72..74 kann entfallen, nicht vergessen wieder die Klammer unten zu entfernen.
-
@jb_sullivan Weiter oben Zeile 57 mußt Du noch das Gleiche machen
                let pos = time.indexOf(':00:00');
                if(pos != -1) {
ändern in
                let pos1 = time.indexOf(':00:00');
                 let pos2 = time.indexOf(':30:00');
                if((pos1 != -1) || (pos2 != -1)){
Bei den Einzelgraphen brauchst Du eigentlich keine Abfrage der Zeit, da diese nur für die Synchronisation der Summenbildung benötigt wird. Zeile 72..74 kann entfallen, nicht vergessen wieder die Klammer unten zu entfernen.
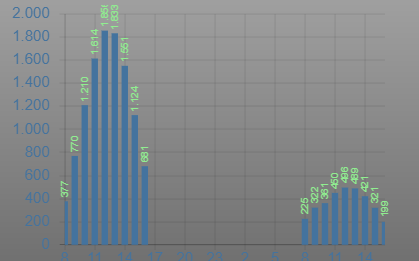
Auch das funktioniert jetzt
 - das wird ja immer perfekter ;)
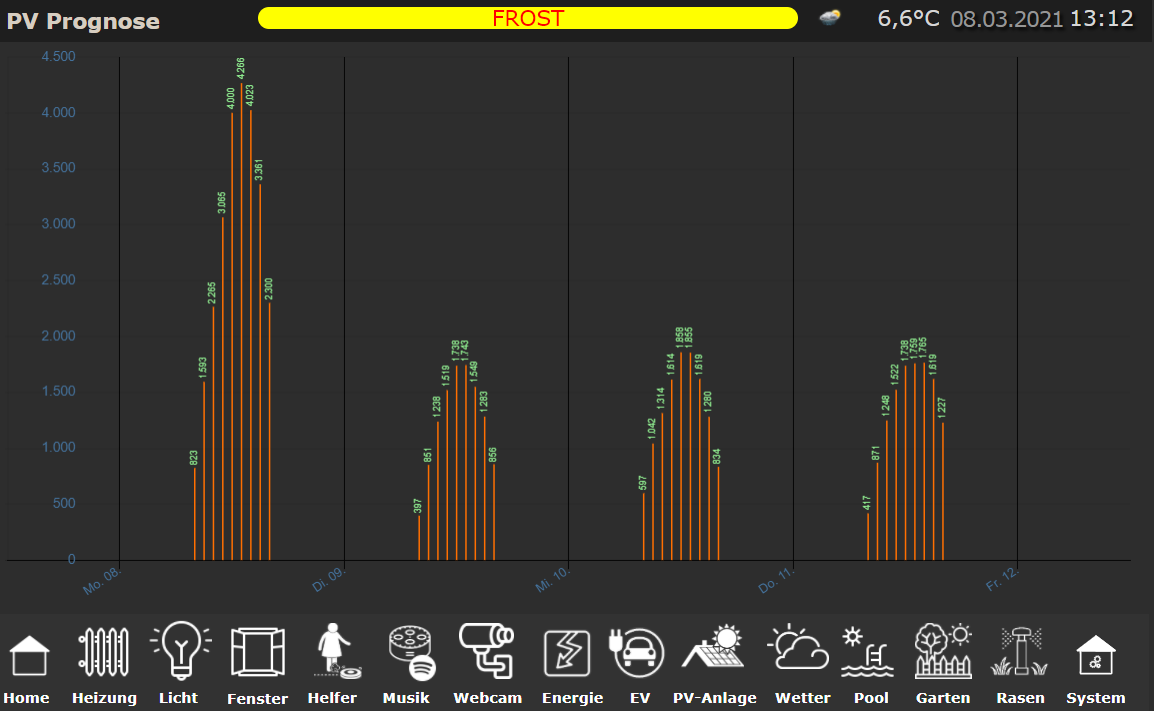
Jetzt stellt sich mir nur noch eine Frage - in den Nachstunden wird es ja nachweislich nie zu PV Produktion kommen. Im Diagramm belegen diese Zeiten aber unnötigen Leerraum, was wiederum verhindert, das die Balken breiter und somit die Texte übersichtlicher daher kommen können.
Kann man den ganzen Zeitbereich der Darstellung (Ausgabe) evtl. noch irgendwie eingrenzen, sodaß die Tage nur von 6:00 - 21:30 dargestellt werden?

ioBroker (since 2018) auf Intel Core i3-5005U NUC und Windwos10 Pro
Hey! Du scheinst an dieser Unterhaltung interessiert zu sein, hast aber noch kein Konto.
Hast du es satt, bei jedem Besuch durch die gleichen Beiträge zu scrollen? Wenn du dich für ein Konto anmeldest, kommst du immer genau dorthin zurück, wo du zuvor warst, und kannst dich über neue Antworten benachrichtigen lassen (entweder per E-Mail oder Push-Benachrichtigung). Du kannst auch Lesezeichen speichern und Beiträge positiv bewerten, um anderen Community-Mitgliedern deine Wertschätzung zu zeigen.
Mit deinem Input könnte dieser Beitrag noch besser werden 💗
Registrieren Anmelden406
Online33.0k
Benutzer83.5k
Themen1.3m
Beiträge