Pi neu aufsetzen, was mitnehmen?
-
Hallo,
ich habe mich in den letzten Monaten in den Raspberry Pi3B und ioBroker eingearbeitet.
Es war mein erstes System dieser Art und auch das erste mal dass ich so etwas programmiert habe.
Nun habe ich ein System in dem ich mir viele meiner gewünschten Funktionen (mit viel von eurer Hilfe) realisiert habe.
Ich möchte die Funktionen (und am besten auch Einstellungen) gerne behalten.
Das System läuft aber ziemlich unrund. Einige Adapter starten unerwartet neu oder steigen aus, die PIDs der Adapter steigen nach 1-2h bereits auf über 20.000.
Die Load15 liegt stellenweise bei 60 :roll:
Sicherlich habe ich bei der Ersteinrichtung oder der Installation iwo Änfängerfehler gemacht.
Auch das Auslagern von SD auf einen USB Stick hat nicht geholfen.
Daher möchte ich das System neu aufsetzen.
Natürlich so fehlerfrei wie möglich.
Aber, ich möchte natürlich auch gerne meine Skripte und Views mitnehmen.
Die Skripte werde ich dann vorsichtig nach und nach einspielen und schauen ob dort vielleicht iwo ein Bock drin war.
Die Views ebenfalls. Die kann ich ja einzeln importieren.
Aber bei einigen Adaptern gibt es ja auch manche Einstellungen die nicht ganz ohne sind.
Ich denke da an den Alexa2.0 oder den FireTV Adapter, welche beide etwas "fummelig" zu installieren sind.
Was kann ich also sinnvollerweise mitnehmen?
Wie sollte ich vrogehen um ein optimales System zu erhalten? (Abgesehen vom Kauf eines NUC o.ä. :mrgreen: , ich möchte bei dem Pi bleiben.)
-
Es wäre ggf. sinnvoll, vor einer Neuinstallation die Ursachen für den ungeplanten Neustart von Adaptern und die hohe CPU-Last zu finden.
Wenn Du das auch so siehst, untersuche doch z.B. mit top htop, welcher Prozess für die hohe CPU-Nutzung verantwortlich ist.
Eventuell steht etwas im Log von ioBroker oder im systemlog, das auf Fehler bei den Adaptern hinweist.
-
Die CPU Last ist ja nicht sehr hoch. Sie geht nur selten auf über 90%.
Mit top habe ich das System schonmal eine halbe Stunde beobachtet.
Im Log finde ich keine Hinweise die mir helfen.
Ich lade später mal ein log hoch.
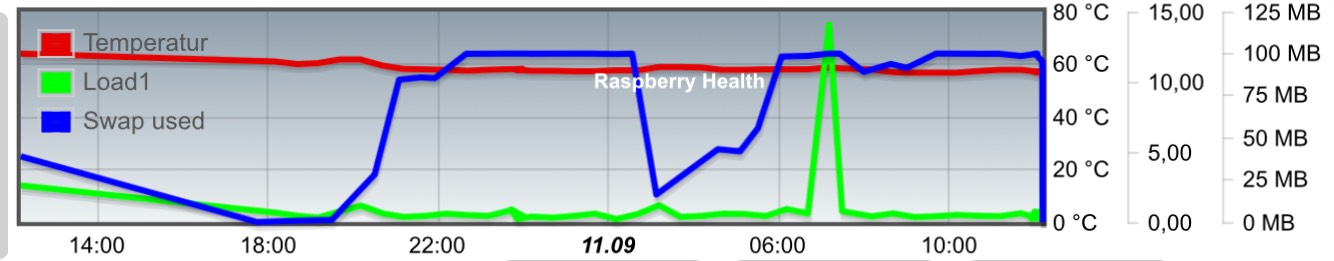
In meinem FLOT zu Pi temperatur, Load1 und Swap used sieht man dass fast durchgehend 100MB swap genutzt werden.
(CPU Last habe ich leider nicht geloggt)
Habe mal ein FLOT angehängt. um 7:00 wo der Load hochgeht war niemand zuhause oder hat den Pi/ioBroker bedient.
Er hatte ebenfalls keine besonderen Aufgaben zu dieser Zeit.
Um 3:00 macht er ein Backup, da ging der swap runter.
-
Was mir bei dir auffällt ist das deine Temperatur sehr hoch ist. Immer um die 60°C bei mir ist sie um die 30 - 35°C egal wie ausgelastet das System ist. Das ist auch nicht gerade gesund für den Pi auf die Dauer. Meiner ist in einem Gehäuse ohne zusätzlicher Kühlung.
-
Die 60°C habe ich von Anfang an.
Der Pi steckt in dem klassischen Weiß/Himbeer-Gehäuse mit aufgeklebten Passivkühlern.
Aber auch wenn ich das Gehäuse wegnehme bleibt es bei ~58°C
Ich hänge mal ein Log von gestern an. <u>(Host Version 1.4.3)</u>
Der Auszug ist immer kurz vor dem Absturz.
Die letzten beiden gezeigten Zeilen sind dann nach dem reboot entstanden.
!
2018-09-11 17:16:02.756 - [32minfo[39m: upnp.0 Found new device: "http://192.168.0.6:8083/description.xml" 2018-09-11 17:17:43.187 - [32minfo[39m: upnp.0 Found new device: "http://192.168.0.200:49000/MediaServerDevDesc.xml" 2018-09-11 17:17:43.203 - [32minfo[39m: upnp.0 Found new device: "http://192.168.0.200:49000/MediaServerDevDesc.xml" 2018-09-11 17:17:43.210 - [32minfo[39m: upnp.0 Found new device: "http://192.168.0.200:49000/MediaServerDevDesc.xml" 2018-09-11 17:17:43.217 - [32minfo[39m: upnp.0 Found new device: "http://192.168.0.200:49000/MediaServerDevDesc.xml" 2018-09-11 17:17:43.224 - [32minfo[39m: upnp.0 Found new device: "http://192.168.0.200:49000/MediaServerDevDesc.xml" 2018-09-11 17:17:43.234 - [32minfo[39m: upnp.0 Found new device: "http://192.168.0.200:49000/MediaServerDevDesc.xml" 2018-09-11 17:17:43.354 - [32minfo[39m: upnp.0 Found new device: "http://192.168.0.200:49000/MediaServerDevDesc.xml" 2018-09-11 17:19:13.890 - [34mdebug[39m: fritzdect.0 polling! fritzdect is alive 2018-09-11 17:19:14.249 - [34mdebug[39m: fritzdect.0 devices ! 2018-09-11 17:19:14.250 - [34mdebug[39m: fritzdect.0 [{"identifier":"087610393788","id":"16","functionbitmask":"2944","fwversion":"03.87","manufacturer":"AVM","productname":"FRITZ!DECT 200","present":"0","name":"FRITZ!DECT 200 #1","switch":{"state":"","mode":"","lock":"","devicelock":""},"powermeter":{"power":"","energy":""},"temperature":{"celsius":"","offset":""}}] 2018-09-11 17:19:14.250 - [34mdebug[39m: fritzdect.0 update Devices 1 2018-09-11 17:19:14.250 - [34mdebug[39m: fritzdect.0 updating Switch FRITZ!DECT 200 #1 2018-09-11 17:19:14.250 - [34mdebug[39m: fritzdect.0 DECT200_087610393788 : name : FRITZ!DECT 200 #1 2018-09-11 17:19:14.251 - [34mdebug[39m: fritzdect.0 DECT200_087610393788 : present : 0 2018-09-11 17:19:14.251 - [34mdebug[39m: fritzdect.0 DECT200_087610393788 : state : 2018-09-11 17:19:14.251 - [34mdebug[39m: fritzdect.0 DECT200_087610393788 : power :NaN 2018-09-11 17:19:14.252 - [34mdebug[39m: fritzdect.0 DECT200_087610393788 : energy : 2018-09-11 17:19:14.252 - [34mdebug[39m: fritzdect.0 DECT200_087610393788 : mode : 2018-09-11 17:19:14.253 - [34mdebug[39m: fritzdect.0 DECT200_087610393788 : lock : 2018-09-11 17:19:14.253 - [34mdebug[39m: fritzdect.0 DECT200_087610393788 : devicelock : 2018-09-11 17:19:14.253 - [34mdebug[39m: fritzdect.0 DECT200_087610393788 : temp : NaN 2018-09-11 17:19:14.260 - [34mdebug[39m: fritzdect.0 redis pmessage io.fritzdect.0.* io.fritzdect.0.DECT200_087610393788.name {"val":"FRITZ!DECT 200 #1","ack":true,"ts":1536679154255,"q":0,"from":"system.adapter.fritzdect.0","lc":1533118952238} 2018-09-11 17:19:14.261 - [34mdebug[39m: fritzdect.0 redis pmessage io.fritzdect.0.* io.fritzdect.0.DECT200_087610393788.present {"val":"0","ack":true,"ts":1536679154255,"q":0,"from":"system.adapter.fritzdect.0","lc":1536050874685} 2018-09-11 17:19:14.262 - [34mdebug[39m: fritzdect.0 redis pmessage io.fritzdect.0.* io.fritzdect.0.DECT200_087610393788.state {"val":"","ack":true,"ts":1536679154256,"q":0,"from":"system.adapter.fritzdect.0","lc":1536050874687} 2018-09-11 17:19:14.262 - [34mdebug[39m: fritzdect.0 redis pmessage io.fritzdect.0.* io.fritzdect.0.DECT200_087610393788.power {"val":null,"ack":true,"ts":1536679154256,"q":0,"from":"system.adapter.fritzdect.0","lc":1536679154256} 2018-09-11 17:19:14.263 - [34mdebug[39m: fritzdect.0 redis pmessage io.fritzdect.0.* io.fritzdect.0.DECT200_087610393788.energy {"val":"","ack":true,"ts":1536679154257,"q":0,"from":"system.adapter.fritzdect.0","lc":1536050874689} 2018-09-11 17:19:14.263 - [34mdebug[39m: fritzdect.0 redis pmessage io.fritzdect.0.* io.fritzdect.0.DECT200_087610393788.mode {"val":"","ack":true,"ts":1536679154257,"q":0,"from":"system.adapter.fritzdect.0","lc":1536050874691} 2018-09-11 17:19:14.264 - [34mdebug[39m: fritzdect.0 redis pmessage io.fritzdect.0.* io.fritzdect.0.DECT200_087610393788.lock {"val":"","ack":true,"ts":1536679154258,"q":0,"from":"system.adapter.fritzdect.0","lc":1536050874692} 2018-09-11 17:19:14.264 - [34mdebug[39m: fritzdect.0 redis pmessage io.fritzdect.0.* io.fritzdect.0.DECT200_087610393788.devicelock {"val":"","ack":true,"ts":1536679154258,"q":0,"from":"system.adapter.fritzdect.0","lc":1536050874693} 2018-09-11 17:19:14.265 - [34mdebug[39m: fritzdect.0 redis pmessage io.fritzdect.0.* io.fritzdect.0.DECT200_087610393788.temp {"val":null,"ack":true,"ts":1536679154259,"q":0,"from":"system.adapter.fritzdect.0","lc":1536679154259} 2018-09-11 17:19:14.265 - [34mdebug[39m: fritzdect.0 stateChange fritzdect.0.DECT200_087610393788.name {"val":"FRITZ!DECT 200 #1","ack":true,"ts":1536679154255,"q":0,"from":"system.adapter.fritzdect.0","lc":1533118952238} 2018-09-11 17:19:14.265 - [34mdebug[39m: fritzdect.0 stateChange fritzdect.0.DECT200_087610393788.present {"val":"0","ack":true,"ts":1536679154255,"q":0,"from":"system.adapter.fritzdect.0","lc":1536050874685} 2018-09-11 17:19:14.266 - [34mdebug[39m: fritzdect.0 stateChange fritzdect.0.DECT200_087610393788.state {"val":"","ack":true,"ts":1536679154256,"q":0,"from":"system.adapter.fritzdect.0","lc":1536050874687} 2018-09-11 17:19:14.266 - [34mdebug[39m: fritzdect.0 stateChange fritzdect.0.DECT200_087610393788.power {"val":null,"ack":true,"ts":1536679154256,"q":0,"from":"system.adapter.fritzdect.0","lc":1536679154256} 2018-09-11 17:19:14.266 - [34mdebug[39m: fritzdect.0 stateChange fritzdect.0.DECT200_087610393788.energy {"val":"","ack":true,"ts":1536679154257,"q":0,"from":"system.adapter.fritzdect.0","lc":1536050874689} 2018-09-11 17:19:14.266 - [34mdebug[39m: fritzdect.0 stateChange fritzdect.0.DECT200_087610393788.mode {"val":"","ack":true,"ts":1536679154257,"q":0,"from":"system.adapter.fritzdect.0","lc":1536050874691} 2018-09-11 17:19:14.267 - [34mdebug[39m: fritzdect.0 stateChange fritzdect.0.DECT200_087610393788.lock {"val":"","ack":true,"ts":1536679154258,"q":0,"from":"system.adapter.fritzdect.0","lc":1536050874692} 2018-09-11 17:19:14.267 - [34mdebug[39m: fritzdect.0 stateChange fritzdect.0.DECT200_087610393788.devicelock {"val":"","ack":true,"ts":1536679154258,"q":0,"from":"system.adapter.fritzdect.0","lc":1536050874693} 2018-09-11 17:19:14.267 - [34mdebug[39m: fritzdect.0 stateChange fritzdect.0.DECT200_087610393788.temp {"val":null,"ack":true,"ts":1536679154259,"q":0,"from":"system.adapter.fritzdect.0","lc":1536679154259} 2018-09-11 17:19:14.573 - [34mdebug[39m: fritzdect.0 groups ! 2018-09-11 17:19:14.573 - [34mdebug[39m: fritzdect.0 [] 2018-09-11 17:19:16.755 - [34mdebug[39m: fritzdect.0 Guest WLAN: {"apply":"","active":false,"SSID":"Nahasapimapetilon","active_24":false,"SSID_24":"Nahasapimapetilon","active_5":false,"SSID_5":"5Nahasapimapetilon","hidden_ssid":true,"sid":"60549dd66b16b410","RedirAddMac":"1"} 2018-09-11 17:19:31.992 - [32minfo[39m: upnp.0 Found new device: "http://192.168.0.6:XXXX/description.xml" 2018-09-11 17:22:58.557 - [32minfo[39m: upnp.0 Found new device: "http://192.168.0.6:XXXX/description.xml" 2018-09-11 17:24:13.900 - [34mdebug[39m: fritzdect.0 polling! fritzdect is alive 2018-09-11 17:24:14.262 - [34mdebug[39m: fritzdect.0 devices ! 2018-09-11 17:24:14.263 - [34mdebug[39m: fritzdect.0 [{"identifier":"087610393788","id":"16","functionbitmask":"2944","fwversion":"03.87","manufacturer":"AVM","productname":"FRITZ!DECT 200","present":"0","name":"FRITZ!DECT 200 #1","switch":{"state":"","mode":"","lock":"","devicelock":""},"powermeter":{"power":"","energy":""},"temperature":{"celsius":"","offset":""}}] 2018-09-11 17:24:14.263 - [34mdebug[39m: fritzdect.0 update Devices 1 2018-09-11 17:24:14.264 - [34mdebug[39m: fritzdect.0 updating Switch FRITZ!DECT 200 #1 2018-09-11 17:24:14.264 - [34mdebug[39m: fritzdect.0 DECT200_087610393788 : name : FRITZ!DECT 200 #1 2018-09-11 17:24:14.264 - [34mdebug[39m: fritzdect.0 DECT200_087610393788 : present : 0 2018-09-11 17:24:14.265 - [34mdebug[39m: fritzdect.0 DECT200_087610393788 : state : 2018-09-11 17:24:14.265 - [34mdebug[39m: fritzdect.0 DECT200_087610393788 : power :NaN 2018-09-11 17:24:14.266 - [34mdebug[39m: fritzdect.0 DECT200_087610393788 : energy : 2018-09-11 17:24:14.266 - [34mdebug[39m: fritzdect.0 DECT200_087610393788 : mode : 2018-09-11 17:24:14.266 - [34mdebug[39m: fritzdect.0 DECT200_087610393788 : lock : 2018-09-11 17:24:14.267 - [34mdebug[39m: fritzdect.0 DECT200_087610393788 : devicelock : 2018-09-11 17:24:14.267 - [34mdebug[39m: fritzdect.0 DECT200_087610393788 : temp : NaN 2018-09-11 17:24:14.281 - [34mdebug[39m: fritzdect.0 redis pmessage io.fritzdect.0.* io.fritzdect.0.DECT200_087610393788.name {"val":"FRITZ!DECT 200 #1","ack":true,"ts":1536679454268,"q":0,"from":"system.adapter.fritzdect.0","lc":1533118952238} 2018-09-11 17:24:14.282 - [34mdebug[39m: fritzdect.0 redis pmessage io.fritzdect.0.* io.fritzdect.0.DECT200_087610393788.present {"val":"0","ack":true,"ts":1536679454269,"q":0,"from":"system.adapter.fritzdect.0","lc":1536050874685} 2018-09-11 17:24:14.283 - [34mdebug[39m: fritzdect.0 redis pmessage io.fritzdect.0.* io.fritzdect.0.DECT200_087610393788.state {"val":"","ack":true,"ts":1536679454270,"q":0,"from":"system.adapter.fritzdect.0","lc":1536050874687} 2018-09-11 17:24:14.283 - [34mdebug[39m: fritzdect.0 redis pmessage io.fritzdect.0.* io.fritzdect.0.DECT200_087610393788.power {"val":null,"ack":true,"ts":1536679454271,"q":0,"from":"system.adapter.fritzdect.0","lc":1536679454271} 2018-09-11 17:24:14.284 - [34mdebug[39m: fritzdect.0 redis pmessage io.fritzdect.0.* io.fritzdect.0.DECT200_087610393788.energy {"val":"","ack":true,"ts":1536679454272,"q":0,"from":"system.adapter.fritzdect.0","lc":1536050874689} 2018-09-11 17:24:14.284 - [34mdebug[39m: fritzdect.0 redis pmessage io.fritzdect.0.* io.fritzdect.0.DECT200_087610393788.mode {"val":"","ack":true,"ts":1536679454273,"q":0,"from":"system.adapter.fritzdect.0","lc":1536050874691} 2018-09-11 17:24:14.285 - [34mdebug[39m: fritzdect.0 redis pmessage io.fritzdect.0.* io.fritzdect.0.DECT200_087610393788.lock {"val":"","ack":true,"ts":1536679454274,"q":0,"from":"system.adapter.fritzdect.0","lc":1536050874692} 2018-09-11 17:24:14.285 - [34mdebug[39m: fritzdect.0 redis pmessage io.fritzdect.0.* io.fritzdect.0.DECT200_087610393788.devicelock {"val":"","ack":true,"ts":1536679454275,"q":0,"from":"system.adapter.fritzdect.0","lc":1536050874693} 2018-09-11 17:24:14.286 - [34mdebug[39m: fritzdect.0 redis pmessage io.fritzdect.0.* io.fritzdect.0.DECT200_087610393788.temp {"val":null,"ack":true,"ts":1536679454276,"q":0,"from":"system.adapter.fritzdect.0","lc":1536679454276} 2018-09-11 17:24:14.286 - [34mdebug[39m: fritzdect.0 stateChange fritzdect.0.DECT200_087610393788.name {"val":"FRITZ!DECT 200 #1","ack":true,"ts":1536679454268,"q":0,"from":"system.adapter.fritzdect.0","lc":1533118952238} 2018-09-11 17:24:14.286 - [34mdebug[39m: fritzdect.0 stateChange fritzdect.0.DECT200_087610393788.present {"val":"0","ack":true,"ts":1536679454269,"q":0,"from":"system.adapter.fritzdect.0","lc":1536050874685} 2018-09-11 17:24:14.287 - [34mdebug[39m: fritzdect.0 stateChange fritzdect.0.DECT200_087610393788.state {"val":"","ack":true,"ts":1536679454270,"q":0,"from":"system.adapter.fritzdect.0","lc":1536050874687} 2018-09-11 17:24:14.287 - [34mdebug[39m: fritzdect.0 stateChange fritzdect.0.DECT200_087610393788.power {"val":null,"ack":true,"ts":1536679454271,"q":0,"from":"system.adapter.fritzdect.0","lc":1536679454271} 2018-09-11 17:24:14.287 - [34mdebug[39m: fritzdect.0 stateChange fritzdect.0.DECT200_087610393788.energy {"val":"","ack":true,"ts":1536679454272,"q":0,"from":"system.adapter.fritzdect.0","lc":1536050874689} 2018-09-11 17:24:14.287 - [34mdebug[39m: fritzdect.0 stateChange fritzdect.0.DECT200_087610393788.mode {"val":"","ack":true,"ts":1536679454273,"q":0,"from":"system.adapter.fritzdect.0","lc":1536050874691} 2018-09-11 17:24:14.288 - [34mdebug[39m: fritzdect.0 stateChange fritzdect.0.DECT200_087610393788.lock {"val":"","ack":true,"ts":1536679454274,"q":0,"from":"system.adapter.fritzdect.0","lc":1536050874692} 2018-09-11 17:24:14.288 - [34mdebug[39m: fritzdect.0 stateChange fritzdect.0.DECT200_087610393788.devicelock {"val":"","ack":true,"ts":1536679454275,"q":0,"from":"system.adapter.fritzdect.0","lc":1536050874693} 2018-09-11 17:24:14.289 - [34mdebug[39m: fritzdect.0 stateChange fritzdect.0.DECT200_087610393788.temp {"val":null,"ack":true,"ts":1536679454276,"q":0,"from":"system.adapter.fritzdect.0","lc":1536679454276} 2018-09-11 17:24:14.587 - [34mdebug[39m: fritzdect.0 groups ! 2018-09-11 17:24:14.587 - [34mdebug[39m: fritzdect.0 [] 2018-09-11 17:24:16.754 - [34mdebug[39m: fritzdect.0 Guest WLAN: {"apply":"","active":false,"SSID":"Nahasapimapetilon","active_24":false,"SSID_24":"Nahasapimapetilon","active_5":false,"SSID_5":"5Nahasapimapetilon","hidden_ssid":true,"sid":"60549dd66b16b410","RedirAddMac":"1"} 2018-09-11 17:26:30.328 - [32minfo[39m: upnp.0 Found new device: "http://192.168.0.6:XXXX/description.xml" 2018-09-11 17:26:46.754 - [33mwarn[39m: host.ioBroker-RasPi instance system.adapter.javascript.0 terminated due to SIGKILL 2018-09-11 17:26:46.762 - [31merror[39m: host.ioBroker-RasPi instance system.adapter.javascript.0 terminated with code null () 2018-09-11 17:26:46.762 - [32minfo[39m: host.ioBroker-RasPi Restart adapter system.adapter.javascript.0 because enabled 2018-09-11 17:27:16.835 - [32minfo[39m: host.ioBroker-RasPi instance system.adapter.javascript.0 started with pid 30825 2018-09-11 17:27:22.655 - [32minfo[39m: javascript.0 States connected to redis: 127.0.0.1:6379 2018-09-11 17:27:22.723 - [32minfo[39m: javascript.0 starting. Version 3.6.4 in /opt/iobroker/node_modules/iobroker.javascript, node: v8.11.4 2018-09-11 17:27:22.748 - [32minfo[39m: javascript.0 requesting all states 2018-09-11 17:27:22.759 - [32minfo[39m: javascript.0 requesting all objects 2018-09-11 17:27:27.393 - [33mwarn[39m: host.ioBroker-RasPi instance system.adapter.upnp.0 terminated due to SIGKILL 2018-09-11 17:27:27.417 - [31merror[39m: host.ioBroker-RasPi instance system.adapter.upnp.0 terminated with code null () 2018-09-11 17:27:27.417 - [32minfo[39m: host.ioBroker-RasPi Restart adapter system.adapter.upnp.0 because enabled 2018-09-11 17:27:27.671 - [32minfo[39m: javascript.0 received all states 2018-09-11 17:27:59.648 - [31merror[39m: hue.0 Timeout for polling light HueBridge.WoZi_E27_Stehlampe_unten 2018-09-11 17:28:11.018 - [33mwarn[39m: harmony.0 lost Harmony 2018-09-11 17:29:45.920 - [31merror[39m: cloud.0 Ping timeout 2018-09-11 17:31:31.841 - [34mdebug[39m: fritzdect.0 polling! fritzdect is alive 2018-09-11 17:17:17.052 - [32minfo[39m: host.ioBroker-RasPi iobroker.js-controller version 1.4.2 js-controller starting 2018-09-11 17:17:17.059 - [32minfo[39m: host.ioBroker-RasPi Copyright (c) 2014-2018 bluefox, 2014 hobbyquaker 2018-09-11 17:17:17.060 - [32minfo[39m: host.ioBroker-RasPi hostname: ioBroker-RasPi, node: v8.11.4 2018-09-11 17:17:17.064 - [32minfo[39m: host.ioBroker-RasPi ip addresses: XXXXXXXXXXXXXXXXXXXXXXXX 2018-09-11 17:17:18.128 - [32minfo[39m: host.ioBroker-RasPi inMem-objects listening on port 9001 2018-09-11 17:17:18.168 - [32minfo[39m: host.ioBroker-RasPi InMemoryDB connected 2018-09-11 17:17:18.234 - [32minfo[39m: host.ioBroker-RasPi 38 instances found 2018-09-11 17:17:18.313 - [32minfo[39m: host.ioBroker-RasPi starting 32 instances 2018-09-11 17:17:18.430 - [32minfo[39m: host.ioBroker-RasPi instance system.adapter.admin.0 started with pid 664 2018-09-11 17:17:18.449 - [32minfo[39m: host.ioBroker-RasPi States connected to redis: 127.0.0.1:6379 2018-09-11 17:17:21.854 - [31merror[39m: host.ioBroker-RasPi instance system.adapter.admin.0 terminated with code 7 (Adapter already running) 2018-09-11 17:17:21.855 - [32minfo[39m: host.ioBroker-RasPi Restart adapter system.adapter.admin.0 because enabled 2018-09-11 17:17:22.344 - [32minfo[39m: host.ioBroker-RasPi instance system.adapter.discovery.0 started with pid 674 2018-09-11 17:17:22.867 - [32minfo[39m: host.ioBroker-RasPi instance system.adapter.admin.0 started with pid 680 2018-09-11 17:17:24.146 - [31merror[39m: host.ioBroker-RasPi instance system.adapter.discovery.0 terminated with code 7 (Adapter already running) 2018-09-11 17:17:24.148 - [32minfo[39m: host.ioBroker-RasPi Restart adapter system.adapter.discovery.0 because enabled 2018-09-11 17:17:25.323 - [32minfo[39m: admin.0 States connected to redis: 127.0.0.1:6379 2018-09-11 17:17:25.508 - [31merror[39m: admin.0 setObject id missing!! 2018-09-11 17:17:25.525 - [32minfo[39m: admin.0 starting. Version 3.5.8 in /opt/iobroker/node_modules/iobroker.admin, node: v8.11.4 2018-09-11 17:17:25.738 - [32minfo[39m: admin.0 Request actual repository... 2018-09-11 17:17:25.745 - [32minfo[39m: admin.0 requesting all states 2018-09-11 17:17:25.748 - [32minfo[39m: admin.0 requesting all objects 2018-09-11 17:17:26.924 - [32minfo[39m: host.ioBroker-RasPi instance system.adapter.web.0 started with pid 695 2018-09-11 17:17:27.079 - [32minfo[39m: host.ioBroker-RasPi Update repository "latest" under "http://download.iobroker.net/sources-dist-latest.json" 2018-09-11 17:17:29.550 - [32minfo[39m: admin.0 received all states 2018-09-11 17:17:29.658 - [31merror[39m: host.ioBroker-RasPi instance system.adapter.web.0 terminated with code 7 (Adapter already running) 2018-09-11 17:17:29.659 - [32minfo[39m: host.ioBroker-RasPi Restart adapter system.adapter.web.0 because enabled 2018-09-11 17:17:29.663 - [32minfo[39m: admin.0 Repository received successfully. 2018-09-11 17:17:30.340 - [32minfo[39m: host.ioBroker-RasPi instance system.adapter.rpi2.0 started with pid 705 2018-09-11 17:17:31.633 - [31merror[39m: host.ioBroker-RasPi instance system.adapter.rpi2.0 terminated with code 7 (Adapter already running) 2018-09-11 17:17:31.633 - [32minfo[39m: host.ioBroker-RasPi Restart adapter system.adapter.rpi2.0 because enabled 2018-09-11 17:17:32.220 - [32minfo[39m: admin.0 received all objects 2018-09-11 17:17:33.004 - [32minfo[39m: admin.0 https server listening on port 8081 2018-09-11 17:17:33.005 - [32minfo[39m: admin.0 Use link "https://localhost:8081" to configure. 2018-09-11 22:10:51.525 - [32minfo[39m: host.ioBroker-RasPi instance system.adapter.socketio.0 started with pid 717 2018-09-11 22:10:53.332 - [32minfo[39m: socketio.0 States connected to redis: 127.0.0.1:6379 !Nachdem ich heute das Update auf den <u>Host 1.5.0</u> gemacht habe, habe ich keinen Webzugriff mehr auf meinen Pi.
Laut top scheint der web Adapter immer wieder neu zu starten.
Der Auszug ist immer kurz vor dem Absturz.
Die letzten beiden gezeigten Zeilen sind dann nach dem reboot entstanden.
! ````
2018-09-12 08:15:24.754 - [31merror[39m: web.1 no connection to objects DB
2018-09-12 08:15:34.726 - [32minfo[39m: host.ioBroker-RasPi instance system.adapter.ical.1 terminated with code 0 (OK)
2018-09-12 08:15:34.735 - [32minfo[39m: host.ioBroker-RasPi instance system.adapter.ical.2 terminated with code 0 (OK)
2018-09-12 08:15:35.565 - [32minfo[39m: host.ioBroker-RasPi instance system.adapter.ping.0 started with pid 19754
2018-09-12 08:15:36.217 - [32minfo[39m: web.1 States connected to redis: 127.0.0.1:6379
2018-09-12 08:15:37.875 - [32minfo[39m: web.1 starting. Version 2.4.1 in /opt/iobroker/node_modules/iobroker.web, node: v8.11.4
2018-09-12 08:15:39.391 - [32minfo[39m: cloud.0 Trying to connect as system.user.admin
2018-09-12 08:15:39.709 - [32minfo[39m: ping.0 States connected to redis: 127.0.0.1:6379
2018-09-12 08:15:40.441 - [32minfo[39m: web.1 Secure socket.io server listening on port 8083
2018-09-12 08:15:40.449 - [32minfo[39m: web.1 https server listening on port 8083
2018-09-12 08:15:42.828 - [32minfo[39m: ping.0 starting. Version 1.3.2 in /opt/iobroker/node_modules/iobroker.ping, node: v8.11.4
2018-09-12 08:15:43.980 - [31merror[39m: cloud.0 Cloud says: timeout
2018-09-12 08:15:44.981 - [32minfo[39m: cloud.0 Connection changed: io server disconnect
2018-09-12 08:15:45.187 - [31merror[39m: uncaught exception: Maximum call stack size exceeded
2018-09-12 08:15:45.190 - [31merror[39m: RangeError: Maximum call stack size exceeded
at new Uint8Array (native)
at new FastBuffer (buffer.js:38:5)
at fromString (buffer.js:318:11)
at Function.Buffer.from (buffer.js:177:12)
at new Buffer (buffer.js:158:17)
at Sender.frameAndSend (/opt/iobroker/node_modules/ws/lib/Sender.js:166:14)
at /opt/iobroker/node_modules/ws/lib/Sender.js:126:12
at Sender.applyExtensions (/opt/iobroker/node_modules/ws/lib/Sender.js:287:5)
at /opt/iobroker/node_modules/ws/lib/Sender.js:120:10
at Sender.flush (/opt/iobroker/node_modules/ws/lib/Sender.js:268:3)
2018-09-12 08:15:45.194 - [32minfo[39m: iobroker restart
2018-09-12 08:15:46.572 - [32minfo[39m: iobroker Starting node restart.js
2018-09-12 08:15:46.577 - [32minfo[39m: iobroker exit 0
2018-09-12 08:15:47.091 - [32minfo[39m: host.ioBroker-RasPi received SIGTERM
2018-09-12 08:15:48.895 - [31merror[39m: upnp.0 uncaught exception: Maximum call stack size exceeded
2018-09-12 08:15:48.896 - [31merror[39m: upnp.0 RangeError: Maximum call stack size exceeded
at tryParse (/opt/iobroker/node_modules/socket.io-parser/index.js:336:12)
at decodeString (/opt/iobroker/node_modules/socket.io-parser/index.js:325:9)
at Decoder.add (/opt/iobroker/node_modules/socket.io-parser/index.js:237:14)
at Manager.ondata (/opt/iobroker/node_modules/socket.io-client/lib/manager.js:322:16)
at Socket. <anonymous>(/opt/iobroker/node_modules/component-bind/index.js:21:15)
at Socket.Emitter.emit (/opt/iobroker/node_modules/engine.io-client/node_modules/component-emitter/index.js:133:20)
at Socket.onPacket (/opt/iobroker/node_modules/engine.io-client/lib/socket.js:451:14)
at WS. <anonymous>(/opt/iobroker/node_modules/engine.io-client/lib/socket.js:268:10)
at WS.Emitter.emit (/opt/iobroker/node_modules/engine.io-client/node_modules/component-emitter/index.js:133:20)
at WS.Transport.onPacket (/opt/iobroker/node_modules/engine.io-client/lib/transport.js:145:8)
at WS.Transport.onData (/opt/iobroker/node_modules/engine.io-client/lib/transport.js:137:8)
at WebSocket.ws.onmessage (/opt/iobroker/node_modules/engine.io-client/lib/transports/websocket.js:146:10)
at WebSocket.onMessage (/opt/iobroker/node_modules/ws/lib/WebSocket.js:442:14)
at emitTwo (events.js:126:13)
at WebSocket.emit (events.js:214:7)
at Receiver.ontext (/opt/iobroker/node_modules/ws/lib/WebSocket.js:841:10)
2018-09-12 08:15:48.905 - [32minfo[39m: upnp.0 Alive and sid states cleared
2018-09-12 08:15:48.905 - [32minfo[39m: upnp.0 cleaned everything up...
2018-09-12 08:15:48.952 - [32minfo[39m: upnp.0 terminating
2018-09-12 08:15:49.017 - [31merror[39m: Caught by controller[0]: RangeError: Maximum call stack size exceeded
2018-09-12 08:15:49.018 - [31merror[39m: Caught by controller[0]: at tryParse (/opt/iobroker/node_modules/socket.io-parser/index.js:336:12)
2018-09-12 08:15:49.019 - [31merror[39m: Caught by controller[0]: at decodeString (/opt/iobroker/node_modules/socket.io-parser/index.js:325:9)
2018-09-12 08:15:49.019 - [31merror[39m: Caught by controller[0]: at Decoder.add (/opt/iobroker/node_modules/socket.io-parser/index.js:237:14)
2018-09-12 08:15:49.019 - [31merror[39m: Caught by controller[0]: at Manager.ondata (/opt/iobroker/node_modules/socket.io-client/lib/manager.js:322:16)
2018-09-12 08:15:49.019 - [31merror[39m: Caught by controller[0]: at Socket. <anonymous>(/opt/iobroker/node_modules/component-bind/index.js:21:15)
2018-09-12 08:15:49.020 - [31merror[39m: Caught by controller[0]: at Socket.Emitter.emit (/opt/iobroker/node_modules/engine.io-client/node_modules/component-emitter/index.js:133:20)
2018-09-12 08:15:49.020 - [31merror[39m: Caught by controller[0]: at Socket.onPacket (/opt/iobroker/node_modules/engine.io-client/lib/socket.js:451:14)
2018-09-12 08:15:49.020 - [31merror[39m: Caught by controller[0]: at WS. <anonymous>(/opt/iobroker/node_modules/engine.io-client/lib/socket.js:268:10)
2018-09-12 08:15:49.020 - [31merror[39m: Caught by controller[0]: at WS.Emitter.emit (/opt/iobroker/node_modules/engine.io-client/node_modules/component-emitter/index.js:133:20)
2018-09-12 08:15:49.020 - [31merror[39m: Caught by controller[0]: at WS.Transport.onPacket (/opt/iobroker/node_modules/engine.io-client/lib/transport.js:145:8)
2018-09-12 08:15:49.021 - [31merror[39m: Caught by controller[0]: at WS.Transport.onData (/opt/iobroker/node_modules/engine.io-client/lib/transport.js:137:8)
2018-09-12 08:15:49.021 - [31merror[39m: Caught by controller[0]: at WebSocket.ws.onmessage (/opt/iobroker/node_modules/engine.io-client/lib/transports/websocket.js:146:10)
2018-09-12 08:15:49.021 - [31merror[39m: Caught by controller[0]: at WebSocket.onMessage (/opt/iobroker/node_modules/ws/lib/WebSocket.js:442:14)
2018-09-12 08:15:49.021 - [31merror[39m: Caught by controller[0]: at emitTwo (events.js:126:13)
2018-09-12 08:15:49.021 - [31merror[39m: Caught by controller[0]: at WebSocket.emit (events.js:214:7)
2018-09-12 08:15:49.021 - [31merror[39m: Caught by controller[0]: at Receiver.ontext (/opt/iobroker/node_modules/ws/lib/WebSocket.js:841:10)
2018-09-12 08:15:49.022 - [32minfo[39m: host.ioBroker-RasPi instance system.adapter.upnp.0 terminated with code 0 (OK)
2018-09-12 08:15:51.050 - [32minfo[39m: host.ioBroker-RasPi Update repository "latest" under "http://download.iobroker.net/sources-dist-latest.json"
2018-09-12 08:15:52.482 - [32minfo[39m: host.ioBroker-RasPi received SIGTERM
2018-09-12 08:15:55.890 - [32minfo[39m: host.ioBroker-RasPi force terminating
2018-09-12 08:15:55.892 - [32minfo[39m: Adapter admin still running
2018-09-12 08:15:55.892 - [32minfo[39m: Adapter discovery still running
2018-09-12 08:15:55.893 - [32minfo[39m: Adapter web still running
2018-09-12 08:15:55.894 - [32minfo[39m: Adapter rpi2 still running
2018-09-12 08:15:55.894 - [32minfo[39m: Adapter socketio still running
2018-09-12 08:15:55.895 - [32minfo[39m: Adapter cloud still running
2018-09-12 08:15:55.895 - [32minfo[39m: Adapter history still running
2018-09-12 08:15:55.896 - [32minfo[39m: Adapter javascript still running
2018-09-12 08:15:55.897 - [32minfo[39m: Adapter tr-064 still running
2018-09-12 08:15:55.897 - [32minfo[39m: Adapter hue still running
2018-09-12 08:15:55.898 - [32minfo[39m: Adapter pushover still running
2018-09-12 08:15:55.898 - [32minfo[39m: Adapter harmony still running
2018-09-12 08:15:55.898 - [32minfo[39m: Adapter sayit still running
2018-09-12 08:15:55.899 - [32minfo[39m: Adapter backitup still running
2018-09-12 08:15:55.899 - [32minfo[39m: Adapter fritzdect still running
2018-09-12 08:15:55.900 - [32minfo[39m: Adapter enigma2 still running
2018-09-12 08:15:55.900 - [32minfo[39m: Adapter alexa2 still running
2018-09-12 08:15:55.901 - [32minfo[39m: Adapter firetv still running
2018-09-12 08:15:55.901 - [32minfo[39m: Adapter web still running
2018-09-12 08:15:55.902 - [32minfo[39m: Adapter ping still running
2018-09-12 08:16:05.201 - [32minfo[39m: host.ioBroker-RasPi iobroker.js-controller version 1.5.0 js-controller starting
2018-09-12 08:16:05.211 - [32minfo[39m: host.ioBroker-RasPi Copyright (c) 2014-2018 bluefox, 2014 hobbyquaker
2018-09-12 08:16:05.212 - [32minfo[39m: host.ioBroker-RasPi hostname: ioBroker-RasPi, node: v8.11.4
2018-09-12 08:16:05.218 - [32minfo[39m: host.ioBroker-RasPi ip addresses: 192.168.0.12 2003:77:2f1c:9000:abdc:5f9:efe4:a99c fe80::27e6:8f1:41aa:e1d0
2018-09-12 08:16:05.969 - [32minfo[39m: host.ioBroker-RasPi inMem-objects listening on port 9001
2018-09-12 08:16:06.001 - [32minfo[39m: host.ioBroker-RasPi InMemoryDB connected
2018-09-12 08:16:06.064 - [32minfo[39m: host.ioBroker-RasPi 37 instances found
2018-09-12 08:16:06.117 - [32minfo[39m: host.ioBroker-RasPi starting 31 instances
2018-09-12 08:16:06.208 - [32minfo[39m: host.ioBroker-RasPi instance system.adapter.admin.0 started with pid 20087
2018-09-12 08:16:06.233 - [32minfo[39m: host.ioBroker-RasPi States connected to redis: 127.0.0.1:6379
2018-09-12 08:16:10.089 - [31merror[39m: host.ioBroker-RasPi instance system.adapter.admin.0 terminated with code 7 (Adapter already running)
2018-09-12 08:16:10.090 - [32minfo[39m: host.ioBroker-RasPi Restart adapter system.adapter.admin.0 because enabled
2018-09-12 08:16:10.136 - [32minfo[39m: host.ioBroker-RasPi instance system.adapter.discovery.0 started with pid 20118
2018-09-12 08:16:11.976 - [32minfo[39m: host.ioBroker-RasPi instance system.adapter.admin.0 started with pid 20124
2018-09-12 08:16:12.357 - [31merror[39m: host.ioBroker-RasPi instance system.adapter.discovery.0 terminated with code 7 (Adapter already running)
2018-09-12 08:16:12.358 - [32minfo[39m: host.ioBroker-RasPi Restart adapter system.adapter.discovery.0 because enabled
2018-09-12 08:16:14.140 - [32minfo[39m: host.ioBroker-RasPi instance system.adapter.web.0 started with pid 20134
2018-09-12 08:16:14.802 - [32minfo[39m: admin.0 States connected to redis: 127.0.0.1:6379
2018-09-12 08:16:14.909 - [32minfo[39m: admin.0 starting. Version 3.5.8 in /opt/iobroker/node_modules/iobroker.admin, node: v8.11.4
2018-09-12 08:16:15.203 - [32minfo[39m: admin.0 Request actual repository...
2018-09-12 08:16:15.221 - [32minfo[39m: admin.0 requesting all states
2018-09-12 08:16:15.224 - [32minfo[39m: admin.0 requesting all objects
2018-09-12 08:16:16.535 - [32minfo[39m: host.ioBroker-RasPi Update repository "latest" under "http://download.iobroker.net/sources-dist-latest.json"
2018-09-12 08:16:17.792 - [32minfo[39m: web.0 States connected to redis: 127.0.0.1:6379
2018-09-12 08:16:18.165 - [32minfo[39m: host.ioBroker-RasPi instance system.adapter.rpi2.0 started with pid 20173
2018-09-12 08:16:18.554 - [32minfo[39m: admin.0 received all states
2018-09-12 08:16:18.701 - [32minfo[39m: admin.0 Repository received successfully.
2018-09-12 08:16:18.881 - [32minfo[39m: web.0 starting. Version 2.4.1 in /opt/iobroker/node_modules/iobroker.web, node: v8.11.4
2018-09-12 08:16:20.019 - [32minfo[39m: web.0 Secure socket.io server listening on port 8082
2018-09-12 08:16:20.026 - [32minfo[39m: web.0 https server listening on port 8082
2018-09-12 08:16:20.147 - [32minfo[39m: rpi2.0 States connected to redis: 127.0.0.1:6379
2018-09-12 08:16:20.220 - [32minfo[39m: rpi2.0 starting. Version 1.0.0 in /opt/iobroker/node_modules/iobroker.rpi2, node: v8.11.4
2018-09-12 08:16:20.877 - [32minfo[39m: admin.0 received all objects
2018-09-12 08:16:20.920 - [33mwarn[39m: admin.0 No repository source configured
2018-09-12 08:16:21.397 - [32minfo[39m: admin.0 https server listening on port 8081
2018-09-12 08:16:21.398 - [32minfo[39m: admin.0 Use link "https://localhost:8081" to configure.
2018-09-12 08:16:22.149 - [32minfo[39m: host.ioBroker-RasPi instance system.adapter.socketio.0 started with pid 20212
2018-09-12 08:16:24.824 - [32minfo[39m: socketio.0 States connected to redis: 127.0.0.1:6379
2018-09-12 08:16:24.888 - [32minfo[39m: socketio.0 starting. Version 2.1.1 in /opt/iobroker/node_modules/iobroker.socketio, node: v8.11.4
2018-09-12 08:16:25.011 - [32minfo[39m: socketio.0 socket.io server listening on port 8084
2018-09-12 08:16:26.170 - [32minfo[39m: host.ioBroker-RasPi instance system.adapter.cloud.0 started with pid 20292
2018-09-12 08:16:26.316 - [32minfo[39m: admin.0 successful connection to socket.io from ::ffff:192.168.0.201
2018-09-12 08:16:29.292 - [32minfo[39m: cloud.0 States connected to redis: 127.0.0.1:6379
2018-09-12 08:16:29.415 - [32minfo[39m: cloud.0 starting. Version 2.6.2 in /opt/iobroker/node_modules/iobroker.cloud, node: v8.11.4
2018-09-12 08:16:29.595 - [32minfo[39m: cloud.0 Connecting with https://iobroker.net:10555 with "alex@fassel.eu_19297530-924b-11e8-9502-d705a21f37fe"
2018-09-12 08:16:31.931 - [32minfo[39m: cloud.0 Trying to connect as system.user.admin
2018-09-12 08:16:32.191 - [32minfo[39m: vis.0 States connected to redis: 127.0.0.1:6379
2018-09-12 08:16:32.287 - [32minfo[39m: vis.0 starting. Version 1.1.7 in /opt/iobroker/node_modules/iobroker.vis, node: v8.11.4
2018-09-12 08:16:32.637 - [32minfo[39m: vis.0 vis license is OK.
2018-09-12 08:16:34.155 - [32minfo[39m: host.ioBroker-RasPi instance system.adapter.history.0 started with pid 20341
2018-09-12 08:16:35.275 - [31merror[39m: cloud.0 Cloud says: timeout
2018-09-12 08:16:35.763 - [32minfo[39m: history.0 States connected to redis: 127.0.0.1:6379
2018-09-12 08:16:35.861 - [32minfo[39m: history.0 starting. Version 1.8.5 in /opt/iobroker/node_modules/iobroker.history, node: v8.11.4
2018-09-12 08:16:35.994 - [32minfo[39m: history.0 enabled logging of rpi2.0.cpu.load1 (Count=1), Alias=false
2018-09-12 08:16:35.995 - [32minfo[39m: history.0 enabled logging of rpi2.0.cpu.load5 (Count=2), Alias=false
2018-09-12 08:16:35.996 - [32minfo[39m: history.0 enabled logging of rpi2.0.cpu.load15 (Count=3), Alias=false
2018-09-12 08:16:35.996 - [32minfo[39m: history.0 enabled logging of rpi2.0.memory.memory_free (Count=4), Alias=false
2018-09-12 08:16:35.997 - [32minfo[39m: history.0 enabled logging of rpi2.0.swap.swap_used (Count=5), Alias=false
2018-09-12 08:16:35.997 - [32minfo[39m: history.0 enabled logging of rpi2.0.temperature.soc_temp (Count=6), Alias=false
2018-09-12 08:16:35.998 - [32minfo[39m: history.0 enabled logging of javascript.0.Status.Speed-Test.ping (Count=7), Alias=false
2018-09-12 08:16:35.998 - [32minfo[39m: history.0 enabled logging of javascript.0.Status.Speed-Test.download (Count=8), Alias=false
2018-09-12 08:16:35.998 - [32minfo[39m: history.0 enabled logging of javascript.0.Status.Speed-Test.upload (Count=9), Alias=false
2018-09-12 08:16:35.999 - [32minfo[39m: history.0 enabled logging of harmony.0.Harmony.hubConnected (Count=10), Alias=false
2018-09-12 08:16:35.999 - [32minfo[39m: history.0 enabled logging of fritzdect.0.DECT200_087610393788.power (Count=11), Alias=false
2018-09-12 08:16:35.999 - [32minfo[39m: history.0 enabled logging of fritzdect.0.DECT200_087610393788.energy (Count=12), Alias=false
2018-09-12 08:16:36.000 - [32minfo[39m: history.0 enabled logging of upnp.0.InternetGatewayDeviceV2-_FRITZ!Box_7490.WANDevice.WANCommonInterfaceConfig.ByteReceiveRate (Count=13), Alias=false
2018-09-12 08:16:36.000 - [32minfo[39m: history.0 enabled logging of javascript.0.ByteSendRateMBit (Count=14), Alias=false
2018-09-12 08:16:36.000 - [32minfo[39m: history.0 enabled logging of javascript.0.ByteReceiveRateMBit (Count=15), Alias=false
2018-09-12 08:16:36.001 - [32minfo[39m: history.0 enabled logging of javascript.0.nWaschmaschineVerbrauch (Count=16), Alias=false
2018-09-12 08:16:36.001 - [32minfo[39m: history.0 enabled logging of alexa2.0.History.summary (Count=17), Alias=false
2018-09-12 08:16:36.002 - [32minfo[39m: history.0 enabled logging of javascript.0.CPU-Last (Count=18), Alias=false
2018-09-12 08:16:36.002 - [32minfo[39m: history.0 enabled logging of javascript.0.FritzBoxTraffic.TrafficAktuellerMonat (Count=19), Alias=false
2018-09-12 08:16:36.002 - [32minfo[39m: history.0 enabled logging of javascript.0.FritzBoxTraffic.TrafficGestern (Count=20), Alias=false
2018-09-12 08:16:36.003 - [32minfo[39m: history.0 enabled logging of javascript.0.FritzBoxTraffic.TrafficHeute (Count=21), Alias=false
2018-09-12 08:16:36.277 - [32minfo[39m: cloud.0 Connection changed: io server disconnect
2018-09-12 08:16:36.411 - [32minfo[39m: host.ioBroker-RasPi instance system.adapter.vis.0 terminated while should be started once
2018-09-12 21:16:00.783 - [32minfo[39m: socketio.0 States connected to redis: 127.0.0.1:6379
2018-09-12 21:16:00.841 - [32minfo[39m: socketio.0 starting. Version 2.1.1 in /opt/iobroker/node_modules/iobroker.socketio, node: v8.11.4</anonymous></anonymous></anonymous></anonymous>Ich hoffe ich habe jetzt keine sensiblen Daten gespoilt :roll: Bin alles durchgegangen… Da der Pi jetzt sowieso nicht mehr gescheit erreichbar ist (nur über FTP und putty) bleibt mir wohl nichts anderes übrig als neu aufzusetzen!? Oder könnt ihr in den Logs was erkennen? Wie gesagt, mein erstes System, ich werde sicher iwo Fehler gemacht haben... -
Deine CPU-Last ist in der Tat sehr moderat. Interessant wäre noch, wenn der Pi wieder läuft, wieviel Speicher als Available angezeigt wird.
War das was Du gemacht hast, wirklich ein Reboot des Pis? So mit Strom weg?
Kannst Du über Putty nach dem Reboot und starten des ioBrokers bitte den Befehl
iobroker list instancesausführen?
Aus Deinen Logs werde ich noch nicht so richtig schlau. Man sieht, dass cloud.0 immer wieder Timeouts hat. Und upnp kommt auch vor. Wenn der Admin wieder geht, würde ich die beiden vorübergehend ausschalten und schauen, ob da immer noch ungeplante Neustarts passieren.
-
Und meine CPU-Last hast du jetzt wo gesehen? :?
@Stabilostick:War das was Du gemacht hast, wirklich ein Reboot des Pis? So mit Strom weg? `
Ja, habe den Stecker gezogen weil ich dachte er sei komplett abgestürtzt :oops:Hier die Ausgabe von iobroker list instances:
Direkt nach reboot (ohne Stecker ziehen) und automatisch gestartetem iobroker (per cron "@reboot /opt/iobroker/iobroker start")
cloud, upnp und web.1 habe ich vorher noch händisch gestoppt.
! ````
root@ioBroker-RasPi:~# iobroker list instances- system.adapter.admin.0 : admin - enabled, port: 8081, bind: 0.0.0.0 (SSL), run as: admin
- system.adapter.alexa2.0 : alexa2 - enabled
- system.adapter.backitup.0 : backitup - enabled
system.adapter.cloud.0 : cloud - disabled
system.adapter.denon.0 : denon - disabled - system.adapter.discovery.0 : discovery - enabled
- system.adapter.enigma2.0 : enigma2 - enabled
- system.adapter.firetv.0 : firetv - enabled
system.adapter.flot.0 : flot - enabled - system.adapter.fritzdect.0 : fritzdect - enabled
system.adapter.habpanel.0 : habpanel - disabled - system.adapter.harmony.0 : harmony - enabled
- system.adapter.history.0 : history - enabled
- system.adapter.hue.0 : hue - enabled, port: 80
system.adapter.ical.0 : ical - enabled
system.adapter.ical.1 : ical - enabled
system.adapter.ical.2 : ical - enabled
system.adapter.icons-open-icon-library-png.0: icons-open-icon-library-png - enabled - system.adapter.javascript.0 : javascript - enabled
system.adapter.mobile.0 : mobile - disabled - system.adapter.ping.0 : ping - enabled
- system.adapter.pushover.0 : pushover - enabled
- system.adapter.rpi2.0 : rpi2 - enabled
- system.adapter.sayit.0 : sayit - enabled, port: 0
- system.adapter.socketio.0 : socketio - enabled, port: 8084, bind: 0.0.0.0, run as: admin
system.adapter.tr-064.0 : tr-064 - disabled
system.adapter.unifi.0 : unifi - disabled
system.adapter.upnp.0 : upnp - disabled
system.adapter.vis-colorpicker.0 : vis-colorpicker - enabled
system.adapter.vis-fancyswitch.0 : vis-fancyswitch - enabled
system.adapter.vis-history.0 : vis-history - enabled
system.adapter.vis-hqwidgets.0 : vis-hqwidgets - enabled
system.adapter.vis-jqui-mfd.0 : vis-jqui-mfd - enabled
system.adapter.vis-timeandweather.0 : vis-timeandweather - enabled
system.adapter.vis.0 : vis - enabled - system.adapter.web.0 : web - enabled, port: 8082, bind: 0.0.0.0 (SSL), run as: admin
system.adapter.web.1 : web - disabled, port: 8083, bind: 192.168.0.12 (SSL), run as: admin
! + instance is alive
! ````Die Systemdaten aus dem top sehen so aus:
Was hier was ist, erschließt sich mir noch nicht ganz. Geht es hier nur um RAM?
top - 10:06:19 up 30 min, 1 user, load average: 0,32, 0,39, 0,42 Tasks: 117 total, 1 running, 73 sleeping, 0 stopped, 0 zombie %Cpu(s): 0,8 us, 1,1 sy, 0,0 ni, 98,1 id, 0,0 wa, 0,0 hi, 0,1 si, 0,0 st KiB Mem : 949444 total, 290296 free, 480596 used, 178552 buff/cache KiB Swap: 102396 total, 102396 free, 0 used. 404620 avail Mem -
CPU-Last: ich gehe davon aus, das die y-Skalierung von load in Deinem Diagramm 0-15 ist. Beim Pi hast Du z.B. zwei Cores. Dann ist eine Dauerlast (load) von 2 ok. Dein load-Wert ist kleiner als 2.
Load1 ist eine über eine Minute gemittelte CPU-Auslastungskennzahl.
-
CPU-Last: ich gehe davon aus, das die y-Skalierung von load in Deinem Diagramm 0-15 ist. `
Korrekt.Dein load-Wert ist kleiner als 2. `
Die meiste Zeit ja.Wenn der Pi abstürzte oder hing, gin die Load1 und auch die Load15 schonmal bis auf 60 oder 70.
Aber die Load ist ja, wie ich gelsen habe, nicht gleich CPU-Last, sonder die Gesamtlast des Systems. Inkl. SD und Speicher.
Deshalb bin ich den Schritt gegangen und habe alles von der SD auf den USB Stick ausgelagert.
Vielleicht hatte ja die SD einen weg. Dem war scheinbar nicht so.
Ich habe hier aus dem Forum noch ein Skript installiert welches die reale Last des CPU ausliest.
In dem FLOT oben ist der Wert hierfür aber noch nicht enthalten.
Und wenn ich ihn jetzt mit logge bringt es mich auch nicht weiter…
-
In der neuen Version 1.5.0 des js-controllers sind neue CPU-Counter unter Objekte system.host.* und für neuinstallierte Adapterinstanzen unter system.<adapter>.* enthalten. Dann kannst Du das direkt nachverfolgen bzw. historisieren, welcher Adapter dafür verantwortlich ist.</adapter>
-
Ok, das klingt nach nem Hilfsmittel was mir wirklich weiterhilft.
Dann mache ich mich am WE an das neu aufsetzen.
Ich nehme einfach erst mal gar nichts mit und gucke wie das frische System läuft.
Dann kann ich immer noch schritt für Schritt meine Scripte oder views importieren.
Danke dir für die Hilfe.
-
Ein paar Fragen habe ich aber noch: :mrgreen:
Da ich das bit für das USB boot im Pi gesetzt habe, kann ich ja jetzt nur noch vom USB Stick booten.
Bisher habe ich das fertige image mit Raspbian und iobroker auf die SD geflasht.
Jetzt würde ich dann aber Schritt für Schritt Raspbian und anschließend ioBroker installieren wollen.
Nach http://www.iobroker.net/docu/?page_id=5106&lang=de.
Kann ich dann einfach gedanklich ie SD Karte aus der Anleitung durch meinen USB Stick ersetzen oder muss ich was beachten?
-
In meinem FLOT zu Pi temperatur, Load1 und Swap used sieht man dass fast durchgehend 100MB swap genutzt werden. `
Ich habe auf meinem Pi mittlerweile Swap komplett deaktiviert https://www.elektronik-kompendium.de/si … 002131.htmUnter Linux wird massiv vorbeugend ausgelagert. Das hat mich bereits 2 SD-Karten gekostet.
Ein schlechtes Systemverhalten kann auch durch eine defekte SD-Karte verursacht werden: Schreib- und Lesefehler im Swapbereich können Programme und Daten zerstören und damit ist dann alles möglich.
Deine Perfomance-Werte sind nur sehr schwer zu beurteilen. Ohne Kenntnis über die installierten Adapter und Programme sowie Zeitpläne geht da nichts.
-
Ich habe die Probleme ja wie gesagt auch ohne SD Karte, also beim reinen USB Betrieb.
Morgen werde ich den Pi mal komplett neu aufsetzen.
Zwischendurch immer mal wieder top/htop aufrufen und gucken ob es irgendwann wieder merkwürdig wird.
Starte dann erst mal ohne meine Skripte und views.
Und nur mit den nötigsten Adaptern.
-
Wenn Du die Version 1.5 nutzten möchtest, dann lasse SSL für den Web-Adapter vorübergehend aus. Mit SSL gibt es unter 1.5 noch ein Problem. Wird aber gerade gefixed.
-
Ok.
Danke für den Tipp!
Gesendet per Tapatalk @
-
So,
beim Starten mit dem neu aufsetzen habe ich direkt ein paar Fehler bemerkt die ich beim letzten Mal gemacht haben muss.
1. Ich habe ein Raspbian Stretch image genutzt, kein light. Mag vielleicht kein gravierendes Problem sein, aber ist ja schonmal unnötig und hat vielleicht Leistung gekostet!?
2. Ich hatte den npm 4 irgendwann mal wieder zu einem 5er geupgradet. Obwohl dieser ja bekanntlich Probleme macht.
Aber ich meine dass manche Adapter eine npm >5 vorausgesetzt haben. Ohne Grund habe ich das ja nicht gemacht. Gibt es mittlerweile npm Verisionen >5 die mit dem ioBroker laufen?
Eine Frage habe ich noch:
Sollte ich vielleicht lieber den Verwahrungsort auf stable/default belassen?
Bei der ersten Installation habe ich latest genutzt.
-
Kurzer Zwischenstand:
Installation Raspberry und ioBroker problemlos.
Pi läuft bisher wunderbar.
Habe die nötigsten Adapter installiert um das System jetzt zu diagnostizieren.
Bisher steht mein Verwahrungsort noch auf stable/default.
Werde ich erst mal so belassen…
Ausgabe "iobroker list instances"
!
system.adapter.admin.0 : admin - enabled, port: 8081, bind: 0.0.0.0, run as: admin system.adapter.discovery.0 : discovery - enabled system.adapter.flot.0 : flot - enabled system.adapter.history.0 : history - enabled system.adapter.hue.0 : hue - enabled, port: 80 system.adapter.javascript.0 : javascript - enabled system.adapter.ping.0 : ping - enabled system.adapter.rpi2.0 : rpi2 - enabled system.adapter.tr-064.0 : tr-064 - enabled system.adapter.web.0 : web - enabled, port: 8083, bind: 192.168.0.12 (SSL), run as: admin !Ausgabe "top":
!
pi@ioBroker-RasPi:~ $ top top - 18:15:14 [b]up 4:08[/b], 1 user, load average: 0,80, 0,61, 0,48 Tasks: 104 total, 1 running, 59 sleeping, 0 stopped, 0 zombie %Cpu(s): 2,6 us, 4,7 sy, 0,0 ni, 92,6 id, 0,0 wa, 0,0 hi, 0,1 si, 0,0 st KiB Mem : 1000176 total, 287512 free, 329568 used, 383096 buff/cache KiB Swap: 102396 total, 102396 free, 0 used. 592192 avail Mem ! PID USER PR NI VIRT RES SHR S %CPU %MEM TIME+ COMMAND [b]21996 root 20 0 0 0 0 I 8,3 0,0 1:28.05 kworker/1:0[/b] 1917 root 20 0 126956 45532 20620 S 6,9 4,6 0:48.48 io.rpi2.0 636 root 20 0 156220 57600 20764 S 3,3 5,8 9:34.28 iobroker.js-con 1397 root 20 0 120936 40076 20652 S 1,3 4,0 1:27.65 io.history.0 1632 root 20 0 158160 75600 20664 S 1,3 7,6 1:09.23 io.javascript.0 2110 root 20 0 144156 60660 22304 S 1,3 6,1 2:27.65 io.tr-064.0 17113 pi 20 0 8256 3288 2824 R 0,7 0,3 0:50.15 top 646 root 20 0 147384 64856 20500 S 0,3 6,5 1:31.10 io.admin.0 1101 root 20 0 118940 34136 20848 S 0,3 3,4 0:41.50 io.ping.0 24598 root 20 0 0 0 0 I 0,3 0,0 0:00.05 kworker/1:2 1 root 20 0 26928 6012 4924 S 0,0 0,6 0:02.18 systemd 2 root 20 0 0 0 0 S 0,0 0,0 0:00.01 kthreadd 4 root 0 -20 0 0 0 I 0,0 0,0 0:00.00 kworker/0:0H 6 root 0 -20 0 0 0 I 0,0 0,0 0:00.00 mm_percpu_wq 7 root 20 0 0 0 0 S 0,0 0,0 0:01.30 ksoftirqd/0 8 root 20 0 0 0 0 I 0,0 0,0 0:06.55 rcu_sched 9 root 20 0 0 0 0 I 0,0 0,0 0:00.00 rcu_bh 10 root rt 0 0 0 0 S 0,0 0,0 0:02.38 migration/0 11 root 20 0 0 0 0 S 0,0 0,0 0:00.00 cpuhp/0 12 root 20 0 0 0 0 S 0,0 0,0 0:00.00 cpuhp/1 13 root rt 0 0 0 0 S 0,0 0,0 0:00.41 migration/1 14 root 20 0 0 0 0 S 0,0 0,0 0:07.95 ksoftirqd/1 16 root 0 -20 0 0 0 I 0,0 0,0 0:00.00 kworker/1:0H 17 root 20 0 0 0 0 S 0,0 0,0 0:00.00 cpuhp/2 18 root rt 0 0 0 0 S 0,0 0,0 0:02.28 migration/2 19 root 20 0 0 0 0 S 0,0 0,0 0:00.32 ksoftirqd/2 21 root 0 -20 0 0 0 I 0,0 0,0 0:00.00 kworker/2:0H 22 root 20 0 0 0 0 S 0,0 0,0 0:00.00 cpuhp/3 23 root rt 0 0 0 0 S 0,0 0,0 0:02.24 migration/3 24 root 20 0 0 0 0 S 0,0 0,0 0:00.28 ksoftirqd/3 26 root 0 -20 0 0 0 I 0,0 0,0 0:00.00 kworker/3:0H 27 root 20 0 0 0 0 S 0,0 0,0 0:00.00 kdevtmpfs 28 root 0 -20 0 0 0 I 0,0 0,0 0:00.00 netns 33 root 20 0 0 0 0 S 0,0 0,0 0:00.01 khungtaskd 34 root 20 0 0 0 0 S 0,0 0,0 0:00.00 oom_reaper 35 root 0 -20 0 0 0 I 0,0 0,0 0:00.00 writeback 36 root 20 0 0 0 0 S 0,0 0,0 0:00.00 kcompactd0 37 root 0 -20 0 0 0 I 0,0 0,0 0:00.00 crypto !Was auffällt ist dass immer wieder ein Prozess namens kworker/1.0 auftaucht.
Nach nun 4h uptime liegt die PID wieder bei gut 20.000.
Aber die PIDs der ioBroker Prozesse liegen alle bei <2.000.
Sieht also so aus als würden die Prozesse nun nicht ständig neu starten.
Im Log findet man nur belanglose "info" Zeilen.
Lediglich der TR-064 hat 2x nen error geschmissen:
2018-09-15 15:14:34.032 - error: tr-064.0 forEachConfiguredDevice: in GetSpecificHostEntry 3(SteffiSE/4C:57:XXXXX):Error: sendSOAPActionRequest Error action=GetSpecificHostEntry serviceType=urn:dslforum-org:service:Hosts:1: - {"code":""}
2018-09-15 17:48:15.150 - error: tr-064.0 forEachConfiguredDevice: in GetSpecificHostEntry 0(Alek8/64:70:XXXXX):Error: sendSOAPActionRequest Error action=GetSpecificHostEntry serviceType=urn:dslforum-org:service:Hosts:1: - {"code":""}
und
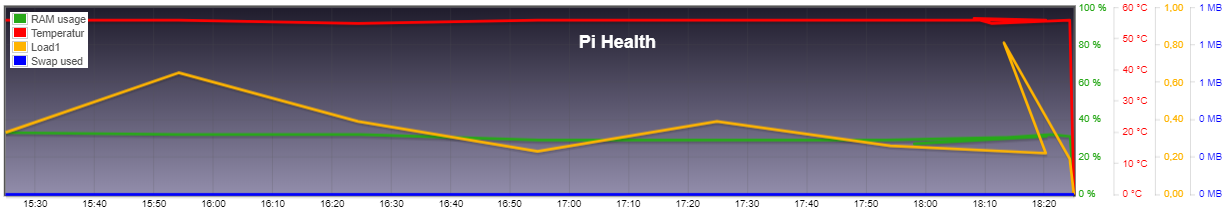
2018-09-15 14:29:02.340 - info: host.ioBroker-RasPi instance system.adapter.javascript.0 started with pid 1632
2018-09-15 14:29:10.361 - error: javascript.0 no connection to objects DB
2018-09-15 14:29:12.249 - warn: discovery.0 Reconnection to DB.
2018-09-15 14:29:12.258 - warn: discovery.0 Reconnection to DB.
2018-09-15 14:29:12.323 - error: discovery.0 already running
2018-09-15 14:29:12.359 - error: host.ioBroker-RasPi instance system.adapter.discovery.0 terminated with code 7 (Adapter already running)
2018-09-15 14:29:12.361 - info: host.ioBroker-RasPi Restart adapter system.adapter.discovery.0 because enabled
Einen FLOT Chart mit Load1, Temperatur, RAM Nutzung und Swap lief jetzt 4h durch.
Dort ist nichts auffälliges zu finden. Außer dass die Linie im FLOT manchmal unmögliche rückwärtssprüngezeigt. Aber das haben sie bei mir vorher auch schonmal gemacht. Liegt wohl am Adapter selbst, oder?
-
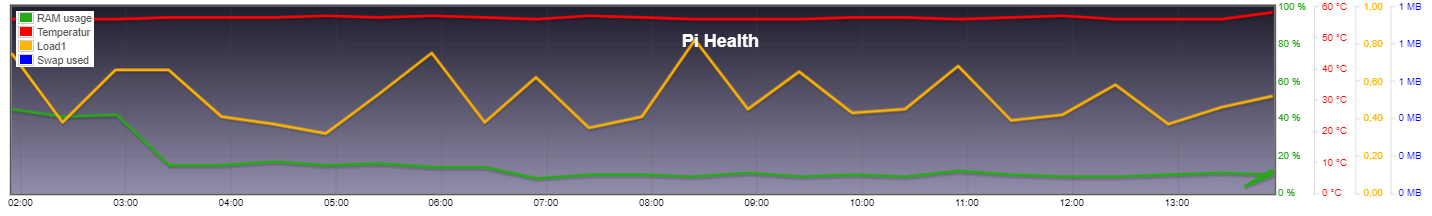
So, jetzt lief der Pi über Nacht.
Gestern lief er so gut, da habe ich schrittweise die meisten meiner Adapter wieder installiert :mrgreen:
Scheint alles ruhig zu sein.
List instances:
!
pi@ioBroker-RasPi:~ $ iobroker list instances system.adapter.admin.0 : admin - enabled, port: 8081, bind: 0.0.0.0 (SSL), run as: admin system.adapter.alexa2.0 : alexa2 - enabled system.adapter.backitup.0 : backitup - enabled system.adapter.discovery.0 : discovery - enabled system.adapter.flot.0 : flot - enabled system.adapter.history.0 : history - enabled system.adapter.hue.0 : hue - enabled, port: 80 system.adapter.icons-open-icon-library-png.0: icons-open-icon-library-png - enabled system.adapter.javascript.0 : javascript - enabled system.adapter.ping.0 : ping - enabled system.adapter.rpi2.0 : rpi2 - enabled system.adapter.tr-064.0 : tr-064 - enabled system.adapter.upnp.0 : upnp - enabled system.adapter.vis-fancyswitch.0 : vis-fancyswitch - enabled system.adapter.vis-history.0 : vis-history - enabled system.adapter.vis-hqwidgets.0 : vis-hqwidgets - enabled system.adapter.vis-jqui-mfd.0 : vis-jqui-mfd - enabled system.adapter.vis-timeandweather.0 : vis-timeandweather - enabled system.adapter.vis.0 : vis - enabled system.adapter.web.0 : web - enabled, port: 8083, bind: 192.168.0.12 (SSL), run as: admin !top:
!
pi@ioBroker-RasPi:~ $ top top - 13:50:19 up 15:37, 1 user, load average: 0,54, 0,54, 0,50 Tasks: 110 total, 1 running, 62 sleeping, 0 stopped, 0 zombie %Cpu(s): 2,8 us, 1,2 sy, 0,0 ni, 96,1 id, 0,0 wa, 0,0 hi, 0,0 si, 0,0 st KiB Mem : 1000176 total, 118476 free, 411476 used, 470224 buff/cache KiB Swap: 0 total, 0 free, 0 used. 510284 avail Mem ! PID USER PR NI VIRT RES SHR S %CPU %MEM TIME+ COMMAND 31504 root 20 0 0 0 0 I 8,2 0,0 0:22.98 kworker/3:1 551 root 20 0 161664 66972 20784 S 6,2 6,7 81:34.94 iobroker.js-con 823 root 20 0 140240 42820 20584 S 2,6 4,3 37:04.09 io.upnp.0 32012 pi 20 0 8240 3192 2716 R 1,3 0,3 0:00.20 top 728 root 20 0 158848 77236 20544 S 1,0 7,7 5:38.39 io.javascript.0 319 avahi 20 0 6528 3124 2748 S 0,3 0,3 0:44.98 avahi-daemon 696 root 20 0 135992 39588 21188 S 0,3 4,0 0:32.85 io.web.0 715 root 20 0 125216 44804 20424 S 0,3 4,5 0:54.76 io.history.0 23855 root 20 0 0 0 0 I 0,3 0,0 5:21.25 kworker/3:3 1 root 20 0 26928 5860 4800 S 0,0 0,6 0:02.67 systemd 2 root 20 0 0 0 0 S 0,0 0,0 0:00.06 kthreadd 4 root 0 -20 0 0 0 I 0,0 0,0 0:00.00 kworker/0:0H 6 root 0 -20 0 0 0 I 0,0 0,0 0:00.00 mm_percpu_wq 7 root 20 0 0 0 0 S 0,0 0,0 0:06.60 ksoftirqd/0 8 root 20 0 0 0 0 I 0,0 0,0 0:22.56 rcu_sched 9 root 20 0 0 0 0 I 0,0 0,0 0:00.00 rcu_bh 10 root rt 0 0 0 0 S 0,0 0,0 0:06.31 migration/0 11 root 20 0 0 0 0 S 0,0 0,0 0:00.00 cpuhp/0 12 root 20 0 0 0 0 S 0,0 0,0 0:00.00 cpuhp/1 13 root rt 0 0 0 0 S 0,0 0,0 0:06.15 migration/1 14 root 20 0 0 0 0 S 0,0 0,0 0:00.59 ksoftirqd/1 16 root 0 -20 0 0 0 I 0,0 0,0 0:00.00 kworker/1:0H 17 root 20 0 0 0 0 S 0,0 0,0 0:00.00 cpuhp/2 18 root rt 0 0 0 0 S 0,0 0,0 0:06.04 migration/2 19 root 20 0 0 0 0 S 0,0 0,0 0:00.80 ksoftirqd/2 21 root 0 -20 0 0 0 I 0,0 0,0 0:00.00 kworker/2:0H 22 root 20 0 0 0 0 S 0,0 0,0 0:00.00 cpuhp/3 23 root rt 0 0 0 0 S 0,0 0,0 0:00.97 migration/3 !Die PIDs der iobroker Prozesse sind schön niedrig. Also sind sie wohl nicht neu gestartet.
Das Log ist auch komplett unauffällig. Also nur infos zum upnp Adapter der neue Geräte gescannt hat.
Was mir aber aufgefallen ist,
als ich gestern testweise (weil ich nicht mehr abwarten wollte :mrgreen: ) meine views wieder importiert hatte, fing der Pi an, manche Prozesse zu killen und neu zu starten.
Hier scheint also irgendwo der Hund begraben.
Dazu werde ich das System erst mal wieder so herstellen wie ich es brauche. Ohne die views.
Dann schritt für schritt views einfügen und gucken ab wann er anfängt komische Dinge zu tun.
Wie ich meine Skripte und FLOTs einzeln aus meinem BackItUp Backup oder auch aus einem SDimage.img wieder extrahiere wisst ihr nicht, oder?
7541_flot.png -
Moin.
Ich wollte mal ne Rückmeldung geben.
Nachdem ich nun alles schrittweise wieder eingerichtet habe, habe ich endlich den Fehler gefunden, warum mein System so unrund lief.
Auch wenn es sehr ärgerlich ist, und ich eigentlich gar nicht hätte neu aufsetzen müssen, bin ich froh es gefunden zu haben.
Ich hatte sowohl damals bei der ersten Einrichtung als auch jetzt gelegentlich im Browser mehrere tabs offen mit denen ich am ioBroker gearbeitet habe.
Mehrere tabs an sich sind kein Problem für das System, aber sobald ich den "vis Editor" länger auf habe und daran arbeite, steigt die Load, und somit die Temperatur und alles weitere.
Ob das auch bei leeren views der Fall war kann ich jetzt leider nicht mehr sagen.
Vielleicht werde ich bei Gelegenheit meine views nochmal raus nehmen und gucken.
Wobei ich festgestellt habe dass Widget-Gruppen die importiert wurden, nur als leere widgets dargestellt werden. Sie lassen sich auch nicht aus der Gruppe lösen, weil sie nicht als Gruppe erkannt oder dargestellt werden.
Das recherchiere ich mal im entsprechenden Adapter Forum.
Gesendet per Tapatalk @

