

Material Design Widgets: Wetter View

-
Moin, bei dir sollte es funktionieren, oder? Ich leider eben erst gesehen, das in deinem Screenshot der Ordner "daswetter.0.location_1.ForecastHourly.Current" fehlt und daher die Meldung kommen muss.
Wenn du den Haken bei "Aktuelle Stunde kopieren" gesetzt hast, ist der ja vorhanden.Gruß, Johannes
@JoJo58
Guten Morgen, ja, der fehlende Haken war eines der Probleme. Ich musste den Adapter komplett löschen und neu einrichten. Das hatte ich irgendwo im Thread "DasWetter" gelesen.Nun funktioniert es. Vielen Dank.
Gruß
Martin
Intel NUCs mit Proxmox / Iobroker als VM unter Debian
Raspeberry mit USB Leseköpfen für Smartmeter
Homematic und Homematic IP -
@JoJo58
Guten Morgen, ja, der fehlende Haken war eines der Probleme. Ich musste den Adapter komplett löschen und neu einrichten. Das hatte ich irgendwo im Thread "DasWetter" gelesen.Nun funktioniert es. Vielen Dank.
-
Ich habe das Script nochmal angepasst, so das man jetzt angeben kann, ob man eigene Sensoren verwenden möchte, oder keine hat. Bisher war es so, das man angeben musste, oder es kamen Fehler.
Das ist die aktuelle Version 2.0.1
Gruß, Johannes
-
Ich habe das Script nochmal angepasst, so das man jetzt angeben kann, ob man eigene Sensoren verwenden möchte, oder keine hat. Bisher war es so, das man angeben musste, oder es kamen Fehler.
Das ist die aktuelle Version 2.0.1
Gruß, Johannes
@JoJo58
Ich habe zwei weitere eigene Sensoren hinzugefügt: Sonneneinstrahlung und UV.Hier das angepasste Script:
/************************************************************************************************************************************************************************ Version: 1.0.5 created by Scrounger Dieses Skript erzeugt json strings um Wetter Informationen im VIS mit den Material Design Widgets darzustellen ========================================================================================================================================================================= !!! Voraussetzungen !!! * Material Design Widgets >= 0.3.6 * DasWetter >= 3.0.1 * weatherunderground >= 3.2.1 * Pollenflug >= 1.0.4 (optional in Skript Einstellung de- / aktivierbar) * Javascript Adapter >= 4.6.1 * Javascript Adapter NPM Module: moment, moment-timezone, moment-duration-format, chroma-js ========================================================================================================================================================================= --- Links --- * Support: https://forum.iobroker.net/topic/32232/material-design-widgets-wetter-view * Github: https://github.com/Scrounger/ioBroker.vis-materialdesign/tree/master/examples/Weather ========================================================================================================================================================================= --- Changelog --- * 1.0.0: Initial release * 1.0.1: Trigger bug fixes * 1.0.2: enable / disable option for Pollenflug Adapter added * 1.0.3: new feature of Material Design Widgets 0.3.6 added: auto show data labels on chart * 1.0.4: bug fix graphs y-Axis range, Javascript Adapter >= 4.6.1 needed, DasWetter >= 3.0.1 needed * 1.0.5: bug fix Windrichtung ************************************************************************************************************************************************************************/ /************************************************************************************************************************************************************************ * 2.0.0 Patched for DasWetter v4+ structure (ForecastDaily + ForecastHourly) Based on Scrounger Script 1.0.5 (Material Design Widgets Wetter View) JoJo-Patch 2026-01-26: Works with: - daswetter.0.location_1.ForecastDaily.Day_1..Day_5.* - daswetter.0.location_1.ForecastHourly.Current.* - daswetter.0.location_1.ForecastHourly.Hour_1..Hour_24.* Notes: - No dependency on weatherunderground for core functionality anymore. - 24h Chart uses ForecastHourly.Hour_1..Hour_24 (next 24 hours). - Daily cards use ForecastDaily fields you posted. * 2.0.1 JoJo 2026-01-27 Jetzt kann man angeben, ob man eigene Sensoren nutzen möchte, oder nicht. ************************************************************************************************************************************************************************/ // ===================== Script Settings ===================== let dasWetter_Tage = 5; let idDatenpunktPrefix = '0_userdata.0'; // '0_userdata.0' or 'javascript.x' let idDatenPunktStrukturPrefix = 'vis.MaterialDesignWidgets.Wetter'; // own sensor (optional) const enableOwnSensors = true; // <-- auf false setzen, wenn keine eigenen Sensoren genutzt werden let idSensor_Temperatur = '0_userdata.0.Wetterstation.Aussentemperatur'; let idSensor_Luftfeuchtigkeit = '0_userdata.0.Wetterstation.Aussenfeuchtigkeit'; let idSensor_Sonnenstrahlung = '0_userdata.0.Wetterstation.Sonnenstrahlung'; let idSensor_UV = '0_userdata.0.Wetterstation.UV_Index'; // chart colors let color_graph_temperatur_verlauf = [ { value: -20, color: '#5b2c6f' }, { value: 0, color: '#2874a6' }, { value: 14, color: '#73c6b6' }, { value: 22, color: '#008000' }, { value: 27, color: '#FFA500' }, { value: 35, color: '#FF0000' } ]; // let color_graph_regenwahrscheinlichkeit = '#0d47a1'; let color_graph_regenwahrscheinlichkeit = '#8ae8f9'; let color_graph_niederschlag = '#6dd600'; // Pollen (optional) let enablePollenFlug = true; let idPollenFlugRegion = 'pollenflug.0.region#41.summary'; let pollenFlugFarben = ['#57bb8a', '#94bd77', '#d4c86a', '#e9b861', '#e79a69', '#dd776e', 'red']; let pollenFlugText = ['keine', 'kaum', 'gering', 'mäßig', 'mittel', 'hoch', 'stark']; // ===================== Derived IDs ===================== let idIconList_Vorschau = `${idDatenpunktPrefix}.${idDatenPunktStrukturPrefix}.Vorschau.IconList`; let idIconList_Vorschau_Chart = `${idDatenpunktPrefix}.${idDatenPunktStrukturPrefix}.Vorschau.Chart`; let idDialogSchalter = `${idDatenpunktPrefix}.${idDatenPunktStrukturPrefix}.Dialog.Day_`; let idDatum = `${idDatenpunktPrefix}.${idDatenPunktStrukturPrefix}.DatumFormat.Day_`; let idTemperatur = `${idDatenpunktPrefix}.${idDatenPunktStrukturPrefix}.Temperatur.Day_`; let idNiederschlag = `${idDatenpunktPrefix}.${idDatenPunktStrukturPrefix}.Niederschlag.Day_`; let idLuftfeuchtigkeit = `${idDatenpunktPrefix}.${idDatenPunktStrukturPrefix}.Luftfeuchtigkeit.Day_`; let idWindgeschwindigkeit = `${idDatenpunktPrefix}.${idDatenPunktStrukturPrefix}.Windgeschwindigkeit.Day_`; let idWindrichtung = `${idDatenpunktPrefix}.${idDatenPunktStrukturPrefix}.Windrichtung.Day_`; let idLuftdruck = `${idDatenpunktPrefix}.${idDatenPunktStrukturPrefix}.Luftdruck.Day_`; let idSchneefallgrenze = `${idDatenpunktPrefix}.${idDatenPunktStrukturPrefix}.Schneefallgrenze.Day_`; let idSonne = `${idDatenpunktPrefix}.${idDatenPunktStrukturPrefix}.Sonne.Day_`; let idMond = `${idDatenpunktPrefix}.${idDatenPunktStrukturPrefix}.Mond.Day_`; let idBewolkung = `${idDatenpunktPrefix}.${idDatenPunktStrukturPrefix}.Aktuell.Bewolkung`; let idUvIndex = `${idDatenpunktPrefix}.${idDatenPunktStrukturPrefix}.Aktuell.UV-Index`; let idSonneneinstrahlung = `${idDatenpunktPrefix}.${idDatenPunktStrukturPrefix}.Aktuell.Sonneneinstrahlung`; let idMeineSensoren = `${idDatenpunktPrefix}.${idDatenPunktStrukturPrefix}.Aktuell.MeineSensoren`; let idChart = `${idDatenpunktPrefix}.${idDatenPunktStrukturPrefix}.Chart.Day_`; let idVisibiltyPollenFlug = `${idDatenpunktPrefix}.${idDatenPunktStrukturPrefix}.Pollenflug.visible`; let idPollenflug = `${idDatenpunktPrefix}.${idDatenPunktStrukturPrefix}.Pollenflug.Day_`; // ===================== DasWetter paths ===================== const DW_DAILY = 'daswetter.0.location_1.ForecastDaily.Day_'; const DW_HOURLY = 'daswetter.0.location_1.ForecastHourly'; const DW_CUR = `${DW_HOURLY}.Current`; function dwDay(day, key) { return `${DW_DAILY}${day}.${key}`; } function dwHour(h, key) { return `${DW_HOURLY}.Hour_${h}.${key}`; } // ===================== imports ===================== const chromaJs = require("chroma-js"); const moment = require("moment"); moment.locale("de"); let temperaturGradientColors = getGradientColors(-20, 40, color_graph_temperatur_verlauf); // ===================== triggers ===================== on({ id: "system.adapter.daswetter.0.alive", val: false }, createData); if (enableOwnSensors && idSensor_Temperatur && idSensor_Temperatur.trim() !== '' && existsState(idSensor_Temperatur)) { on({ id: idSensor_Temperatur }, createData); } // ===================== main ===================== function createData(obj) { try { if (obj) console.log(`Material Design Widgets: Wetter Skript triggered by '${obj.id}'`); else console.log(`Material Design Widgets: Wetter Skript gestartet`); // sanity check if (!existsState(dwDay(1, 'NameOfDay')) || !existsState(`${DW_CUR}.time`)) { console.warn(`DasWetter Datenpunkte nicht vollständig gefunden. Prüfe location_1 / ForecastDaily / ForecastHourly.`); } let vorschauIconList = []; for (let i = 1; i <= dasWetter_Tage; i++) { if (existsState(dwDay(i, 'NameOfDay'))) { vorschauIconList.push(createVorschauIconListItem(i)); createDatumFormatierung(i); createNiederschlag(i); createLuftfeuchtigkeit(i); createTemperatur(i); createWindgeschwindigkeit(i); createWindrichtung(i); createLuftdruck(i); createSchneefallgrenze(i); createSonne(i); createMond(i); createPollenFlug(i); // 24h Verlauf: aus ForecastHourly.Hour_1..24 (nur sinnvoll für "Tag 1 / nächste 24h") createCharts(i); mySetState(`${idDialogSchalter}${i}`, false, 'boolean', `Schalter um Dialog für Tag ${i} anzuzeigen`, true); } else { console.warn(`Keine Daten für Tag ${i} vorhanden! (DP: ${dwDay(i, 'NameOfDay')})`); } } // Aktuellwerte aus ForecastHourly.Current createBewolkung(); createUvIndex(); createSonneneinstrahlung(); // DasWetter liefert hier keinen solarRadiation-DP in Current (bei dir nicht gelistet) -> bleibt Platzhalter function createEigeneSensoren() { let listForWidget = []; const hasTemp = enableOwnSensors && idSensor_Temperatur && idSensor_Temperatur.trim() !== '' && existsState(idSensor_Temperatur); const hasHum = enableOwnSensors && idSensor_Luftfeuchtigkeit && idSensor_Luftfeuchtigkeit.trim() !== '' && existsState(idSensor_Luftfeuchtigkeit); if (hasTemp && hasHum) { listForWidget.push({ rightText: getRightText( formatValue(getVal(idSensor_Temperatur, 0), 1), ' °C', formatValue(getVal(idSensor_Luftfeuchtigkeit, 0), 0), ' %', formatValue(getVal(idSensor_Sonnenstrahlung, 0), 0), ' w/m²', formatValue(getVal(idSensor_UV, 0), 0), '' ) }); } else { // Wenn du lieber "nichts" anzeigen willst: so lassen. // Wenn du lieber Platzhalter willst, dann Zeile unten aktivieren: // listForWidget.push({ rightText: getRightText('-', '', '-', '') }); } mySetState(`${idMeineSensoren}`, JSON.stringify(listForWidget), 'string', `Werte eigener Sensoren aktuell für List Widget`); } // Wochen Vorschau Graph (Daily) createVorschauGraph(dasWetter_Tage); // IconList Widget Vorschau mySetState(idIconList_Vorschau, JSON.stringify(vorschauIconList), 'string', 'Vorschau Wetter für IconList Widget'); } catch (err) { console.error(`[createData] error: ${err.message}`); console.error(`[createData] stack: ${err.stack}`); } } // ===================== helpers (safe read) ===================== function getVal(id, def = null) { if (!existsState(id)) return def; const s = getState(id); return (s && s.val !== undefined && s.val !== null) ? s.val : def; } function numVal(id, def = 0) { const v = getVal(id, def); const n = parseFloat(v); return isNaN(n) ? def : n; } // formatValue as in original script expectations function formatValue(val, digits) { if (val === null || val === undefined || val === '-') return '-'; const n = parseFloat(val); if (isNaN(n)) return '-'; return n.toFixed(digits).toString().replace('.', ','); } function getRightText(val1, unitVal1, val2 = undefined, unitVal2 = undefined) { return ` <div style="display: flex; align-items: flex-end; justify-content: flex-end;"> <div style="color: #44739e; font-size: 30px; font-family: RobotoCondensed-Regular;">${val1}</div> <div style="color: #44739e; font-size: 16px; font-family: RobotoCondensed-Regular; margin-left: 2px; margin-bottom: 4px;">${unitVal1}</div> </div> ${(val2 !== undefined) ? `<div style="color: gray; height: 13px; font-size: 12px; font-family: RobotoCondensed-Light; margin-top: 2px;">${val2}${unitVal2}</div>` : ''}` } // ===================== widgets: own sensors ===================== function createEigeneSensoren() { let listForWidget = []; if (existsState(idSensor_Temperatur)) { listForWidget.push({ rightText: getRightText( formatValue(getVal(idSensor_Temperatur, 0), 1), ' °C', formatValue(getVal(idSensor_Luftfeuchtigkeit, 0), 0), ' %', formatValue(getVal(idSensor_Sonnenstrahlung, 0), 0), ' w/m²', formatValue(getVal(idSensor_UV, 0), 0), '' ) }); } mySetState(`${idMeineSensoren}`, JSON.stringify(listForWidget), 'string', `Werte eigener Sensoren aktuell für List Widget`); } // ===================== widgets: Current ===================== function createBewolkung() { const clouds = numVal(`${DW_CUR}.clouds`, null); let listForWidget = [{ rightText: getRightText( (clouds === null ? '-' : formatValue(clouds, 0)), (clouds === null ? '' : ' %') ) }]; mySetState(`${idBewolkung}`, JSON.stringify(listForWidget), 'string', `Bewölkung aktuell für List Widget`); } function createUvIndex() { let listForWidget = []; listForWidget.push({ rightText: getRightText( formatValue(getState(`0_userdata.0.Wetterstation.UV_Index`).val, 0), '' ) }) mySetState(`${idUvIndex}`, JSON.stringify(listForWidget), 'string', `UV-Index aktuell für List Widget`); } function createSonneneinstrahlung() { let listForWidget = []; listForWidget.push({ rightText: getRightText( formatValue(getState(`0_userdata.0.Wetterstation.Sonnenstrahlung`).val, 0), ' w/m²', ) }) mySetState(`${idSonneneinstrahlung}`, JSON.stringify(listForWidget), 'string', `Sonneneinstrahlung aktuell für List Widget`); } // ===================== widgets: Daily ===================== function createDatumFormatierung(day) { const idDasWetter = `daswetter.0.location_1.ForecastDaily.Day_${day}`; // robust: erst date_full, fallback date const rawDate = getVal(`${idDasWetter}.date_full`, null) || getVal(`${idDasWetter}.date`, null); const formatiertesDatum = rawDate ? moment(new Date(rawDate)).format("dddd, D. MMMM YYYY") : '-'; mySetState( `${idDatum}${day}`, formatiertesDatum, 'string', `Formatiertes Datum Tag ${day}` ); } function createTemperatur(day) { let listForWidget = []; if (day === 1) { // aktuelle Temp aus Current const temp = numVal(`${DW_CUR}.temperature`, null); const felt = numVal(`${DW_CUR}.temperature_feels_like`, null); listForWidget.push({ rightText: getRightText( (temp === null ? '-' : formatValue(temp, 1)), '°C', (temp !== null && felt !== null && temp !== felt) ? `gefühlt ${formatValue(felt, 1)}` : undefined, '°C' ) }); } else { const tMax = numVal(dwDay(day, 'Temperature_Max'), null); const tMin = numVal(dwDay(day, 'Temperature_Min'), null); listForWidget.push({ rightText: getRightText( (tMax === null ? '-' : formatValue(tMax, 1)), '°C', `Nachts ${(tMin === null ? '-' : formatValue(tMin, 1))}`, '°C' ) }); } mySetState(`${idTemperatur}${day}`, JSON.stringify(listForWidget), 'string', `Temperatur Tag ${day} für List Widget`); } function createLuftfeuchtigkeit(day) { let listForWidget = []; if (day === 1) { const hum = numVal(`${DW_CUR}.humidity`, null); listForWidget.push({ rightText: getRightText( (hum === null ? '-' : formatValue(hum, 0)), (hum === null ? '' : ' %') ) }); } else { const hum = numVal(dwDay(day, 'Humidity'), null); listForWidget.push({ rightText: getRightText( (hum === null ? '-' : formatValue(hum, 0)), (hum === null ? '' : ' %') ) }); } mySetState(`${idLuftfeuchtigkeit}${day}`, JSON.stringify(listForWidget), 'string', `Luftfeuchtigkeit Tag ${day} für List Widget`); } function createNiederschlag(day) { let listForWidget = []; if (day === 1) { const prob = numVal(`${DW_CUR}.rain_probability`, null); const rain = numVal(`${DW_CUR}.rain`, null); listForWidget.push({ rightText: getRightText( (prob === null ? '-' : formatValue(prob, 0)), (prob === null ? '' : ' %'), (rain === null ? '-' : formatValue(rain, 1)), (rain === null ? '' : ' mm') ) }); } else { const prob = numVal(dwDay(day, 'Rain_Probability'), null); const rain = numVal(dwDay(day, 'Rain'), null); listForWidget.push({ rightText: getRightText( (prob === null ? '-' : formatValue(prob, 0)), (prob === null ? '' : ' %'), (rain === null ? '-' : formatValue(rain, 1)), (rain === null ? '' : ' mm') ) }); } mySetState(`${idNiederschlag}${day}`, JSON.stringify(listForWidget), 'string', `Niederschlag Tag ${day} für List Widget`); } function createWindgeschwindigkeit(day) { let listForWidget = []; if (day === 1) { const wind = numVal(`${DW_CUR}.wind_speed`, null); const gust = numVal(`${DW_CUR}.wind_gust`, null); listForWidget.push({ rightText: getRightText( (wind === null ? '-' : formatValue(wind, 0)), (wind === null ? '' : ' km/h'), (gust === null ? undefined : `Böen ${formatValue(gust, 0)}`), (gust === null ? '' : ' km/h') ) }); } else { const wind = numVal(dwDay(day, 'Wind_Speed'), null); const gust = numVal(dwDay(day, 'Wind_Gust'), null); listForWidget.push({ rightText: getRightText( (wind === null ? '-' : formatValue(wind, 0)), (wind === null ? '' : ' km/h'), (gust === null ? undefined : `Böen ${formatValue(gust, 0)}`), (gust === null ? '' : ' km/h') ) }); } mySetState(`${idWindgeschwindigkeit}${day}`, JSON.stringify(listForWidget), 'string', `Windgeschwindigkeit Tag ${day} für List Widget`); } function createWindrichtung(day) { let listForWidget = []; if (day === 1) { const dir = getVal(`${DW_CUR}.wind_direction`, '-'); listForWidget.push({ rightText: getRightText(dir, '') }); } else { const dir = getVal(dwDay(day, 'Wind_Direction'), '-'); listForWidget.push({ rightText: getRightText(dir, '') }); } mySetState(`${idWindrichtung}${day}`, JSON.stringify(listForWidget), 'string', `Windrichtung Tag ${day} für List Widget`); } function createLuftdruck(day) { let listForWidget = []; if (day === 1) { const p = numVal(`${DW_CUR}.pressure`, null); listForWidget.push({ rightText: getRightText( (p === null ? '-' : formatValue(p, 0)), (p === null ? '' : ' mbar') ) }); } else { const p = numVal(dwDay(day, 'Pressure'), null); listForWidget.push({ rightText: getRightText( (p === null ? '-' : formatValue(p, 0)), (p === null ? '' : ' mbar') ) }); } mySetState(`${idLuftdruck}${day}`, JSON.stringify(listForWidget), 'string', `Luftdruck Tag ${day} für List Widget`); } function createSchneefallgrenze(day) { let listForWidget = []; const grenze = (day === 1) ? numVal(`${DW_CUR}.snowline`, null) : numVal(dwDay(day, 'Snowline'), null); listForWidget.push({ rightText: getRightText( (grenze === null || grenze <= 0) ? '-' : formatValue(grenze, 0), (grenze === null || grenze <= 0) ? '' : ' m' ) }); mySetState(`${idSchneefallgrenze}${day}`, JSON.stringify(listForWidget), 'string', `Schneefallgrenze Tag ${day} für List Widget`); } function createSonne(day) { let listForWidget = []; const sunIn = getVal(dwDay(day, 'Sun_in'), '-'); const sunOut = getVal(dwDay(day, 'Sun_out'), '-'); listForWidget.push({ rightText: ` <div style="color: gray; height: 13px; font-size: 10px; font-family: RobotoCondensed-Light; margin-top: 2px;">Aufgang</div> <div style="display: flex; align-items: flex-end; justify-content: flex-end;"> <div style="color: #44739e; font-size: 24px; font-family: RobotoCondensed-Regular;">${sunIn}</div> </div>` }); listForWidget.push({ rightText: ` <div style="color: gray; height: 13px; font-size: 10px; font-family: RobotoCondensed-Light; margin-top: 2px;">Untergang</div> <div style="display: flex; align-items: flex-end; justify-content: flex-end;"> <div style="color: #44739e; font-size: 24px; font-family: RobotoCondensed-Regular;">${sunOut}</div> </div>` }); mySetState(`${idSonne}${day}`, JSON.stringify(listForWidget), 'string', `Sonne Infos Tag ${day} für List Widget`); } function createMond(day) { let listForWidget = []; const moonIn = getVal(dwDay(day, 'Moon_in'), '-'); const moonOut = getVal(dwDay(day, 'Moon_out'), '-'); const illum = numVal(dwDay(day, 'Moon_illumination'), null); listForWidget.push({ rightText: ` <div style="color: gray; height: 13px; font-size: 10px; font-family: RobotoCondensed-Light; margin-top: 2px;">Aufgang</div> <div style="display: flex; align-items: flex-end; justify-content: flex-end;"> <div style="color: #44739e; font-size: 24px; font-family: RobotoCondensed-Regular;">${moonIn}</div> </div>` }); listForWidget.push({ rightText: ` <div style="color: gray; height: 13px; font-size: 10px; font-family: RobotoCondensed-Light; margin-top: 2px;">Untergang</div> <div style="display: flex; align-items: flex-end; justify-content: flex-end;"> <div style="color: #44739e; font-size: 24px; font-family: RobotoCondensed-Regular;">${moonOut}</div> </div>` }); mySetState(`${idMond}${day}`, JSON.stringify(listForWidget), 'string', `Mond Infos Tag ${day} für List Widget`); const moonHtml = (illum !== null) ? `<div><span class="mdi mdi-moon-waxing-crescent materialdesign-icon-image"></span> ${formatValue(illum, 0)} %</div>` : `<div>-</div>`; mySetState(`${idMond}${day}_lumi`, moonHtml, 'string', `Mond Beleuchtung Tag ${day} für Html Widget`); } // ===================== Pollen ===================== function createPollenFlug(day) { let barData = []; if (enablePollenFlug) { mySetState(`${idVisibiltyPollenFlug}`, true, 'boolean', `Pollenflug Widgets anzeigen / ausblenden`); if (day === 1) generateData(`${idPollenFlugRegion}.json_index_today`); if (day === 2) generateData(`${idPollenFlugRegion}.json_index_tomorrow`); function generateData(idDp) { if (!existsState(idDp)) return; let raw = getVal(idDp, null); if (!raw) return; let data; try { data = JSON.parse(raw); } catch (e) { data = null; } if (data && data.length > 0) { for (const pollenInfo of data) { barData.push({ label: pollenInfo.Pollen, value: pollenInfo.Riskindex + 1, dataColor: pollenFlugFarben[pollenInfo.Riskindex], valueText: pollenFlugText[pollenInfo.Riskindex] }); } } mySetState(`${idPollenflug}${day}`, JSON.stringify(barData), 'string', `Pollenflug Tag ${day} für Bar Chart Widget`); } } else { mySetState(`${idVisibiltyPollenFlug}`, false, 'boolean', `Pollenflug Widgets anzeigen / ausblenden`); } } // ===================== Charts ===================== // Build a single 24h chart from ForecastHourly.Hour_1..Hour_24 (next 24 hours). // To keep your existing VIS bindings (Chart.Day_1..Day_5), we write the same chart for every day, // but it represents "next 24h". If you want only Day_1 chart, we can do that too. function createCharts(day) { let axisLabels = []; let temperatur = []; let temperaturColors = []; let regenWahrscheinlichkeit = []; let niederschlag = []; let temperaturAxisMax = -100; let temperaturAxisMin = 100; let niederschlagMaxVal = 0; for (let i = 1; i <= 24; i++) { // time label let t = getVal(dwHour(i, 'time'), null); if (t !== null) { let h = String(t).replace(':00', ''); axisLabels.push(`${h}h`); } else { axisLabels.push(''); } // temperature let temp = numVal(dwHour(i, 'temperature'), null); if (temp === null) { temperatur.push(null); temperaturColors.push('#888888'); } else { if (temp > temperaturAxisMax) temperaturAxisMax = temp; if (temp < temperaturAxisMin) temperaturAxisMin = temp; temperatur.push(temp); temperaturColors.push(temperaturGradientColors.getColorByValue(temp)); } // rain probability let prob = numVal(dwHour(i, 'rain_probability'), null); regenWahrscheinlichkeit.push(prob === null ? null : prob); // rain amount let rain = numVal(dwHour(i, 'rain'), 0); if (rain > niederschlagMaxVal) niederschlagMaxVal = rain; niederschlag.push(rain); } let graphs = []; graphs.push({ data: temperatur, type: 'line', color: 'gray', legendText: 'Temperatur', line_pointSizeHover: 5, line_pointSize: 0, line_Tension: 0.3, yAxis_show: false, yAxis_gridLines_show: false, yAxis_gridLines_ticks_length: 5, yAxis_min: (temperaturAxisMin < 5) ? Math.ceil((temperaturAxisMin - 5) / 5) * 5 : 0, yAxis_max: Math.ceil((temperaturAxisMax + 5) / 5) * 5, yAxis_step: 5, yAxis_position: 'left', yAxis_appendix: ' °C', yAxis_zeroLineWidth: 0.1, yAxis_zeroLineColor: 'black', displayOrder: 0, tooltip_AppendText: ' °C', datalabel_backgroundColor: temperaturColors, datalabel_color: 'white', datalabel_offset: -10, datalabel_fontFamily: 'RobotoCondensed-Light', datalabel_fontSize: 12, datalabel_borderRadius: 6, datalabel_show: 'auto', line_PointColor: temperaturColors, line_PointColorBorder: temperaturColors, line_PointColorHover: temperaturColors, line_PointColorBorderHover: temperaturColors, use_gradient_color: true, gradient_color: color_graph_temperatur_verlauf, use_line_gradient_fill_color: true, line_gradient_fill_color: temperaturGradientColors.getGradientWithOpacity(40) }); if (regenWahrscheinlichkeit.some(v => v !== null)) { graphs.push({ data: regenWahrscheinlichkeit, type: 'line', color: color_graph_regenwahrscheinlichkeit, legendText: 'Regenwahrscheinlichkeit', line_UseFillColor: true, line_pointSize: 0, line_pointSizeHover: 5, yAxis_min: 0, yAxis_max: 100, yAxis_maxSteps: 10, yAxis_position: 'left', yAxis_gridLines_show: false, yAxis_gridLines_border_show: false, yAxis_zeroLineWidth: 0.1, yAxis_zeroLineColor: 'black', yAxis_appendix: ' %', displayOrder: 1, tooltip_AppendText: ' %', datalabel_show: false, }); } if (niederschlagMaxVal > 0) { graphs.push({ data: niederschlag, type: 'bar', color: color_graph_niederschlag, legendText: 'Niederschlag', yAxis_min: 0, yAxis_max: Math.ceil((niederschlagMaxVal + 5) / 5) * 5, yAxis_maxSteps: 10, yAxis_position: 'right', yAxis_gridLines_show: false, yAxis_appendix: ' mm', yAxis_gridLines_border_show: false, yAxis_zeroLineWidth: 0.1, yAxis_zeroLineColor: 'black', displayOrder: 1, tooltip_AppendText: ' mm', datalabel_show: false, }); } const chart = { axisLabels, graphs }; mySetState(`${idChart}${day}`, JSON.stringify(chart), 'string', `Tag ${day} für Chart Widget (nächste 24h)`); } // ===================== Weekly preview graph (Daily) ===================== function createVorschauGraph(maxDays) { let axisLabels = []; let temperaturMax = []; let temperaturMin = []; let temperaturMaxColors = []; let temperaturMinColors = []; let temperaturAxisMax = -100; let temperaturAxisMin = 100; let regenWahrscheinlichkeit = []; let niederschlag = []; let niederschlagMaxVal = 0; for (let day = 1; day <= maxDays; day++) { if (!existsState(dwDay(day, 'NameOfDay'))) continue; axisLabels.push((day === 1) ? 'Heute' : getVal(dwDay(day, 'NameOfDay'), `Tag ${day}`)); const tMax = numVal(dwDay(day, 'Temperature_Max'), null); const tMin = numVal(dwDay(day, 'Temperature_Min'), null); if (tMax !== null) { if (tMax > temperaturAxisMax) temperaturAxisMax = tMax; if (tMax < temperaturAxisMin) temperaturAxisMin = tMax; temperaturMax.push(tMax); temperaturMaxColors.push(temperaturGradientColors.getColorByValue(tMax)); } else { temperaturMax.push(null); temperaturMaxColors.push('#888888'); } if (tMin !== null) { if (tMin > temperaturAxisMax) temperaturAxisMax = tMin; if (tMin < temperaturAxisMin) temperaturAxisMin = tMin; temperaturMin.push(tMin); temperaturMinColors.push(temperaturGradientColors.getColorByValue(tMin)); } else { temperaturMin.push(null); temperaturMinColors.push('#888888'); } const rain = numVal(dwDay(day, 'Rain'), 0); if (rain > niederschlagMaxVal) niederschlagMaxVal = rain; niederschlag.push(rain); const prob = numVal(dwDay(day, 'Rain_Probability'), 0); regenWahrscheinlichkeit.push(prob); } let graphs = []; graphs.push({ data: temperaturMax, type: 'line', legendText: 'max. Temperatur', line_pointSizeHover: 5, line_pointSize: 0, line_Tension: 0.3, yAxis_id: 0, yAxis_show: false, yAxis_gridLines_show: false, yAxis_gridLines_ticks_length: 5, yAxis_min: (temperaturAxisMin < 5) ? Math.ceil((temperaturAxisMin - 5) / 5) * 5 : 0, yAxis_max: Math.ceil((temperaturAxisMax + 5) / 5) * 5, yAxis_step: 5, yAxis_position: 'left', yAxis_appendix: ' °C', yAxis_zeroLineWidth: 0.1, yAxis_zeroLineColor: 'black', displayOrder: 0, tooltip_AppendText: ' °C', datalabel_backgroundColor: temperaturMaxColors, datalabel_color: 'white', datalabel_offset: -10, datalabel_fontFamily: 'RobotoCondensed-Light', datalabel_fontSize: 12, datalabel_borderRadius: 6, line_PointColor: temperaturMaxColors, line_PointColorBorder: temperaturMaxColors, line_PointColorHover: temperaturMaxColors, line_PointColorBorderHover: temperaturMaxColors, use_gradient_color: true, line_FillBetweenLines: '+1', gradient_color: color_graph_temperatur_verlauf, use_line_gradient_fill_color: true, line_gradient_fill_color: temperaturGradientColors.getGradientWithOpacity(40) }); graphs.push({ data: temperaturMin, type: 'line', legendText: 'min. Temperatur', line_pointSizeHover: 5, line_pointSize: 0, line_Tension: 0.3, yAxis_id: 0, yAxis_show: false, yAxis_gridLines_show: false, yAxis_gridLines_ticks_length: 5, yAxis_min: (temperaturAxisMin < 5) ? Math.ceil((temperaturAxisMin - 5) / 5) * 5 : 0, yAxis_max: Math.ceil((temperaturAxisMax + 5) / 5) * 5, yAxis_step: 5, yAxis_position: 'left', yAxis_appendix: ' °C', yAxis_zeroLineWidth: 0.1, yAxis_zeroLineColor: 'black', displayOrder: 0, tooltip_AppendText: ' °C', datalabel_backgroundColor: temperaturMinColors, datalabel_color: 'white', datalabel_offset: -10, datalabel_fontFamily: 'RobotoCondensed-Light', datalabel_fontSize: 12, datalabel_borderRadius: 6, line_PointColor: temperaturMinColors, line_PointColorBorder: temperaturMinColors, line_PointColorHover: temperaturMinColors, line_PointColorBorderHover: temperaturMinColors, use_gradient_color: true, gradient_color: color_graph_temperatur_verlauf }); graphs.push({ data: regenWahrscheinlichkeit, type: 'line', color: color_graph_regenwahrscheinlichkeit, legendText: 'Regenwahrscheinlichkeit', line_UseFillColor: true, line_pointSize: 0, line_pointSizeHover: 5, yAxis_min: 0, yAxis_max: 100, yAxis_maxSteps: 10, yAxis_position: 'left', yAxis_gridLines_show: false, yAxis_gridLines_border_show: true, yAxis_distance: 10, yAxis_zeroLineWidth: 0.1, yAxis_zeroLineColor: 'black', yAxis_appendix: ' %', displayOrder: 1, tooltip_AppendText: ' %', datalabel_show: false, }); if (niederschlagMaxVal > 0) { graphs.push({ data: niederschlag, type: 'bar', color: color_graph_niederschlag, legendText: 'Niederschlag', yAxis_min: 0, yAxis_max: Math.ceil((niederschlagMaxVal + 5) / 5) * 5, yAxis_maxSteps: 10, yAxis_position: 'right', yAxis_gridLines_show: false, yAxis_appendix: ' mm', yAxis_gridLines_border_show: false, yAxis_distance: 10, yAxis_zeroLineWidth: 0.1, yAxis_zeroLineColor: 'black', displayOrder: 1, tooltip_AppendText: ' mm', datalabel_show: false, }); } const chart = { axisLabels, graphs }; mySetState(`${idIconList_Vorschau_Chart}`, JSON.stringify(chart), 'string', `Vorschau Chart`); } // ===================== IconList item (Daily) ===================== function createVorschauIconListItem(day) { const title = (day === 1) ? 'Heute' : getVal(dwDay(day, 'NameOfDay'), `Tag ${day}`); const regenWahrscheinlichkeit = `${formatValue(getVal(dwDay(day, 'Rain_Probability'), 0), 0)} %`; const niederschlag = `${formatValue(getVal(dwDay(day, 'Rain'), 0), 1)} mm`; return { text: ` <div style="margin: 0 4px; text-align: center;">${title} <div style="height: 1px; background: #44739e;"></div> <div style="color: grey; font-size: 11px; font-family: RobotoCondensed-Light; white-space: break-spaces; margin-top: 5px; text-align: center;"> ${getVal(dwDay(day, 'symbol_description'), '')} </div> <div style="color: #44739e; font-family: RobotoCondensed-Regular; font-size: 16px; margin-top: 5px; text-align: center;"> ${formatValue(getVal(dwDay(day, 'Temperature_Max'), '-'), 1)}°C | ${formatValue(getVal(dwDay(day, 'Temperature_Min'), '-'), 1)}°C </div> <div style="color: grey; font-size: 11px; font-family: RobotoCondensed-Light; white-space: break-spaces; margin-top: 5px; text-align: center;"> ${regenWahrscheinlichkeit} </div> </div>`, image: getVal(dwDay(day, 'symbol_URL'), ''), subText: ` <div style="display: flex; align-items: center; margin: 0 4px;"> <div style="flex: 1;text-align: left;font-family: RobotoCondensed-Light; font-size: 11px;">Luftfeuchtigkeit</div> <div style="color: gray; font-family: RobotoCondensed-LightItalic; font-size: 10px;">${formatValue(getVal(dwDay(day, 'Humidity'), '-'), 0)} %</div> </div> <div style="display: flex; align-items: flex-start; margin: 0 4px;"> <div style="flex: 1;text-align: left;font-family: RobotoCondensed-Light; font-size: 11px;">Regen</div> <div style="color: gray; font-family: RobotoCondensed-LightItalic; font-size: 10px;">${niederschlag}</div> </div> <div style="display: flex; align-items: center; margin: 0 4px;"> <div style="flex: 1;text-align: left;font-family: RobotoCondensed-Light; font-size: 11px;">Wind</div> <div style="color: gray; font-family: RobotoCondensed-LightItalic; font-size: 10px;">${formatValue(getVal(dwDay(day, 'Wind_Speed'), '-'), 0)} km/h</div> </div> <div style="display: flex; align-items: center; margin: 0 4px;"> <div style="flex: 1;text-align: left;font-family: RobotoCondensed-Light; font-size: 11px;">Luftdruck</div> <div style="color: gray; font-family: RobotoCondensed-LightItalic; font-size: 10px;">${formatValue(getVal(dwDay(day, 'Pressure'), '-'), 0)} hPa</div> </div> <div style="display: flex; align-items: center; margin: 0 4px;"> <div style="flex: 1;text-align: left;font-family: RobotoCondensed-Light; font-size: 11px;">Schneefall</div> <div style="color: gray; font-family: RobotoCondensed-LightItalic; font-size: 10px;">${formatValue(getVal(dwDay(day, 'Snowline'), '-'), 0)} m</div> </div> <div style="display: flex; align-items: center; margin: 0 4px;"> <div style="flex: 1;text-align: left;font-family: RobotoCondensed-Light; font-size: 11px;">Sonnenaufgang</div> <div style="color: gray; font-family: RobotoCondensed-LightItalic; font-size: 10px;">${getVal(dwDay(day, 'Sun_in'), '-')}</div> </div> <div style="display: flex; align-items: center; margin: 0 4px;"> <div style="flex: 1;text-align: left;font-family: RobotoCondensed-Light; font-size: 11px;">Sonnenuntergang</div> <div style="color: gray; font-family: RobotoCondensed-LightItalic; font-size: 10px;">${getVal(dwDay(day, 'Sun_out'), '-')}</div> </div> `, listType: (day === 1) ? "text" : "buttonState", objectId: `${idDialogSchalter}${day}`, buttonStateValue: "true", "showValueLabel": "false" }; } // ===================== startup ===================== createData(); // ===================== original helper functions ===================== function getGradientColors(min, max, colorValArray) { let delta = max - min; let chromaColors = []; let chromaDomains = []; for (const item of colorValArray) { chromaColors.push(item.color); chromaDomains.push(item.value / delta); } let chroma = chromaJs.scale(chromaColors).domain(chromaDomains); return { getColorByValue: function (val) { if (val > max) return chroma(1).hex(); if (val < min) return chroma(0).hex(); return chroma(val / delta).hex(); }, getGradientWithOpacity: function (opacity) { colorValArray.forEach(item => { item.color = chromaJs(item.color).alpha(opacity / 100).hex(); }); return colorValArray; } }; } function mySetState(id, val, type, name, write = false) { if (existsState(id)) { setState(id, val, true); } else { createState(id, { name: name, type: type, read: true, write: write }, function () { setState(id, val, true); }); } } -
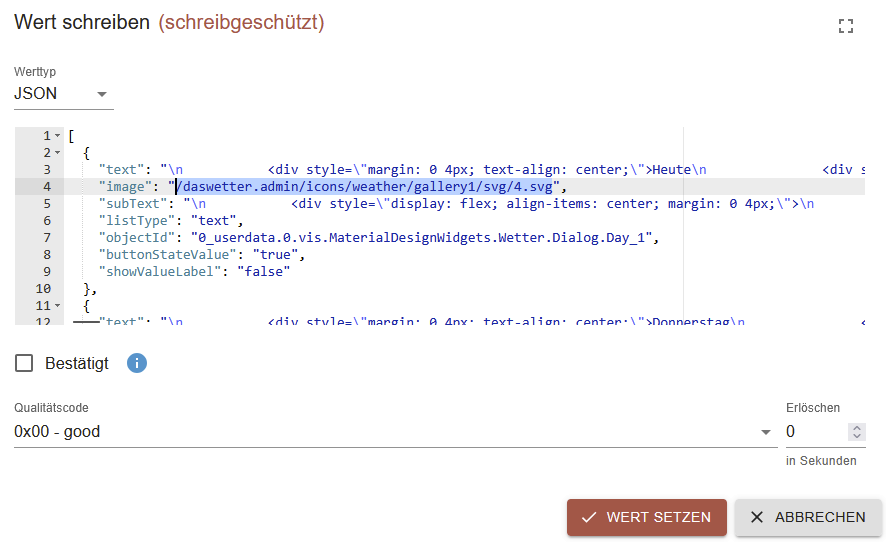
Ich sehe gerade, bei mir fehlen die Icons. Zum Beispiel:
/daswetter.admin/icons/weather/gallery1/svg/4.svgIm Dateimanager habe ich nur das:
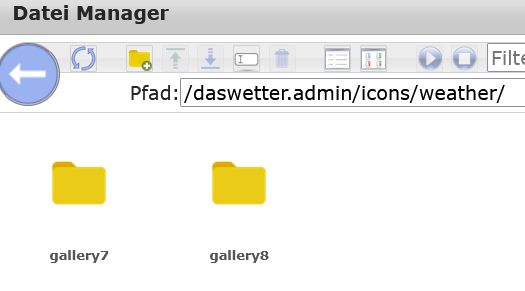
Wo bekomme ich die fehlenden Icons her?Edit:
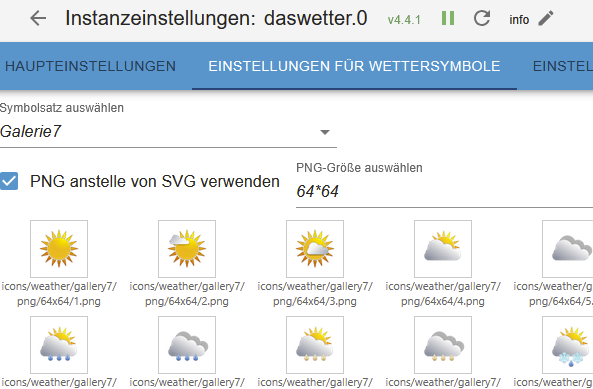
Ich habe natürlich die aktuelle Version des Adapters installiert. Und da scheint sich was an Filestruktur getan zu haben:
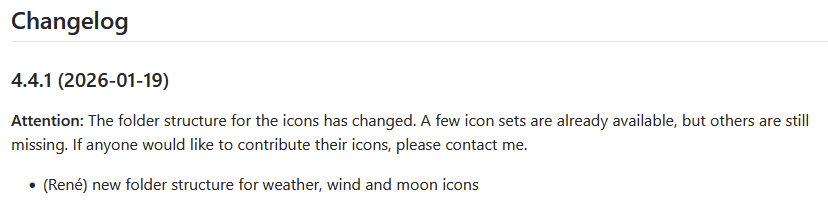
Das scheint bei euch noch gar nicht aufgeschlagen zu sein.
Puh, was muss jetzt geändert werden? -
Ich sehe gerade, bei mir fehlen die Icons. Zum Beispiel:
/daswetter.admin/icons/weather/gallery1/svg/4.svgIm Dateimanager habe ich nur das:
Wo bekomme ich die fehlenden Icons her?Edit:
Ich habe natürlich die aktuelle Version des Adapters installiert. Und da scheint sich was an Filestruktur getan zu haben:
Das scheint bei euch noch gar nicht aufgeschlagen zu sein.
Puh, was muss jetzt geändert werden?Keine Ahnung ob es schon ein aktuelles VIS Projekt gibt, glaube aber mal eher nicht.
Ich musste im VIS Editor auch die Pfade für die Symbole ändern, z.B. für heute auf:
daswetter.0.location_1.ForecastDaily.Day_1.symbol_URL
Das hieß ja vorher alles anders. Im Bild musste ich für jeden Tag das Symbol anpassen und das holt der sich ja von DasWetter und nicht von lokalen Dateien. Wenn du lokale nimmst, dann kann ich dir leider nicht helfen. Ich habe auch nur "gallery7" und "gallery8".
-
Keine Ahnung ob es schon ein aktuelles VIS Projekt gibt, glaube aber mal eher nicht.
Ich musste im VIS Editor auch die Pfade für die Symbole ändern, z.B. für heute auf:
daswetter.0.location_1.ForecastDaily.Day_1.symbol_URL
Das hieß ja vorher alles anders. Im Bild musste ich für jeden Tag das Symbol anpassen und das holt der sich ja von DasWetter und nicht von lokalen Dateien. Wenn du lokale nimmst, dann kann ich dir leider nicht helfen. Ich habe auch nur "gallery7" und "gallery8".
@JoJo58
Danke für deine Antwort.
Hmm, warum im Vis Editor ändern. Da sind doch nur die Datenpunkte mit Json vom 0_userdata.
Und die Datenpunkte um 0_Userdata werden doch vom Script gefüllt. Also müsste diese gallery1 vom Skript kommen.
Aber im ganzen Script steht nichts von gallery1.
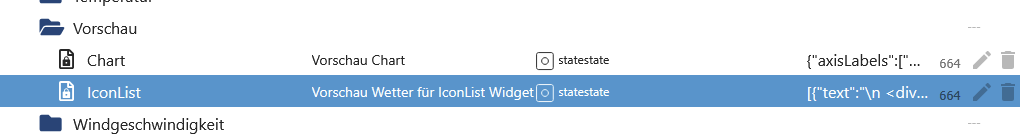
Ah, ich sehe gerade, das Script holt sich das Icon aus den Datenpunkt:
daswetter.0.location_1.ForecastDaily.Day_1.symbol_URLIch habe jetzt im Adapter die gallery7 eingestellt und nach Script Neustart steht es auch richtig in symbol_URL.
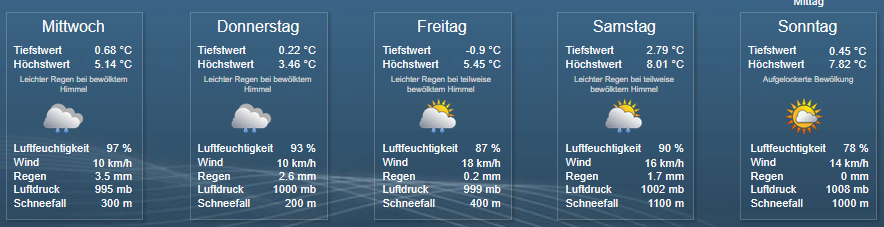
Jetzt sieht es besser aus:
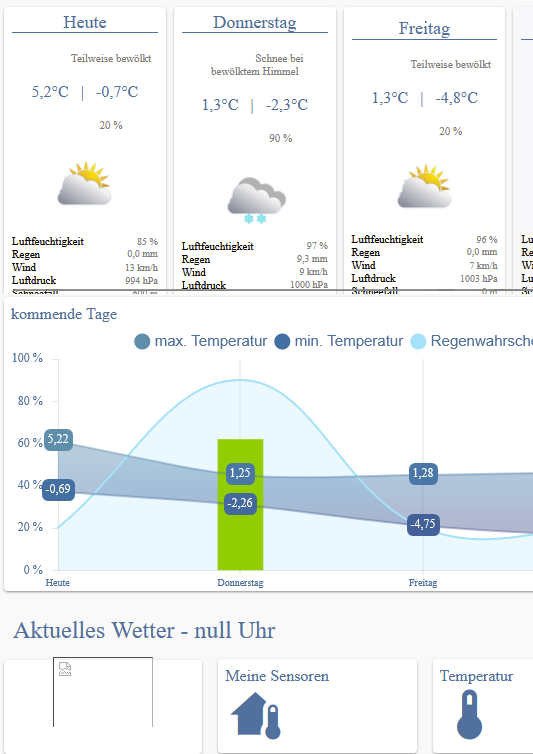
Es fehlt noch die Uhrzeit und noch ein Symbol. Das muss ich mir noch ansehen.
Jedenfalls sieht es bei dir noch ganz anders aus. Hast du das noch angepasst? Oder hab ich oder du ein anderes Vis Projekt?
-
@JoJo58
Danke für deine Antwort.
Hmm, warum im Vis Editor ändern. Da sind doch nur die Datenpunkte mit Json vom 0_userdata.
Und die Datenpunkte um 0_Userdata werden doch vom Script gefüllt. Also müsste diese gallery1 vom Skript kommen.
Aber im ganzen Script steht nichts von gallery1.
Ah, ich sehe gerade, das Script holt sich das Icon aus den Datenpunkt:
daswetter.0.location_1.ForecastDaily.Day_1.symbol_URLIch habe jetzt im Adapter die gallery7 eingestellt und nach Script Neustart steht es auch richtig in symbol_URL.
Jetzt sieht es besser aus:
Es fehlt noch die Uhrzeit und noch ein Symbol. Das muss ich mir noch ansehen.
Jedenfalls sieht es bei dir noch ganz anders aus. Hast du das noch angepasst? Oder hab ich oder du ein anderes Vis Projekt?
-
Moin, ich habe vor 2,5 Jahren eine View von @sigi234 https://forum.iobroker.net/topic/28717/vis-von-sigi234 übernommen und diese dann noch etwas angepasst.
@JoJo58 sagte in Material Design Widgets: Wetter View:
Moin, ich habe vor 2,5 Jahren eine View von @sigi234 https://forum.iobroker.net/topic/28717/vis-von-sigi234 übernommen und diese dann noch etwas angepasst.
Ok, das ist nicht das Script und View vom ersten Beitrag in diesem Thread. Dein Script kann mit meiner View nicht 100% funktionieren.
Ich hab jetzt mein altes Script auf die neue Struktur zum größten Teil angepasst.
-
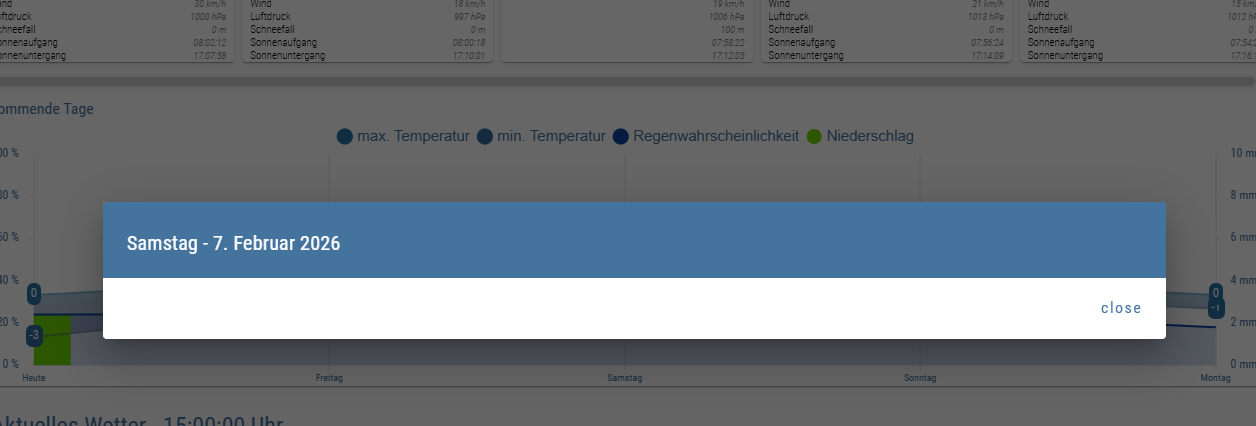
@jojo58 , Danke Dir und der KI …. das Skript funktioniert soweit. Ich verwende den DASWETTER Adapter in der Version 4.5.1
Aber in der VIS zickt noch etwas- wähle ich die Details für einen der Folgetage, dann bekomme ich folgende Fehlermeldung:
-
Hallo. Kann es sein, dass das bei GitHub hinterlegte Musterprojekt und die aktuelle DasWetter App Version 4..5.1respektive das Skript nicht zusammen passen?
Daher die Bitte, dass jemand mal sein VIS-Projekt zum Download zur Verfügung stellen?
-
@bongo , welche Version des Skriptes verwendest Du?
-
@bongo , welche Version des Skriptes verwendest Du?
@leonundjulie
Ich denke das Ursprungsscript von diesem Thread.
Das korrigierte Vis-Projekt ist von hier:
https://forum.iobroker.net/topic/32232/material-design-widgets-wetter-view/506Ich habe Script und Vis-Projekt angepasst. Aber die Details für einen der Folgetage funktioniert auch nicht. Das hat vorher auch nicht funktioniert. Die Views für die Details sind ja vorhanden. Aber da checke ich nicht wie die Views im Fenster angezeigt werden sollen. Vielleicht hat das Jemand wo es funktioniert und kann es zur Verfügung stellen.
Es scheint einen Bedarf für Script und Vis-Projekt zu geben. Deshalb stelle ich es hier bereit:
2026-02-05-Wetter2.zip
DasWetter.js -
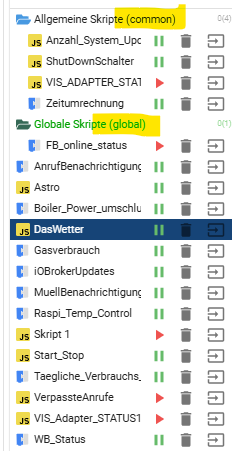
Wo legt Ihr das Skript hin - unter GLOAL oder unter COMMON?
-
Wo legt Ihr das Skript hin - unter GLOAL oder unter COMMON?
@leonundjulie common.
-
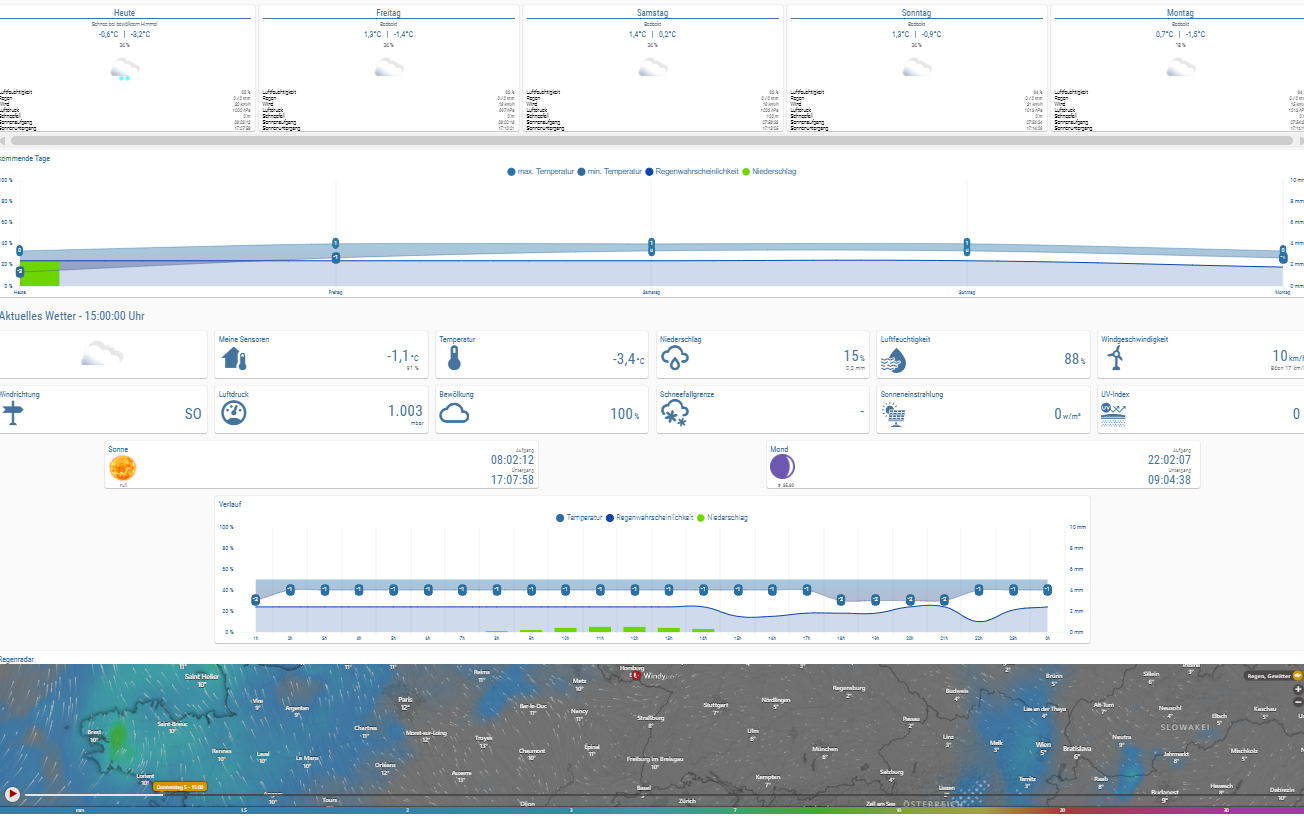
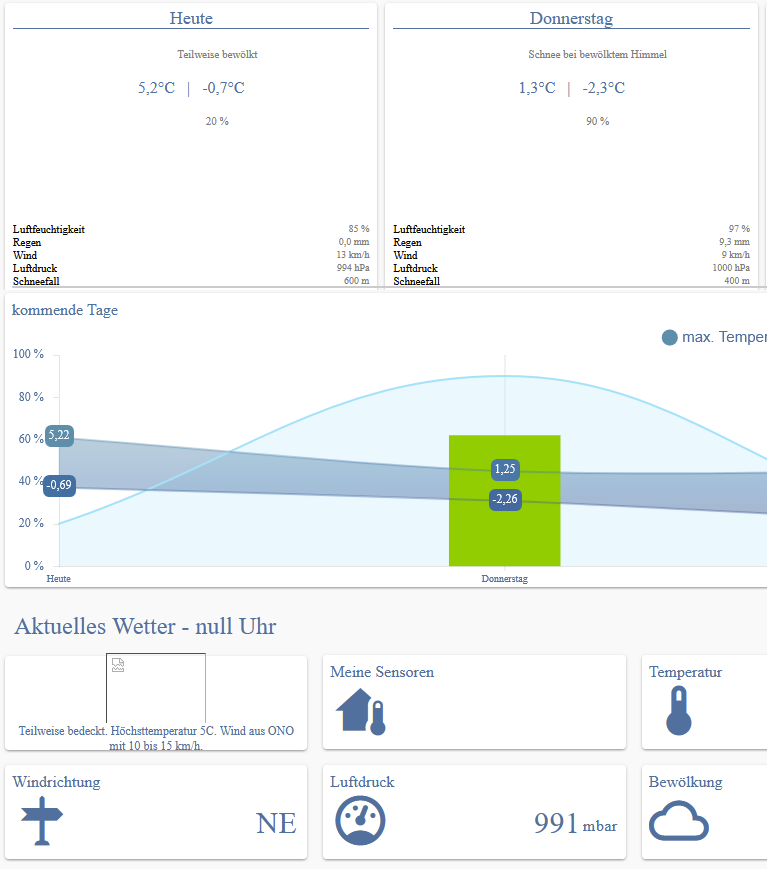
Danke @bongo , das hat viele Fehler rausgekickt. Jetzt sehe ich alle Werte HURA!
-
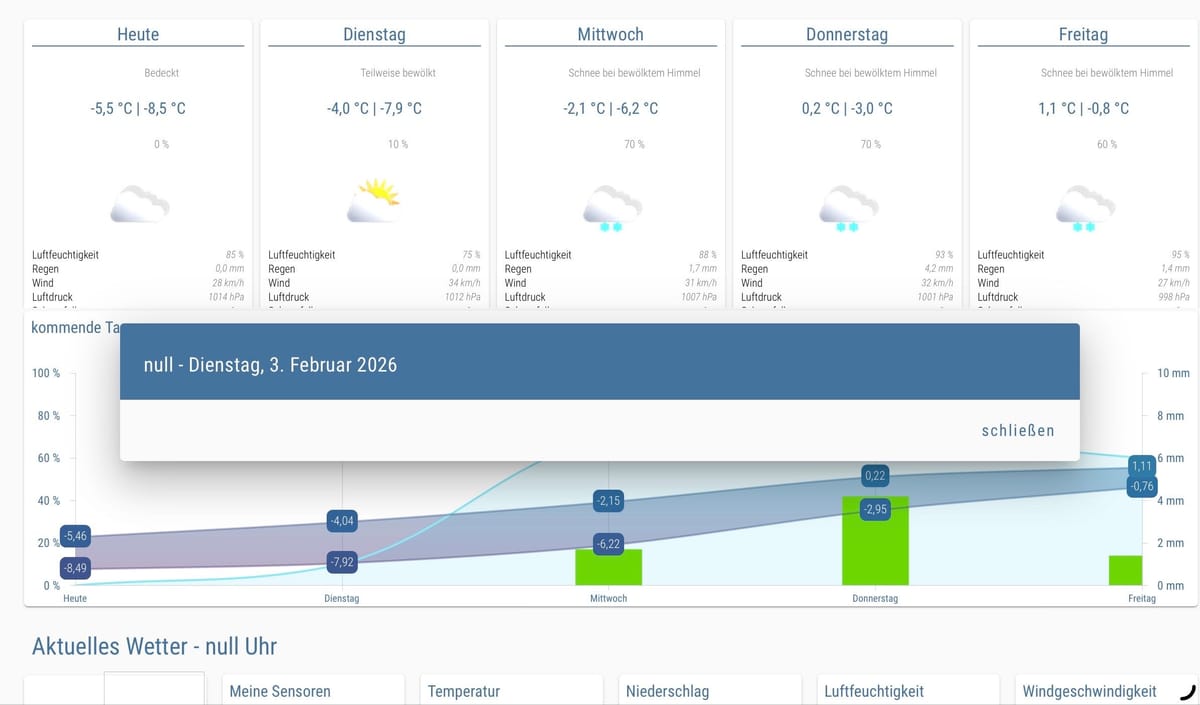
Mal schauen, ob ich die PopUp-Anzeige für die einzelnen Tage hinbekomme. Die Fenster/Views selber funktionieren.
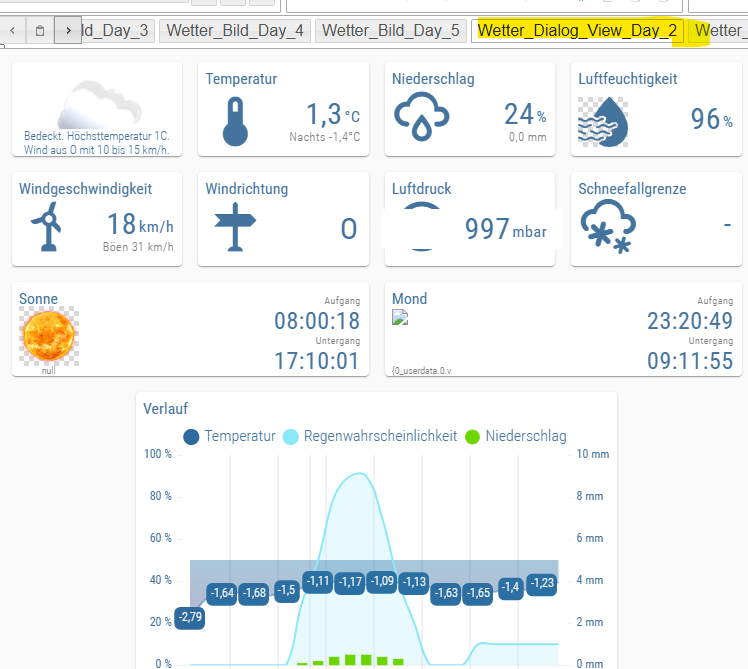
Nur deren Aufruf aus der Mainview nicht:
Villeicht kann @scrounger hier ja noch einen Tip geben.In dem Zusammenhang:
klicke ich auf Freitag, dann wird folgendes angezeigt.
Klicke ich auf Montag, dann wird folgendes angezeigt
 .
.Wahrscheinlich hierfür der Fehler im Skript. Während der Fehler für den Aufruf wahrscheinlich in der View zu suchen ist, oder?
-
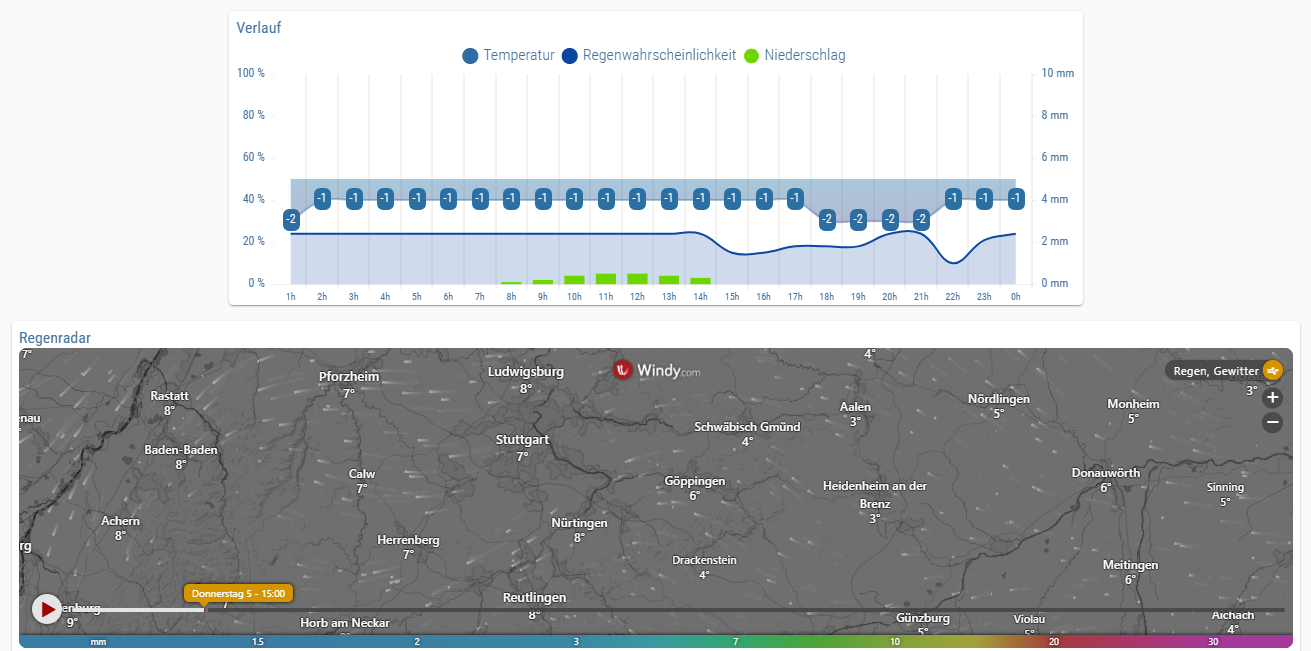
Nachbrenner: wie sage ich dem Regenradar wo ich wohne?
-
Nachbrenner: wie sage ich dem Regenradar wo ich wohne?
@leonundjulie
Das mit den Wochentagen war noch ein Fehler im Vis Projekt. Ich habe es korrigiert und die Projektdatei ausgetauscht:
https://forum.iobroker.net/topic/32232/material-design-widgets-wetter-view/697?_=1770299827824In der View Wetter_Regenradar kannst du im iFrame den Link anpassen:
https://embed.windy.com/embed2.html?lat=48.765&lon=11.424&zoom=9&level=surface&overlay=rain&menu=&message=true&marker=&calendar=&pressure=&type=map&location=coordinates&detail=&detailLat=48.737&detailLon=9.317&metricWind=default&metricTemp=default&radarRange=-1&detailLat=48.737&detailLon=9.317 tauscht du mit deinen Koordinaten.
Hey! Du scheinst an dieser Unterhaltung interessiert zu sein, hast aber noch kein Konto.
Hast du es satt, bei jedem Besuch durch die gleichen Beiträge zu scrollen? Wenn du dich für ein Konto anmeldest, kommst du immer genau dorthin zurück, wo du zuvor warst, und kannst dich über neue Antworten benachrichtigen lassen (entweder per E-Mail oder Push-Benachrichtigung). Du kannst auch Lesezeichen speichern und Beiträge positiv bewerten, um anderen Community-Mitgliedern deine Wertschätzung zu zeigen.
Mit deinem Input könnte dieser Beitrag noch besser werden 💗
Registrieren AnmeldenSupport us
420
Online33.0k
Benutzer83.4k
Themen1.3m
Beiträge