

Lastfluss, Energie animierte Gif
-
@liv-in-sky
ah, super - über den ersten Link mit dem gradient Angaben in Prozent lässt es sich nicht darstellen. Zumindest komme ich nach kurzem Nachdenken nicht drauf. Wenn du bei deinem 2. Link was findest - wäre spitze. Ich schau mir das auch an.Alternativ schau ich mir mal an, ob ich noch die Form etwas anders darstellen kann. Dann könnte es auch mit den Prozentangaben klappen...
evtl mit dieser seite: http://thenewcode.com/1155/Understanding-Linear-SVG-Gradients gleich das bild mit dem blau gelb - wenn man das irgendwie hindreht - und einen extra pfad für die untere linie macht - werd heute nicht mehr viel zeit haben - eher nächste woche mal
-
evtl mit dieser seite: http://thenewcode.com/1155/Understanding-Linear-SVG-Gradients gleich das bild mit dem blau gelb - wenn man das irgendwie hindreht - und einen extra pfad für die untere linie macht - werd heute nicht mehr viel zeit haben - eher nächste woche mal
@liv-in-sky
danke dir - aber das ist doch der gleiche Ansatz - oder?A diagonal gradient will therefore be created by setting y2 to a value of 100%: <linearGradient id="testbed4" y2="100%"> <stop stop-color="yellow" offset="0" /> <stop stop-color="blue" offset="0.5" /> <stop stop-color="black" offset="1" /> </linearGradient> Note that this does not create a 45° gradient, as the values are relative to the dimensions of the element -
@liv-in-sky
"Gefriggel hinbekommen... hab nur ein Problem... Der Farbverlauf passt nicht. Der Verlauf ist quasi über das gesamte Bild von oben nach unten bzw. links nach rechts. Daher hast du ja auch beim 2. Bild links die Linie ergänzt.Meine Koordinaten wären eigentlich so gewesen:
<path class="loading1011" d="
M 380 215
L 180 215
L 10 15
A 2.0 1 0 1 1 25 10
L 200 180
A 2.0 1 0 0 0 260 170
L 50 15
A 2.0 1 0 1 1 70 10
L 365 200
L380 200
"/>
Dann passiert aber folgendes:
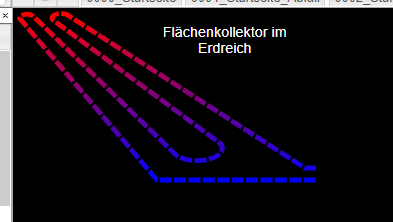
Da noch ne Idee, wie in der Linie der Farbverlauf erfolgt? Außer dass ich meine Geometrie um 90° drehen müsste...
-
sieht spitze aus. Schaue ich mir an.
Ich habe es eben noch mit
https://www.mediaevent.de/tutorial/svg-gradient.html#:~:text=SVG linearGradient – Farbverlauf,ohne sichtbare Grenzen ineinander verlaufen
ausprobiert - geht im Prinzip über die Prozentwerte, allerdings dann eben um eine Rotation um den Mittelpunkt.Entweder darüber:
<linearGradient id="rotate1" href="#diagonal" gradientTransform="rotate(66)" />oder
Um einen SVG-Gradient um sein Zentrum zu rotieren, müssen die Werte für x1, y1, x2 und y2 berechnet werden: Back to school und Sinus und Cosinus hervorkramen (bei 133°).

let pi = 133 * (Math.PI / 180);
let x1 = Math.round(50 + Math.sin(pi) * 50) / 100;           //0.87
let y1 = Math.round(50 + Math.cos(pi) * 50) / 100;           //0.16
let x2 = Math.round(50 + Math.sin(pi + Math.PI) * 50) / 100; //0.13
let y2 = Math.round(50 + Math.cos(pi + Math.PI) * 50) / 100; //0.84
habs aber noch nicht gut hinbekommen
-
danke dir - es passt jetzt mit deiner Hilfe
In den Übergängen passt es noch nicht ganz - aber ist mir egal :)<svg width="380" height="220" > <defs> <linearGradient id='MyGradient1011' x1="0.87" y1=0.16" x2=".13" y2=".84"> <stop offset='0%' stop-color=#dd1c00 /> <stop offset='100%' stop-color=#007fff /> </linearGradient> <linearGradient id="MyGradientFull1" x1="0%" y1="83%" x2="100%" y2="17%"> <stop offset="35%" style="stop-color:#dd1c00;stop-opacity:1.00" /> <stop offset="45%" style="stop-color:#874263;stop-opacity:1.00" /> <stop offset="50%" style="stop-color:#4c5da7;stop-opacity:1.00" /> <stop offset="60%" style="stop-color:#007fff;stop-opacity:1.00" /> </linearGradient> </defs> <g transform="scale(1)" style="stroke:url(#MyGradientFull1)" > <path class="loadingFull" d=" M 170 215 L 10 100 A 1.5 .65 0 1 1 30 95 L 195 180 A 1.5 .4 0 0 0 240 170 L 88 100 A 1.5 .65 0 1 1 110 95 L 365 180 L380 180 "/> </g> </svg> <style> .loadingFull { fill: none; border-radius: 50%; stroke-width: 6; stroke-dasharray: 15 3; animation: strokeAni 2s infinite linear; } @keyframes strokeAni { 0% { stroke-dashoffset: -40; } 100% { stroke-dashoffset: 0; } } </style> -
Ich habe mit eurer Vorarbeit und mit Hilfe von Chatgpt auch mal gearbeitet und bin sehr gut ans Ziel gekommen. Wollte nur mal Danke sagen ;)
Hier einfach mal 2 Linien. Ich bau mir nun ein schönes Skript für den Rest, das mir die Geschwindigkeit hoch und runter baut usw ;)
<svg width="99%" height="99%"> <defs> <linearGradient id="gradient1" x1="0%" y1="0%" x2="100%" y2="0%"> <stop offset="0%" style="stop-color: red;" /> <stop offset="100%" style="stop-color: yellow;" /> </linearGradient> </defs> <path class="loading0" d=" M5 5 L200 5 A15 15 0 0 1 215 20 L215 90 " fill="none" stroke="url(#gradient1)" stroke-width="5" stroke-dasharray="15 5" /> </svg> <svg width="99%" height="99%"> <defs> <linearGradient id="gradient2" x1="0%" y1="0%" x2="100%" y2="0%"> <stop offset="0%" style="stop-color: darkgreen;" /> <stop offset="100%" style="stop-color: lightgreen;" /> </linearGradient> </defs> <path class="loading1" d=" M5 305 L200 305 A15 15 0 0 1 215 320 L215 390 " fill="none" stroke="url(#gradient2)" stroke-width="5" stroke-dasharray="15 5" /> </svg> <style> .loading0 { stroke-dashoffset: 20; animation: strokeAni0 0.5s infinite linear; } .loading1 { stroke-dashoffset: 40; animation: strokeAni1 3s infinite linear; } @keyframes strokeAni0 { 0% { stroke-dashoffset: 20; } 100% { stroke-dashoffset: 0; } } @keyframes strokeAni1 { 0% { stroke-dashoffset: 40; } 100% { stroke-dashoffset: 0; } } </style> -
Hier noch das Skript, falls jemand über den thread stolpert. Durch den Aufruf alle 10 Sekunden gibt es in der Animation alle 10 Sekunden einen "Ruckler"
// Datenpunkt prüfen und erstellen
function pruefeUndErstelleDatenpunkt(datenpunkt) {
  if (!existsState(datenpunkt)) {
    createState(datenpunkt, {
      name: "PV Ertrag",
      type: "string",
      role: "text",
      read: true,
      write: false
    });
  }
}

// Start des Skripts
const ertragDatenpunkt = 'modbus.0.holdingRegisters.40068_PV_Leistung';
const ausgabedatenpunkt = '0_userdata.0.vis.pv.pvErtrag';

pruefeUndErstelleDatenpunkt(ausgabedatenpunkt);

// Funktion zum Erstellen des Pfads
function erstellePfad(ertrag) {
  const pfad = `M5 5 L200 5 A15 15 0 0 1 215 20 L215 90`;

  // Farbverlauf und Animationseigenschaften basierend auf dem Ertrag
  let farbverlauf, animationsKlasse, animationsDauer, animationFillMode;
  if (ertrag < 0) {
    farbverlauf = "url(#pv-gradient1)";
    animationsKlasse = "pv-animation";
    animationsDauer = `${(3 - (3 * ertrag / 6000)).toFixed(2)}s`;
    animationFillMode = "both";
  } else if (ertrag === 0) {
    farbverlauf = "black";
    animationsKlasse = "";
    animationsDauer = "0s";
    animationFillMode = "";
  } else if (ertrag > 0) {
    farbverlauf = "url(#pv-gradient2)";
    animationsKlasse = "pv-animation";
    animationsDauer = `${(3 - (3 * ertrag / 9000)).toFixed(2)}s`;
    animationFillMode = "both";
  } else {
    farbverlauf = "none";
    animationsKlasse = "";
    animationsDauer = "";
    animationFillMode = "";
  }

  // Pfad erstellen
  const pfadElement = `<path class="${animationsKlasse}" d="${pfad}" fill="none" stroke="${farbverlauf}" stroke-width="5" stroke-dasharray="15 5"></path>`;
  const styleCode = `<style>.pv-animation { stroke-dashoffset: 20; animation: pv-animation-ani ${animationsDauer} infinite linear ${animationFillMode}; } @keyframes pv-animation-ani { 0% { stroke-dashoffset: 20; } 100% { stroke-dashoffset: 0; } }</style>`;
  const svgHTML = `<svg width="99%" height="99%"><defs><linearGradient id="pv-gradient1" x1="0%" y1="0%" x2="100%" y2="0%"><stop offset="0%" style="stop-color: red;" /><stop offset="100%" style="stop-color: yellow;" /></linearGradient><linearGradient id="pv-gradient2" x1="0%" y1="0%" x2="100%" y2="0%"><stop offset="0%" style="stop-color: darkgreen;" /><stop offset="100%" style="stop-color: lightgreen;" /></linearGradient>${styleCode}</defs>${pfadElement}</svg>`;

  return svgHTML;
}

schedule("*/10 * * * * *", async function () {
  const ertrag = getState(ertragDatenpunkt).val;
  const pfadHTML = erstellePfad(ertrag);
  setState(ausgabedatenpunkt, pfadHTML);
});
Wenn ihr Pfade bauen wollt und wie ich keinen Schimmer habt , dann lege ich euch dringend den Chatbot eures Vertrauens ans Herzen. War super einfach so.
-
hab ein wenig gespielt
das ist rausgekommen - nehme aber an, du hast schon was gefunden:
oder:

können beide verkleinert werden
Ich hab mich hier mal rangehängt, da ich auch gerade versucht, den Stromfluss in iobroker abzubilden.
Ich habe dazu eine recht einfache svg-Linie hier aus dem Thread übernommen und ihn in meine Seite eingebaut - im Editor sieht das auch gut aus (= Linie ist animiert), aber wenn ich das Ganze dann aber in der Runtime anschaue, ist die Animation gestoppt, da wird die Linie komplett statisch dargestellt und ich weiß nicht warum.Es hat ein wenig gedauert, bis ich zu Großteilen verstanden habe, wie das mit der svg-Linie funktioniert und welche Werte welchen Einfluss haben... letztlich habe ich auf meiner Seite 5 Linien. In einer der Linien habe ich die vollständige Definition (incl. Farben, Geschwindigkeit etc) und in allen anderen nur die Linie + den class path, der das Aussehen steuert.
Das ist nur in "einer" der Linien hinterlegt
<svg width="40" height="100">
    <path class="stromOff"
    d = "M 5 5 L 5 95"
    />
</svg>

<style>
.stromOn {
    fill: none;
    stroke: green;
    border-radius: 50%;
    stroke-width: 5;
    stroke-dasharray: 5 5;
    animation: strokeAni 1.2s infinite linear;
}

.stromOff {
    fill: none;
    stroke: lightgrey;
    border-radius: 50%;
    stroke-width: 5;
    stroke-dasharray: 15 5;
    animation: strokeAni 0s infinite linear;
}


.inner {
    stroke: #c32e04;
    animation-direction: reverse;
}

@keyframes strokeAni {
    0% {stroke-dashoffset: 40;}
    100% {stroke-dashoffset: 0;}
}
</style>
und das ist (mit anderen Formen) in den anderen 4 Linien angegeben:
<svg width="160" height="150">
<path class="stromOn"
      d="
    M 5 140
    L 140 140
    L 140 5"  />
</svg>
Hat jemand hier eine Lösung, wie die Linie auch ausserhalb des editors animiert dargestellt wird?
btw: das ist schon der zweite Fall, bei dem die Darstellung im Editor mit der in der Runtime abweicht, beim vis-inventwo JSON ist mir ein ähnliche Situation begegnet. -
Ich hab mich hier mal rangehängt, da ich auch gerade versucht, den Stromfluss in iobroker abzubilden.
Ich habe dazu eine recht einfache svg-Linie hier aus dem Thread übernommen und ihn in meine Seite eingebaut - im Editor sieht das auch gut aus (= Linie ist animiert), aber wenn ich das Ganze dann aber in der Runtime anschaue, ist die Animation gestoppt, da wird die Linie komplett statisch dargestellt und ich weiß nicht warum.Es hat ein wenig gedauert, bis ich zu Großteilen verstanden habe, wie das mit der svg-Linie funktioniert und welche Werte welchen Einfluss haben... letztlich habe ich auf meiner Seite 5 Linien. In einer der Linien habe ich die vollständige Definition (incl. Farben, Geschwindigkeit etc) und in allen anderen nur die Linie + den class path, der das Aussehen steuert.
Das ist nur in "einer" der Linien hinterlegt
<svg width="40" height="100">
    <path class="stromOff"
    d = "M 5 5 L 5 95"
    />
</svg>

<style>
.stromOn {
    fill: none;
    stroke: green;
    border-radius: 50%;
    stroke-width: 5;
    stroke-dasharray: 5 5;
    animation: strokeAni 1.2s infinite linear;
}

.stromOff {
    fill: none;
    stroke: lightgrey;
    border-radius: 50%;
    stroke-width: 5;
    stroke-dasharray: 15 5;
    animation: strokeAni 0s infinite linear;
}


.inner {
    stroke: #c32e04;
    animation-direction: reverse;
}

@keyframes strokeAni {
    0% {stroke-dashoffset: 40;}
    100% {stroke-dashoffset: 0;}
}
</style>
und das ist (mit anderen Formen) in den anderen 4 Linien angegeben:
<svg width="160" height="150">
<path class="stromOn"
      d="
    M 5 140
    L 140 140
    L 140 5"  />
</svg>
Hat jemand hier eine Lösung, wie die Linie auch ausserhalb des editors animiert dargestellt wird?
btw: das ist schon der zweite Fall, bei dem die Darstellung im Editor mit der in der Runtime abweicht, beim vis-inventwo JSON ist mir ein ähnliche Situation begegnet.probiermal:
<style> .stromOn { fill: none; stroke: green; border-radius: 50%; stroke-width: 5; stroke-dasharray: 5 5; animation: strokeAni11 1.2s infinite linear; } .stromOff { fill: none; stroke: lightgrey; border-radius: 50%; stroke-width: 5; stroke-dasharray: 15 5; animation: strokeAni11 0.7s infinite linear; } .inner { stroke: #c32e04; animation-direction: reverse; } @keyframes strokeAni11 { 0% { stroke-dashoffset: -40; } 100% { stroke-dashoffset: 0; } } </style> <svg width="40" height="100"> <path class="stromOff" d = "M 5 5 L 5 95" /> </svg> -
@dominik_l
ich denke mal am einfachsten ist es, du machst dir ein blockly und der html teil , den du sonst im widget hast, schreibst du in einen datenpunkt (den du selbst auch anlegst) als variable. d.h. du setzt den html-teil im blockly so zusammen, wie du ihn brauchst
in der vis nimmst du dann ein html widget und darin als html teil nimmst du den datenpunkt über ein binding - also den datenpunkt in geschw. klammern z.b.
{0_userdata.0.test.test....}so kannst du alles im blockly setzen (je nach trigger) und dann in den dp schreiben, was dann in der vis aktualisiert wird
-
hier bin ich. wie bindet man denn Datenpunkt ein??
meinst du sowas : https://forum.iobroker.net/post/807124
-
meinst du sowas : https://forum.iobroker.net/post/807124
-
@liv-in-sky ja
ich habe immer noch nicht verstanden, was genau du machen willst - kannst du mit dem post was anfangen
-
ich habe immer noch nicht verstanden, was genau du machen willst - kannst du mit dem post was anfangen
@liv-in-sky
ok ;-)
habe deine Lastfluss soweit in meine Vis eingefügt. Jetzt möchte soll dieser nur angezeigt werden bzw. fliessen wenn was passiert. Also zum bsp. Ertrag der Solaranlage soll dann der Lastfluss in die Batterie angezeigt werden. Nachts soll dieser dann aber nicht angezeigt werden da ja kein Ertrag da ist.Gruß
-
@liv-in-sky
ok ;-)
habe deine Lastfluss soweit in meine Vis eingefügt. Jetzt möchte soll dieser nur angezeigt werden bzw. fliessen wenn was passiert. Also zum bsp. Ertrag der Solaranlage soll dann der Lastfluss in die Batterie angezeigt werden. Nachts soll dieser dann aber nicht angezeigt werden da ja kein Ertrag da ist.Gruß
also das ganze widget soll ausgeblendet werden ? der lastfluss unsichtbar
-
@liv-in-sky
ok ;-)
habe deine Lastfluss soweit in meine Vis eingefügt. Jetzt möchte soll dieser nur angezeigt werden bzw. fliessen wenn was passiert. Also zum bsp. Ertrag der Solaranlage soll dann der Lastfluss in die Batterie angezeigt werden. Nachts soll dieser dann aber nicht angezeigt werden da ja kein Ertrag da ist.Gruß
das kann jedes widget unter den eigenschaften "Sichtbarkeit"- dort kann ein dp angegeben werden, der das widget unstichbar macht
den adapter für lastfluss hast du schon getestet ?
-
das kann jedes widget unter den eigenschaften "Sichtbarkeit"- dort kann ein dp angegeben werden, der das widget unstichbar macht
den adapter für lastfluss hast du schon getestet ?
-
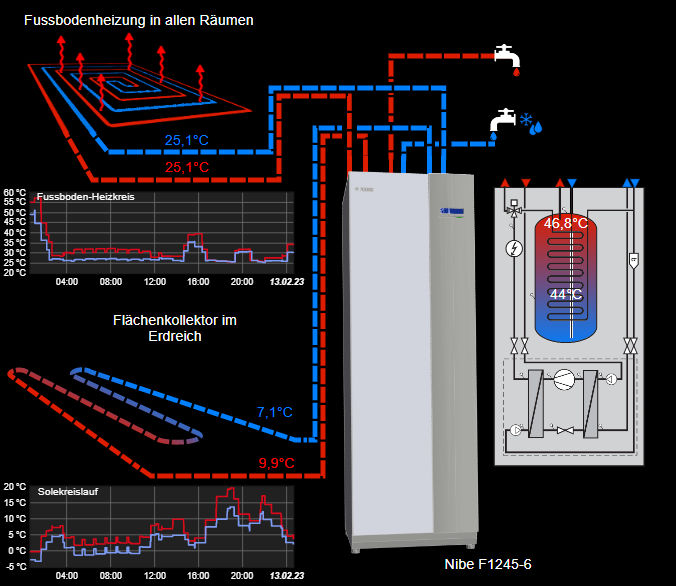
ja den adapter habe ich mir angeschaut. Finde ich nicht so toll.
Warum nimmst du nicht den 'Energiefluss-Erweitert'- Adapter, dsa kannst du doch alles einstellen und animieren wie du es brauchst?
Ich hatte am Anfang auch alles mit animierten GIF gemacht, und hab dann alles weggeschmissen weil der Energiefluss-Erweitert Adapter das alles super darstellen kann.
Lässt sich dann auch Problemlos in die VIS integrieren.
-
@liv-in-sky Super, danke für Deine tolle Arbeit! Ich habe das Problem, dass ich gleichzeitig zwei weitere Farben für Pfeile benötige. Wo kann ich das einstellen?
-
@liv-in-sky Super, danke für Deine tolle Arbeit! Ich habe das Problem, dass ich gleichzeitig zwei weitere Farben für Pfeile benötige. Wo kann ich das einstellen?
bischen wenig info - was genau (bitte posten) nutzt du ?
Hey! Du scheinst an dieser Unterhaltung interessiert zu sein, hast aber noch kein Konto.
Hast du es satt, bei jedem Besuch durch die gleichen Beiträge zu scrollen? Wenn du dich für ein Konto anmeldest, kommst du immer genau dorthin zurück, wo du zuvor warst, und kannst dich über neue Antworten benachrichtigen lassen (entweder per E-Mail oder Push-Benachrichtigung). Du kannst auch Lesezeichen speichern und Beiträge positiv bewerten, um anderen Community-Mitgliedern deine Wertschätzung zu zeigen.
Mit deinem Input könnte dieser Beitrag noch besser werden 💗
Registrieren AnmeldenSupport us
300
Online33.0k
Benutzer83.3k
Themen1.3m
Beiträge