

Admin, Influx und Javascript.. Nodejs - Memory Limits?
-
@ilovegym Wie gesagt: Erstmal OHNE limit versuchen. wenn es dann noch crasht dann versuchen. Ich müsste mal raussuchen wa es da so zu gab
ok, ich setz jetzt das Limit mal wieder zurueck.
Top sieht so aus:
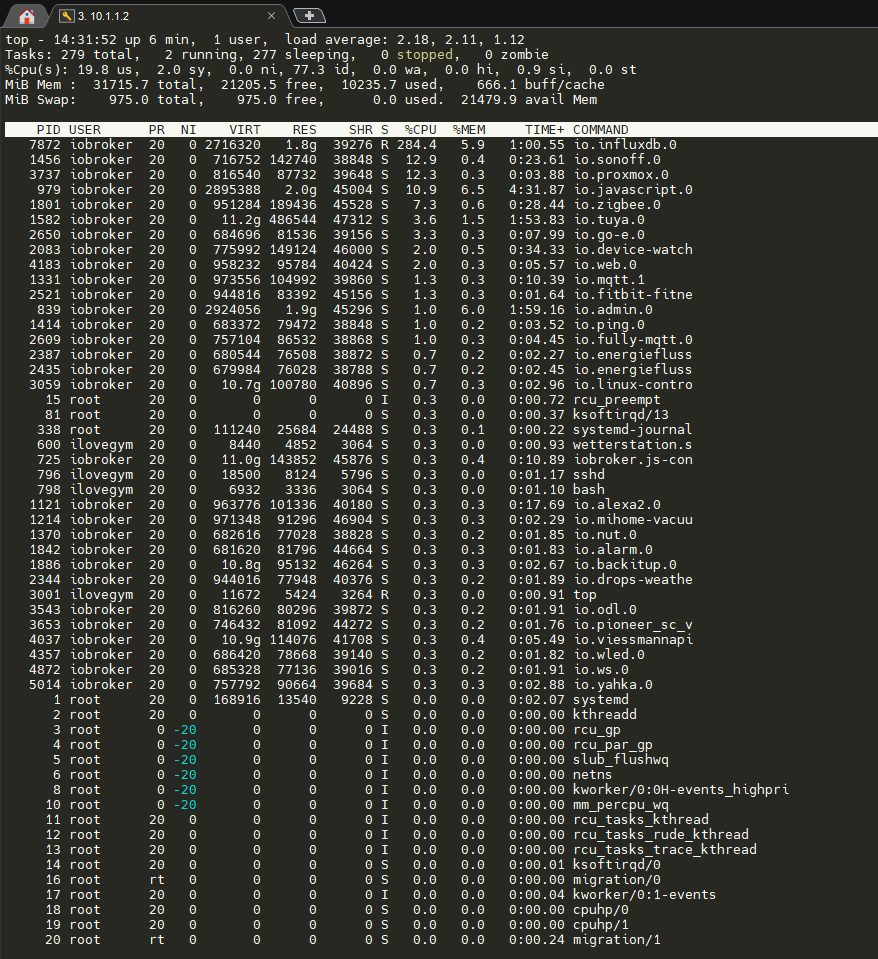
ilovegym@iobroker:/opt/iobroker$ free -m total used free shared buff/cache available Mem: 31715 11265 20175 0 666 20450 Swap: 974 0 974 ilovegym@iobroker:/opt/iobroker$ -
ok, ich setz jetzt das Limit mal wieder zurueck.
Top sieht so aus:
ilovegym@iobroker:/opt/iobroker$ free -m total used free shared buff/cache available Mem: 31715 11265 20175 0 666 20450 Swap: 974 0 974 ilovegym@iobroker:/opt/iobroker$@ilovegym Dann kurz zur übersetzung:
Das System hast 32GB RAM und 11 GB sind aktuell "wirklich genutzt". nochmal 666 MB werden für caches genutzt und 20GB sind frei.
Oft ist der "buff/cache" ummeiniges höher weil da zb Filesystem caches und so was drin sind, aber auch dann ist "available" das relevante.
ALso ja wenn du in dem Umfeld "OOMs" wie oen hast dann ggf limits höher setzen.
-
@ilovegym Dann kurz zur übersetzung:
Das System hast 32GB RAM und 11 GB sind aktuell "wirklich genutzt". nochmal 666 MB werden für caches genutzt und 20GB sind frei.
Oft ist der "buff/cache" ummeiniges höher weil da zb Filesystem caches und so was drin sind, aber auch dann ist "available" das relevante.
ALso ja wenn du in dem Umfeld "OOMs" wie oen hast dann ggf limits höher setzen.
ja Danke fuer den schnellen Support!
Ram ist ja genug da, aber die OOMs kommen vom io.admin, wenn ich in den Objects einen Baum mit mehr als 1500 Objekten (Zigbee.0.*) markiere und mit Influx loggen moechte.. filtere da schon.. :-) alles waeren ca 5000 Objekte, da kackt er gleich ab..Hab jetzt auf 8192 beim admin gesetzt.. und beim Influx auch..
Der Objects-Browser von Admin V6.x ist sowieso irgendwie anders, auf dem Ipad / Iphone bekomme ich den gar nicht mehr hin, da kommt der Spinner eiert sich tot.. Egal ob mit Safari, Chrom, Firefox oder Edge..
In der Browserconsole seh ich, dass er den Baum geladen hat, aber dann mit einem Timeout endet.. anscheinend zuviel des guten..Am Desktop-Rechner (Intel I9, Windows 11, Chrome Browser) funktionierts einwandfrei. Daher versuche ich mein System gerade etwas zu optimieren, wo es geht.. um den Datenansturm gerecht zu werden..
hmpfff... gerade 210 Objects mit Influx markieren wollen... und wieder.. obwohl Admin auf 8192 steht:
2023-10-23 15:56:02.372  - error: host.iobroker Caught by controller[0]: <--- Last few GCs --->
2023-10-23 15:56:02.373  - error: host.iobroker Caught by controller[0]: [21275:0x5d79680]  4634854 ms: Scavenge (reduce) 4006.4 (4086.8) -> 4006.3 (4087.6) MB, 22.3 / 0.0 ms  (average mu = 0.341, current mu = 0.284) allocation failure;
2023-10-23 15:56:02.373  - error: host.iobroker Caught by controller[0]: [21275:0x5d79680]  4634966 ms: Scavenge (reduce) 4007.3 (4087.6) -> 4007.3 (4087.6) MB, 22.1 / 0.0 ms  (average mu = 0.341, current mu = 0.284) allocation failure;
2023-10-23 15:56:02.373  - error: host.iobroker Caught by controller[0]: [21275:0x5d79680]  4634992 ms: Scavenge (reduce) 4007.3 (4087.6) -> 4007.2 (4088.6) MB, 22.0 / 0.0 ms  (average mu = 0.341, current mu = 0.284) allocation failure;
2023-10-23 15:56:02.373  - error: host.iobroker Caught by controller[0]: <--- JS stacktrace --->
2023-10-23 15:56:02.373  - error: host.iobroker Caught by controller[0]: FATAL ERROR: Ineffective mark-compacts near heap limit Allocation failed - JavaScript heap out of memory
2023-10-23 15:56:02.373  - error: host.iobroker Caught by controller[1]:  1: 0xb85bc0 node::Abort() [io.admin.0]
2023-10-23 15:56:02.373  - error: host.iobroker Caught by controller[2]:  2: 0xa94834  [io.admin.0]
2023-10-23 15:56:02.374  - error: host.iobroker Caught by controller[3]:  3: 0xd66d10 v8::Utils::ReportOOMFailure(v8::internal::Isolate*, char const*, bool) [io.admin.0]
2023-10-23 15:56:02.374  - error: host.iobroker Caught by controller[4]:  4: 0xd670b7 v8::internal::V8::FatalProcessOutOfMemory(v8::internal::Isolate*, char const*, bool) [io.admin.0]
2023-10-23 15:56:02.374  - error: host.iobroker Caught by controller[5]:  5: 0xf447c5  [io.admin.0]
2023-10-23 15:56:02.374  - error: host.iobroker Caught by controller[6]:  6: 0xf456c8 v8::internal::Heap::RecomputeLimits(v8::internal::GarbageCollector) [io.admin.0]
2023-10-23 15:56:02.374  - error: host.iobroker Caught by controller[7]:  7: 0xf55bd3  [io.admin.0]
2023-10-23 15:56:02.374  - error: host.iobroker Caught by controller[8]:  8: 0xf56a48 v8::internal::Heap::CollectGarbage(v8::internal::AllocationSpace, v8::internal::GarbageCollectionReason, v8::GCCallbackFlags) [io.admin.0]
2023-10-23 15:56:02.374  - error: host.iobroker Caught by controller[9]:  9: 0xf313ae v8::internal::HeapAllocator::AllocateRawWithLightRetrySlowPath(int, v8::internal::AllocationType, v8::internal::AllocationOrigin, v8::internal::AllocationAlignment) [io.admin.0]
2023-10-23 15:56:02.375  - error: host.iobroker Caught by controller[10]: 10: 0xf32777 v8::internal::HeapAllocator::AllocateRawWithRetryOrFailSlowPath(int, v8::internal::AllocationType, v8::internal::AllocationOrigin, v8::internal::AllocationAlignment) [io.admin.0]
2023-10-23 15:56:02.375  - error: host.iobroker Caught by controller[11]: 11: 0xf12cc0 v8::internal::Factory::AllocateRaw(int, v8::internal::AllocationType, v8::internal::AllocationAlignment) [io.admin.0]
2023-10-23 15:56:02.375  - error: host.iobroker Caught by controller[12]: 12: 0xf0a28c v8::internal::FactoryBase<v8::internal::Factory>::AllocateRawArray(int, v8::internal::AllocationType) [io.admin.0]
2023-10-23 15:56:02.375  - error: host.iobroker Caught by controller[13]: 13: 0xf0a405 v8::internal::FactoryBase<v8::internal::Factory>::NewFixedArrayWithFiller(v8::internal::Handle<v8::internal::Map>, int, v8::internal::Handle<v8::internal::Oddball>, v8::internal::AllocationType) [io.admin.0]
2023-10-23 15:56:02.375  - error: host.iobroker Caught by controller[14]: 14: 0x11c546e v8::internal::MaybeHandle<v8::internal::OrderedHashMap> v8::internal::OrderedHashTable<v8::internal::OrderedHashMap, 2>::Allocate<v8::internal::Isolate>(v8::internal::Isolate*, int, v8::internal::AllocationType) [io.admin.0]
2023-10-23 15:56:02.375  - error: host.iobroker Caught by controller[15]: 15: 0x11c5523 v8::internal::MaybeHandle<v8::internal::OrderedHashMap> v8::internal::OrderedHashTable<v8::internal::OrderedHashMap, 2>::Rehash<v8::internal::Isolate>(v8::internal::Isolate*, v8::internal::Handle<v8::internal::OrderedHashMap>, int) [io.admin.0]
2023-10-23 15:56:02.375  - error: host.iobroker Caught by controller[16]: 16: 0x12cf86d v8::internal::Runtime_MapGrow(int, unsigned long*, v8::internal::Isolate*) [io.admin.0]
2023-10-23 15:56:02.376  - error: host.iobroker Caught by controller[17]: 17: 0x1705b39  [io.admin.0]
2023-10-23 15:56:02.376  - warn: host.iobroker instance system.adapter.admin.0 terminated due to SIGABRT
2023-10-23 15:56:02.376  - info: host.iobroker instance system.adapter.admin.0 terminated with code null ()
2023-10-23 15:56:02.376  - info: host.iobroker Restart adapter system.adapter.admin.0 because enabled
2023-10-23 15:56:06.700  - info: influxdb.0 (63062) Store 440 buffered influxDB history points
2023-10-23 15:56:06.700  - info: influxdb.0 (63062) Store 440 buffered influxDB history points
2023-10-23 15:56:09.890  - info: tuya.0 (1582) 38338871500291d6d932: Error on Reconnect (1): connection timed out
2023-10-23 15:56:10.212  - info: javascript.0 (15774) script.js.common.Nuki.mqtt2log: NUKI Hub WT: Querying lock state: Querying lock state: Querying lock state: unlocked
2023-10-23 15:56:09.890  - info: tuya.0 (1582) 38338871500291d6d932: Error on Reconnect (1): connection timed out
Ich leg jetzt mal n Issue beim Admin Adapter an... das ist doch nix.. :(
-
ja Danke fuer den schnellen Support!
Ram ist ja genug da, aber die OOMs kommen vom io.admin, wenn ich in den Objects einen Baum mit mehr als 1500 Objekten (Zigbee.0.*) markiere und mit Influx loggen moechte.. filtere da schon.. :-) alles waeren ca 5000 Objekte, da kackt er gleich ab..Hab jetzt auf 8192 beim admin gesetzt.. und beim Influx auch..
Der Objects-Browser von Admin V6.x ist sowieso irgendwie anders, auf dem Ipad / Iphone bekomme ich den gar nicht mehr hin, da kommt der Spinner eiert sich tot.. Egal ob mit Safari, Chrom, Firefox oder Edge..
In der Browserconsole seh ich, dass er den Baum geladen hat, aber dann mit einem Timeout endet.. anscheinend zuviel des guten..Am Desktop-Rechner (Intel I9, Windows 11, Chrome Browser) funktionierts einwandfrei. Daher versuche ich mein System gerade etwas zu optimieren, wo es geht.. um den Datenansturm gerecht zu werden..
hmpfff... gerade 210 Objects mit Influx markieren wollen... und wieder.. obwohl Admin auf 8192 steht:
2023-10-23 15:56:02.372  - error: host.iobroker Caught by controller[0]: <--- Last few GCs --->
2023-10-23 15:56:02.373  - error: host.iobroker Caught by controller[0]: [21275:0x5d79680]  4634854 ms: Scavenge (reduce) 4006.4 (4086.8) -> 4006.3 (4087.6) MB, 22.3 / 0.0 ms  (average mu = 0.341, current mu = 0.284) allocation failure;
2023-10-23 15:56:02.373  - error: host.iobroker Caught by controller[0]: [21275:0x5d79680]  4634966 ms: Scavenge (reduce) 4007.3 (4087.6) -> 4007.3 (4087.6) MB, 22.1 / 0.0 ms  (average mu = 0.341, current mu = 0.284) allocation failure;
2023-10-23 15:56:02.373  - error: host.iobroker Caught by controller[0]: [21275:0x5d79680]  4634992 ms: Scavenge (reduce) 4007.3 (4087.6) -> 4007.2 (4088.6) MB, 22.0 / 0.0 ms  (average mu = 0.341, current mu = 0.284) allocation failure;
2023-10-23 15:56:02.373  - error: host.iobroker Caught by controller[0]: <--- JS stacktrace --->
2023-10-23 15:56:02.373  - error: host.iobroker Caught by controller[0]: FATAL ERROR: Ineffective mark-compacts near heap limit Allocation failed - JavaScript heap out of memory
2023-10-23 15:56:02.373  - error: host.iobroker Caught by controller[1]:  1: 0xb85bc0 node::Abort() [io.admin.0]
2023-10-23 15:56:02.373  - error: host.iobroker Caught by controller[2]:  2: 0xa94834  [io.admin.0]
2023-10-23 15:56:02.374  - error: host.iobroker Caught by controller[3]:  3: 0xd66d10 v8::Utils::ReportOOMFailure(v8::internal::Isolate*, char const*, bool) [io.admin.0]
2023-10-23 15:56:02.374  - error: host.iobroker Caught by controller[4]:  4: 0xd670b7 v8::internal::V8::FatalProcessOutOfMemory(v8::internal::Isolate*, char const*, bool) [io.admin.0]
2023-10-23 15:56:02.374  - error: host.iobroker Caught by controller[5]:  5: 0xf447c5  [io.admin.0]
2023-10-23 15:56:02.374  - error: host.iobroker Caught by controller[6]:  6: 0xf456c8 v8::internal::Heap::RecomputeLimits(v8::internal::GarbageCollector) [io.admin.0]
2023-10-23 15:56:02.374  - error: host.iobroker Caught by controller[7]:  7: 0xf55bd3  [io.admin.0]
2023-10-23 15:56:02.374  - error: host.iobroker Caught by controller[8]:  8: 0xf56a48 v8::internal::Heap::CollectGarbage(v8::internal::AllocationSpace, v8::internal::GarbageCollectionReason, v8::GCCallbackFlags) [io.admin.0]
2023-10-23 15:56:02.374  - error: host.iobroker Caught by controller[9]:  9: 0xf313ae v8::internal::HeapAllocator::AllocateRawWithLightRetrySlowPath(int, v8::internal::AllocationType, v8::internal::AllocationOrigin, v8::internal::AllocationAlignment) [io.admin.0]
2023-10-23 15:56:02.375  - error: host.iobroker Caught by controller[10]: 10: 0xf32777 v8::internal::HeapAllocator::AllocateRawWithRetryOrFailSlowPath(int, v8::internal::AllocationType, v8::internal::AllocationOrigin, v8::internal::AllocationAlignment) [io.admin.0]
2023-10-23 15:56:02.375  - error: host.iobroker Caught by controller[11]: 11: 0xf12cc0 v8::internal::Factory::AllocateRaw(int, v8::internal::AllocationType, v8::internal::AllocationAlignment) [io.admin.0]
2023-10-23 15:56:02.375  - error: host.iobroker Caught by controller[12]: 12: 0xf0a28c v8::internal::FactoryBase<v8::internal::Factory>::AllocateRawArray(int, v8::internal::AllocationType) [io.admin.0]
2023-10-23 15:56:02.375  - error: host.iobroker Caught by controller[13]: 13: 0xf0a405 v8::internal::FactoryBase<v8::internal::Factory>::NewFixedArrayWithFiller(v8::internal::Handle<v8::internal::Map>, int, v8::internal::Handle<v8::internal::Oddball>, v8::internal::AllocationType) [io.admin.0]
2023-10-23 15:56:02.375  - error: host.iobroker Caught by controller[14]: 14: 0x11c546e v8::internal::MaybeHandle<v8::internal::OrderedHashMap> v8::internal::OrderedHashTable<v8::internal::OrderedHashMap, 2>::Allocate<v8::internal::Isolate>(v8::internal::Isolate*, int, v8::internal::AllocationType) [io.admin.0]
2023-10-23 15:56:02.375  - error: host.iobroker Caught by controller[15]: 15: 0x11c5523 v8::internal::MaybeHandle<v8::internal::OrderedHashMap> v8::internal::OrderedHashTable<v8::internal::OrderedHashMap, 2>::Rehash<v8::internal::Isolate>(v8::internal::Isolate*, v8::internal::Handle<v8::internal::OrderedHashMap>, int) [io.admin.0]
2023-10-23 15:56:02.375  - error: host.iobroker Caught by controller[16]: 16: 0x12cf86d v8::internal::Runtime_MapGrow(int, unsigned long*, v8::internal::Isolate*) [io.admin.0]
2023-10-23 15:56:02.376  - error: host.iobroker Caught by controller[17]: 17: 0x1705b39  [io.admin.0]
2023-10-23 15:56:02.376  - warn: host.iobroker instance system.adapter.admin.0 terminated due to SIGABRT
2023-10-23 15:56:02.376  - info: host.iobroker instance system.adapter.admin.0 terminated with code null ()
2023-10-23 15:56:02.376  - info: host.iobroker Restart adapter system.adapter.admin.0 because enabled
2023-10-23 15:56:02.372  - error: host.iobroker Caught by controller[0]: <--- Last few GCs --->
2023-10-23 15:56:02.373  - error: host.iobroker Caught by controller[0]: [21275:0x5d79680]  4634854 ms: Scavenge (reduce) 4006.4 (4086.8) -> 4006.3 (4087.6) MB, 22.3 / 0.0 ms  (average mu = 0.341, current mu = 0.284) allocation failure;
2023-10-23 15:56:02.373  - error: host.iobroker Caught by controller[0]: [21275:0x5d79680]  4634966 ms: Scavenge (reduce) 4007.3 (4087.6) -> 4007.3 (4087.6) MB, 22.1 / 0.0 ms  (average mu = 0.341, current mu = 0.284) allocation failure;
2023-10-23 15:56:02.373  - error: host.iobroker Caught by controller[0]: [21275:0x5d79680]  4634992 ms: Scavenge (reduce) 4007.3 (4087.6) -> 4007.2 (4088.6) MB, 22.0 / 0.0 ms  (average mu = 0.341, current mu = 0.284) allocation failure;
2023-10-23 15:56:02.373  - error: host.iobroker Caught by controller[0]: <--- JS stacktrace --->
2023-10-23 15:56:02.373  - error: host.iobroker Caught by controller[0]: FATAL ERROR: Ineffective mark-compacts near heap limit Allocation failed - JavaScript heap out of memory
2023-10-23 15:56:02.373  - error: host.iobroker Caught by controller[1]:  1: 0xb85bc0 node::Abort() [io.admin.0]
2023-10-23 15:56:02.373  - error: host.iobroker Caught by controller[2]:  2: 0xa94834  [io.admin.0]
2023-10-23 15:56:02.374  - error: host.iobroker Caught by controller[3]:  3: 0xd66d10 v8::Utils::ReportOOMFailure(v8::internal::Isolate*, char const*, bool) [io.admin.0]
2023-10-23 15:56:02.374  - error: host.iobroker Caught by controller[4]:  4: 0xd670b7 v8::internal::V8::FatalProcessOutOfMemory(v8::internal::Isolate*, char const*, bool) [io.admin.0]
2023-10-23 15:56:02.374  - error: host.iobroker Caught by controller[5]:  5: 0xf447c5  [io.admin.0]
2023-10-23 15:56:02.374  - error: host.iobroker Caught by controller[6]:  6: 0xf456c8 v8::internal::Heap::RecomputeLimits(v8::internal::GarbageCollector) [io.admin.0]
2023-10-23 15:56:02.374  - error: host.iobroker Caught by controller[7]:  7: 0xf55bd3  [io.admin.0]
2023-10-23 15:56:02.374  - error: host.iobroker Caught by controller[8]:  8: 0xf56a48 v8::internal::Heap::CollectGarbage(v8::internal::AllocationSpace, v8::internal::GarbageCollectionReason, v8::GCCallbackFlags) [io.admin.0]
2023-10-23 15:56:02.374  - error: host.iobroker Caught by controller[9]:  9: 0xf313ae v8::internal::HeapAllocator::AllocateRawWithLightRetrySlowPath(int, v8::internal::AllocationType, v8::internal::AllocationOrigin, v8::internal::AllocationAlignment) [io.admin.0]
2023-10-23 15:56:02.375  - error: host.iobroker Caught by controller[10]: 10: 0xf32777 v8::internal::HeapAllocator::AllocateRawWithRetryOrFailSlowPath(int, v8::internal::AllocationType, v8::internal::AllocationOrigin, v8::internal::AllocationAlignment) [io.admin.0]
2023-10-23 15:56:02.375  - error: host.iobroker Caught by controller[11]: 11: 0xf12cc0 v8::internal::Factory::AllocateRaw(int, v8::internal::AllocationType, v8::internal::AllocationAlignment) [io.admin.0]
2023-10-23 15:56:02.375  - error: host.iobroker Caught by controller[12]: 12: 0xf0a28c v8::internal::FactoryBase<v8::internal::Factory>::AllocateRawArray(int, v8::internal::AllocationType) [io.admin.0]
2023-10-23 15:56:02.375  - error: host.iobroker Caught by controller[13]: 13: 0xf0a405 v8::internal::FactoryBase<v8::internal::Factory>::NewFixedArrayWithFiller(v8::internal::Handle<v8::internal::Map>, int, v8::internal::Handle<v8::internal::Oddball>, v8::internal::AllocationType) [io.admin.0]
2023-10-23 15:56:02.375  - error: host.iobroker Caught by controller[14]: 14: 0x11c546e v8::internal::MaybeHandle<v8::internal::OrderedHashMap> v8::internal::OrderedHashTable<v8::internal::OrderedHashMap, 2>::Allocate<v8::internal::Isolate>(v8::internal::Isolate*, int, v8::internal::AllocationType) [io.admin.0]
2023-10-23 15:56:02.375  - error: host.iobroker Caught by controller[15]: 15: 0x11c5523 v8::internal::MaybeHandle<v8::internal::OrderedHashMap> v8::internal::OrderedHashTable<v8::internal::OrderedHashMap, 2>::Rehash<v8::internal::Isolate>(v8::internal::Isolate*, v8::internal::Handle<v8::internal::OrderedHashMap>, int) [io.admin.0]
2023-10-23 15:56:02.375  - error: host.iobroker Caught by controller[16]: 16: 0x12cf86d v8::internal::Runtime_MapGrow(int, unsigned long*, v8::internal::Isolate*) [io.admin.0]
2023-10-23 15:56:02.376  - error: host.iobroker Caught by controller[17]: 17: 0x1705b39  [io.admin.0]
2023-10-23 15:56:02.376  - warn: host.iobroker instance system.adapter.admin.0 terminated due to SIGABRT
2023-10-23 15:56:02.376  - info: host.iobroker instance system.adapter.admin.0 terminated with code null ()
2023-10-23 15:56:02.376  - info: host.iobroker Restart adapter system.adapter.admin.0 because enabled
2023-10-23 15:56:06.700  - info: influxdb.0 (63062) Store 440 buffered influxDB history points
2023-10-23 15:56:06.700  - info: influxdb.0 (63062) Store 440 buffered influxDB history points
2023-10-23 15:56:09.890  - info: tuya.0 (1582) 38338871500291d6d932: Error on Reconnect (1): connection timed out
2023-10-23 15:56:10.212  - info: javascript.0 (15774) script.js.common.Nuki.mqtt2log: NUKI Hub WT: Querying lock state: Querying lock state: Querying lock state: unlocked
2023-10-23 15:56:09.890  - info: tuya.0 (1582) 38338871500291d6d932: Error on Reconnect (1): connection timed out
Ich leg jetzt mal n Issue beim Admin Adapter an... das ist doch nix.. :(
@ilovegym sagte in Admin, Influx und Javascript.. Nodejs - Memory Limits?:
1500 Objekten (Zigbee.0.*) markiere und mit Influx loggen moechte.
Moin,
ich will ja niemanden sagen, was er machen soll, aber übertreibst Du das nicht etwas, da sind doch mindestens 2/3 an unnützen DP dabei, wieso sollte man die alle historisieren?
Selbst wenn es nur 5 DPs pro Gerät sind, hast Du 300 Zigbee Devices?VG
Bernd -
@ilovegym sagte in Admin, Influx und Javascript.. Nodejs - Memory Limits?:
1500 Objekten (Zigbee.0.*) markiere und mit Influx loggen moechte.
Moin,
ich will ja niemanden sagen, was er machen soll, aber übertreibst Du das nicht etwas, da sind doch mindestens 2/3 an unnützen DP dabei, wieso sollte man die alle historisieren?
Selbst wenn es nur 5 DPs pro Gerät sind, hast Du 300 Zigbee Devices?VG
Bernd@dp20eic
es sind 225 Zigbee Devices, 150 Devices beim Sonoff Adapter, 135 Devices im Tuya-Adapter...
ich versuch ja schon zu filtern ... das Problem ist, dass ich ja auch keine Datenpunkte mehr aus der history loeschen kann (also influx fuer den Datenpunkt deaktivieren), es sei denn, ich mach es einzeln..Hmpff soviel History DP hab ich auch gar nicht.. was mich wundert, ich hatte vorher den Unifi-Adapter noch mit 70000 Objekten drin, und das ging damals... und jetzt hab ich reduziert, und es geht nicht mehr..
hmm seltsam...
-
ja Danke fuer den schnellen Support!
Ram ist ja genug da, aber die OOMs kommen vom io.admin, wenn ich in den Objects einen Baum mit mehr als 1500 Objekten (Zigbee.0.*) markiere und mit Influx loggen moechte.. filtere da schon.. :-) alles waeren ca 5000 Objekte, da kackt er gleich ab..Hab jetzt auf 8192 beim admin gesetzt.. und beim Influx auch..
Der Objects-Browser von Admin V6.x ist sowieso irgendwie anders, auf dem Ipad / Iphone bekomme ich den gar nicht mehr hin, da kommt der Spinner eiert sich tot.. Egal ob mit Safari, Chrom, Firefox oder Edge..
In der Browserconsole seh ich, dass er den Baum geladen hat, aber dann mit einem Timeout endet.. anscheinend zuviel des guten..Am Desktop-Rechner (Intel I9, Windows 11, Chrome Browser) funktionierts einwandfrei. Daher versuche ich mein System gerade etwas zu optimieren, wo es geht.. um den Datenansturm gerecht zu werden..
hmpfff... gerade 210 Objects mit Influx markieren wollen... und wieder.. obwohl Admin auf 8192 steht:
2023-10-23 15:56:02.372  - error: host.iobroker Caught by controller[0]: <--- Last few GCs --->
2023-10-23 15:56:02.373  - error: host.iobroker Caught by controller[0]: [21275:0x5d79680]  4634854 ms: Scavenge (reduce) 4006.4 (4086.8) -> 4006.3 (4087.6) MB, 22.3 / 0.0 ms  (average mu = 0.341, current mu = 0.284) allocation failure;
2023-10-23 15:56:02.373  - error: host.iobroker Caught by controller[0]: [21275:0x5d79680]  4634966 ms: Scavenge (reduce) 4007.3 (4087.6) -> 4007.3 (4087.6) MB, 22.1 / 0.0 ms  (average mu = 0.341, current mu = 0.284) allocation failure;
2023-10-23 15:56:02.373  - error: host.iobroker Caught by controller[0]: [21275:0x5d79680]  4634992 ms: Scavenge (reduce) 4007.3 (4087.6) -> 4007.2 (4088.6) MB, 22.0 / 0.0 ms  (average mu = 0.341, current mu = 0.284) allocation failure;
2023-10-23 15:56:02.373  - error: host.iobroker Caught by controller[0]: <--- JS stacktrace --->
2023-10-23 15:56:02.373  - error: host.iobroker Caught by controller[0]: FATAL ERROR: Ineffective mark-compacts near heap limit Allocation failed - JavaScript heap out of memory
2023-10-23 15:56:02.373  - error: host.iobroker Caught by controller[1]:  1: 0xb85bc0 node::Abort() [io.admin.0]
2023-10-23 15:56:02.373  - error: host.iobroker Caught by controller[2]:  2: 0xa94834  [io.admin.0]
2023-10-23 15:56:02.374  - error: host.iobroker Caught by controller[3]:  3: 0xd66d10 v8::Utils::ReportOOMFailure(v8::internal::Isolate*, char const*, bool) [io.admin.0]
2023-10-23 15:56:02.374  - error: host.iobroker Caught by controller[4]:  4: 0xd670b7 v8::internal::V8::FatalProcessOutOfMemory(v8::internal::Isolate*, char const*, bool) [io.admin.0]
2023-10-23 15:56:02.374  - error: host.iobroker Caught by controller[5]:  5: 0xf447c5  [io.admin.0]
2023-10-23 15:56:02.374  - error: host.iobroker Caught by controller[6]:  6: 0xf456c8 v8::internal::Heap::RecomputeLimits(v8::internal::GarbageCollector) [io.admin.0]
2023-10-23 15:56:02.374  - error: host.iobroker Caught by controller[7]:  7: 0xf55bd3  [io.admin.0]
2023-10-23 15:56:02.374  - error: host.iobroker Caught by controller[8]:  8: 0xf56a48 v8::internal::Heap::CollectGarbage(v8::internal::AllocationSpace, v8::internal::GarbageCollectionReason, v8::GCCallbackFlags) [io.admin.0]
2023-10-23 15:56:02.374  - error: host.iobroker Caught by controller[9]:  9: 0xf313ae v8::internal::HeapAllocator::AllocateRawWithLightRetrySlowPath(int, v8::internal::AllocationType, v8::internal::AllocationOrigin, v8::internal::AllocationAlignment) [io.admin.0]
2023-10-23 15:56:02.375  - error: host.iobroker Caught by controller[10]: 10: 0xf32777 v8::internal::HeapAllocator::AllocateRawWithRetryOrFailSlowPath(int, v8::internal::AllocationType, v8::internal::AllocationOrigin, v8::internal::AllocationAlignment) [io.admin.0]
2023-10-23 15:56:02.375  - error: host.iobroker Caught by controller[11]: 11: 0xf12cc0 v8::internal::Factory::AllocateRaw(int, v8::internal::AllocationType, v8::internal::AllocationAlignment) [io.admin.0]
2023-10-23 15:56:02.375  - error: host.iobroker Caught by controller[12]: 12: 0xf0a28c v8::internal::FactoryBase<v8::internal::Factory>::AllocateRawArray(int, v8::internal::AllocationType) [io.admin.0]
2023-10-23 15:56:02.375  - error: host.iobroker Caught by controller[13]: 13: 0xf0a405 v8::internal::FactoryBase<v8::internal::Factory>::NewFixedArrayWithFiller(v8::internal::Handle<v8::internal::Map>, int, v8::internal::Handle<v8::internal::Oddball>, v8::internal::AllocationType) [io.admin.0]
2023-10-23 15:56:02.375  - error: host.iobroker Caught by controller[14]: 14: 0x11c546e v8::internal::MaybeHandle<v8::internal::OrderedHashMap> v8::internal::OrderedHashTable<v8::internal::OrderedHashMap, 2>::Allocate<v8::internal::Isolate>(v8::internal::Isolate*, int, v8::internal::AllocationType) [io.admin.0]
2023-10-23 15:56:02.375  - error: host.iobroker Caught by controller[15]: 15: 0x11c5523 v8::internal::MaybeHandle<v8::internal::OrderedHashMap> v8::internal::OrderedHashTable<v8::internal::OrderedHashMap, 2>::Rehash<v8::internal::Isolate>(v8::internal::Isolate*, v8::internal::Handle<v8::internal::OrderedHashMap>, int) [io.admin.0]
2023-10-23 15:56:02.375  - error: host.iobroker Caught by controller[16]: 16: 0x12cf86d v8::internal::Runtime_MapGrow(int, unsigned long*, v8::internal::Isolate*) [io.admin.0]
2023-10-23 15:56:02.376  - error: host.iobroker Caught by controller[17]: 17: 0x1705b39  [io.admin.0]
2023-10-23 15:56:02.376  - warn: host.iobroker instance system.adapter.admin.0 terminated due to SIGABRT
2023-10-23 15:56:02.376  - info: host.iobroker instance system.adapter.admin.0 terminated with code null ()
2023-10-23 15:56:02.376  - info: host.iobroker Restart adapter system.adapter.admin.0 because enabled
2023-10-23 15:56:02.372  - error: host.iobroker Caught by controller[0]: <--- Last few GCs --->
2023-10-23 15:56:02.373  - error: host.iobroker Caught by controller[0]: [21275:0x5d79680]  4634854 ms: Scavenge (reduce) 4006.4 (4086.8) -> 4006.3 (4087.6) MB, 22.3 / 0.0 ms  (average mu = 0.341, current mu = 0.284) allocation failure;
2023-10-23 15:56:02.373  - error: host.iobroker Caught by controller[0]: [21275:0x5d79680]  4634966 ms: Scavenge (reduce) 4007.3 (4087.6) -> 4007.3 (4087.6) MB, 22.1 / 0.0 ms  (average mu = 0.341, current mu = 0.284) allocation failure;
2023-10-23 15:56:02.373  - error: host.iobroker Caught by controller[0]: [21275:0x5d79680]  4634992 ms: Scavenge (reduce) 4007.3 (4087.6) -> 4007.2 (4088.6) MB, 22.0 / 0.0 ms  (average mu = 0.341, current mu = 0.284) allocation failure;
2023-10-23 15:56:02.373  - error: host.iobroker Caught by controller[0]: <--- JS stacktrace --->
2023-10-23 15:56:02.373  - error: host.iobroker Caught by controller[0]: FATAL ERROR: Ineffective mark-compacts near heap limit Allocation failed - JavaScript heap out of memory
2023-10-23 15:56:02.373  - error: host.iobroker Caught by controller[1]:  1: 0xb85bc0 node::Abort() [io.admin.0]
2023-10-23 15:56:02.373  - error: host.iobroker Caught by controller[2]:  2: 0xa94834  [io.admin.0]
2023-10-23 15:56:02.374  - error: host.iobroker Caught by controller[3]:  3: 0xd66d10 v8::Utils::ReportOOMFailure(v8::internal::Isolate*, char const*, bool) [io.admin.0]
2023-10-23 15:56:02.374  - error: host.iobroker Caught by controller[4]:  4: 0xd670b7 v8::internal::V8::FatalProcessOutOfMemory(v8::internal::Isolate*, char const*, bool) [io.admin.0]
2023-10-23 15:56:02.374  - error: host.iobroker Caught by controller[5]:  5: 0xf447c5  [io.admin.0]
2023-10-23 15:56:02.374  - error: host.iobroker Caught by controller[6]:  6: 0xf456c8 v8::internal::Heap::RecomputeLimits(v8::internal::GarbageCollector) [io.admin.0]
2023-10-23 15:56:02.374  - error: host.iobroker Caught by controller[7]:  7: 0xf55bd3  [io.admin.0]
2023-10-23 15:56:02.374  - error: host.iobroker Caught by controller[8]:  8: 0xf56a48 v8::internal::Heap::CollectGarbage(v8::internal::AllocationSpace, v8::internal::GarbageCollectionReason, v8::GCCallbackFlags) [io.admin.0]
2023-10-23 15:56:02.374  - error: host.iobroker Caught by controller[9]:  9: 0xf313ae v8::internal::HeapAllocator::AllocateRawWithLightRetrySlowPath(int, v8::internal::AllocationType, v8::internal::AllocationOrigin, v8::internal::AllocationAlignment) [io.admin.0]
2023-10-23 15:56:02.375  - error: host.iobroker Caught by controller[10]: 10: 0xf32777 v8::internal::HeapAllocator::AllocateRawWithRetryOrFailSlowPath(int, v8::internal::AllocationType, v8::internal::AllocationOrigin, v8::internal::AllocationAlignment) [io.admin.0]
2023-10-23 15:56:02.375  - error: host.iobroker Caught by controller[11]: 11: 0xf12cc0 v8::internal::Factory::AllocateRaw(int, v8::internal::AllocationType, v8::internal::AllocationAlignment) [io.admin.0]
2023-10-23 15:56:02.375  - error: host.iobroker Caught by controller[12]: 12: 0xf0a28c v8::internal::FactoryBase<v8::internal::Factory>::AllocateRawArray(int, v8::internal::AllocationType) [io.admin.0]
2023-10-23 15:56:02.375  - error: host.iobroker Caught by controller[13]: 13: 0xf0a405 v8::internal::FactoryBase<v8::internal::Factory>::NewFixedArrayWithFiller(v8::internal::Handle<v8::internal::Map>, int, v8::internal::Handle<v8::internal::Oddball>, v8::internal::AllocationType) [io.admin.0]
2023-10-23 15:56:02.375  - error: host.iobroker Caught by controller[14]: 14: 0x11c546e v8::internal::MaybeHandle<v8::internal::OrderedHashMap> v8::internal::OrderedHashTable<v8::internal::OrderedHashMap, 2>::Allocate<v8::internal::Isolate>(v8::internal::Isolate*, int, v8::internal::AllocationType) [io.admin.0]
2023-10-23 15:56:02.375  - error: host.iobroker Caught by controller[15]: 15: 0x11c5523 v8::internal::MaybeHandle<v8::internal::OrderedHashMap> v8::internal::OrderedHashTable<v8::internal::OrderedHashMap, 2>::Rehash<v8::internal::Isolate>(v8::internal::Isolate*, v8::internal::Handle<v8::internal::OrderedHashMap>, int) [io.admin.0]
2023-10-23 15:56:02.375  - error: host.iobroker Caught by controller[16]: 16: 0x12cf86d v8::internal::Runtime_MapGrow(int, unsigned long*, v8::internal::Isolate*) [io.admin.0]
2023-10-23 15:56:02.376  - error: host.iobroker Caught by controller[17]: 17: 0x1705b39  [io.admin.0]
2023-10-23 15:56:02.376  - warn: host.iobroker instance system.adapter.admin.0 terminated due to SIGABRT
2023-10-23 15:56:02.376  - info: host.iobroker instance system.adapter.admin.0 terminated with code null ()
2023-10-23 15:56:02.376  - info: host.iobroker Restart adapter system.adapter.admin.0 because enabled
2023-10-23 15:56:06.700  - info: influxdb.0 (63062) Store 440 buffered influxDB history points
2023-10-23 15:56:06.700  - info: influxdb.0 (63062) Store 440 buffered influxDB history points
2023-10-23 15:56:09.890  - info: tuya.0 (1582) 38338871500291d6d932: Error on Reconnect (1): connection timed out
2023-10-23 15:56:10.212  - info: javascript.0 (15774) script.js.common.Nuki.mqtt2log: NUKI Hub WT: Querying lock state: Querying lock state: Querying lock state: unlocked
2023-10-23 15:56:09.890  - info: tuya.0 (1582) 38338871500291d6d932: Error on Reconnect (1): connection timed out
Ich leg jetzt mal n Issue beim Admin Adapter an... das ist doch nix.. :(
-
@ilovegym Interessant das er trotzdem bei 4GB gekillt hat ... setz mal höher ob das was ändert?
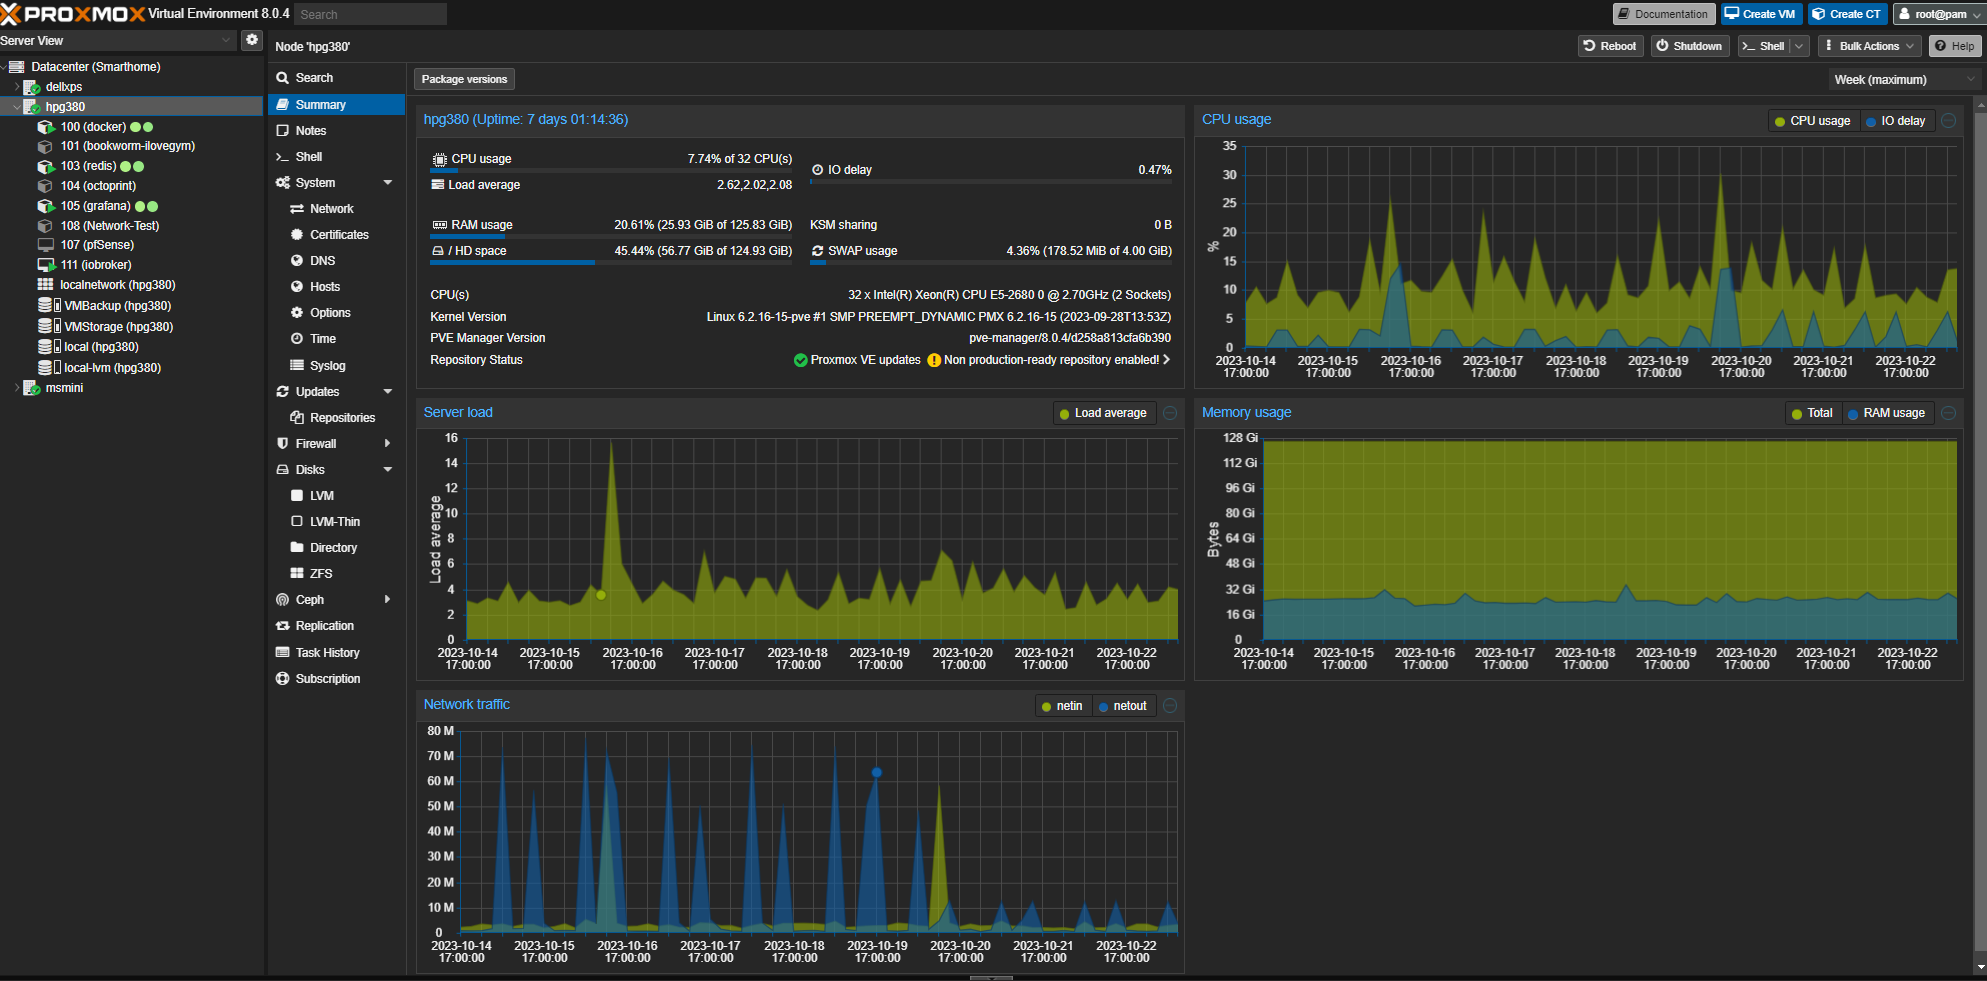
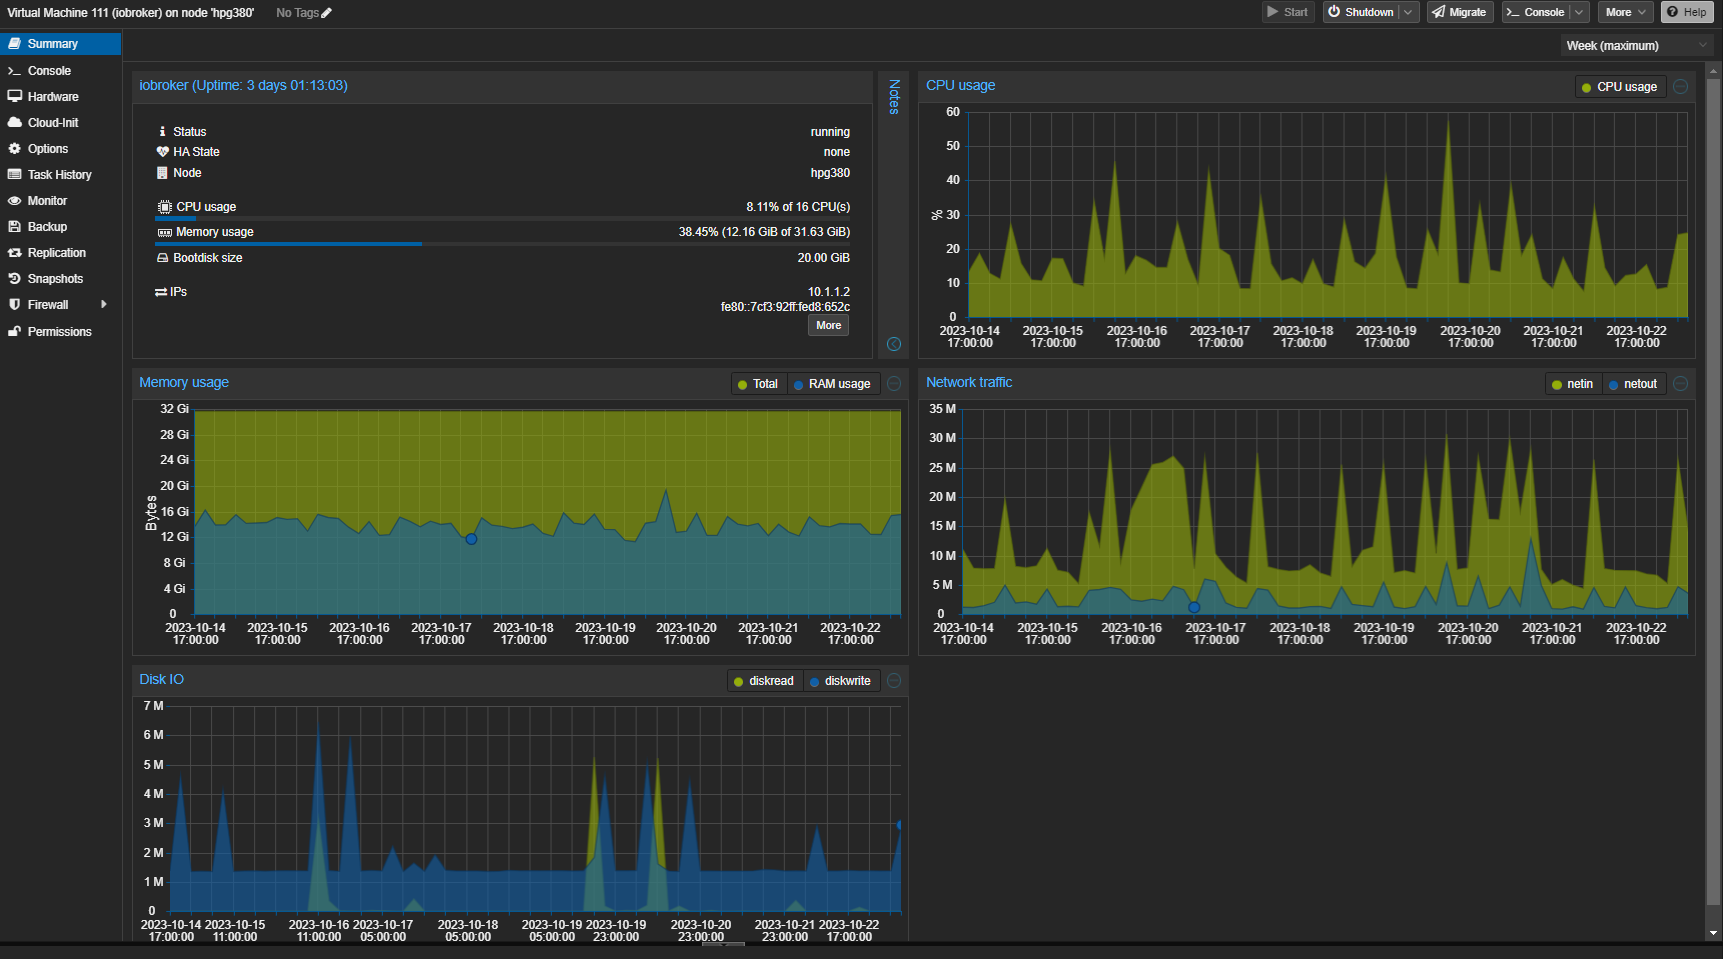
da scheint was nicht zu stimmen... wollt es jetzt mal wissen... ich hab der VM jetzt 64GB Ram zugewiesen, kein Balloon.
Die sind definitv immer frei..
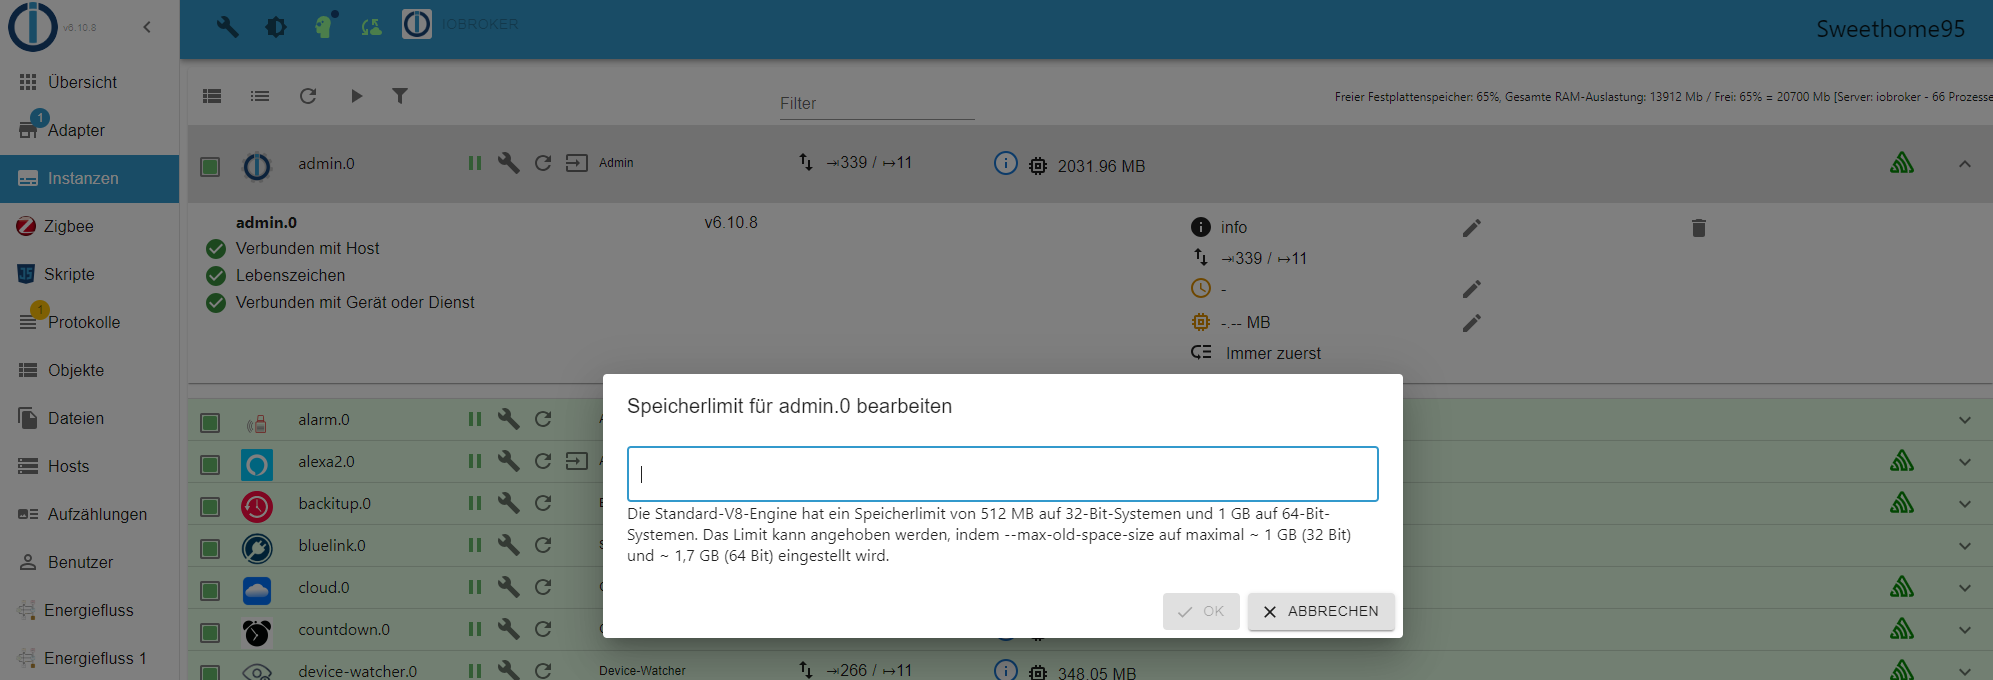
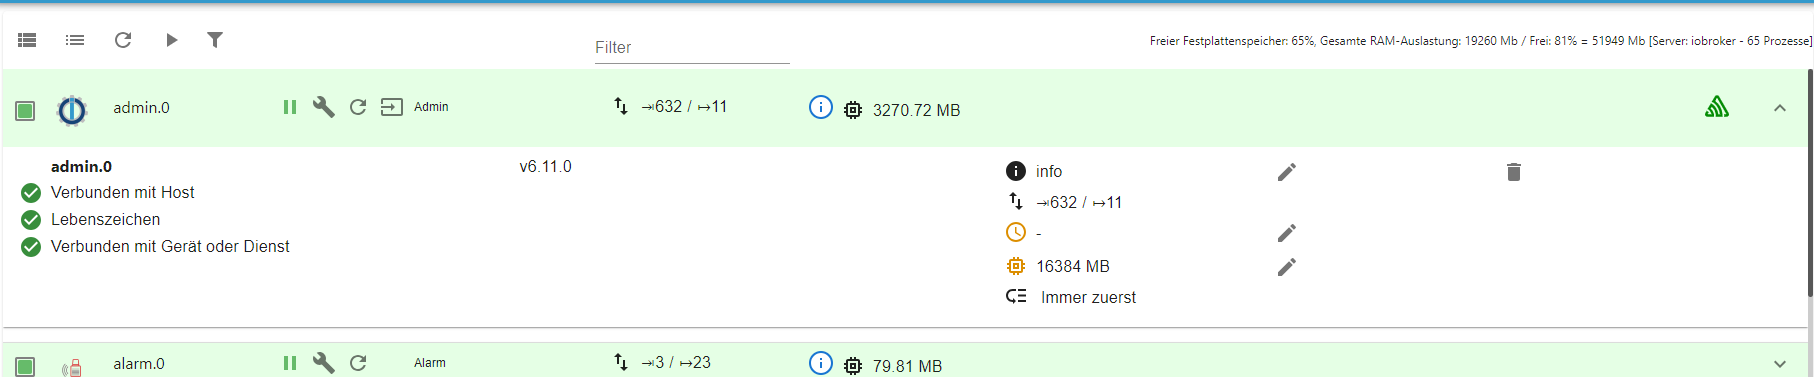
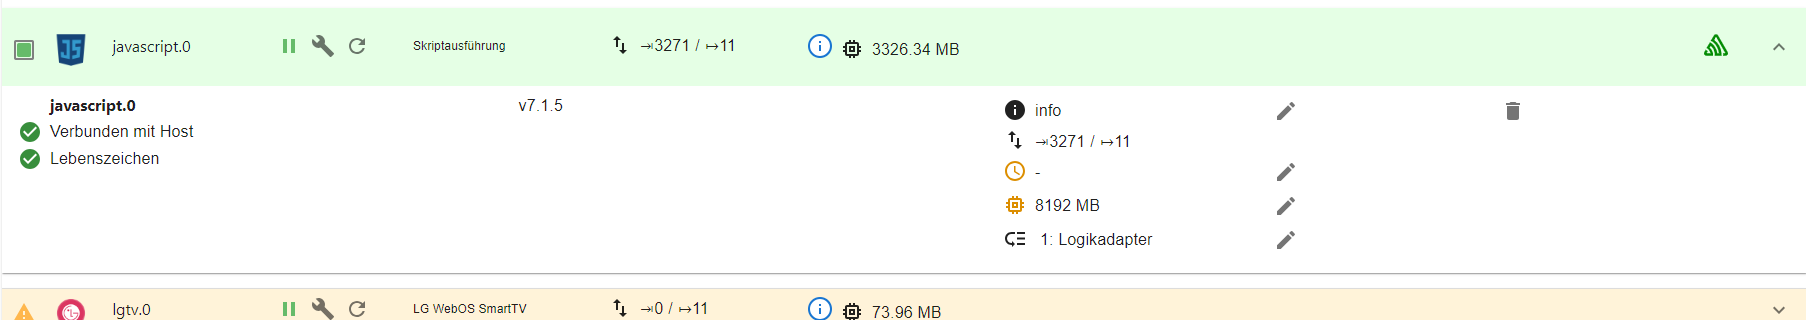
Admin Adapter hat jetzt 16384 drin stehen:
und dann kommt sowas:
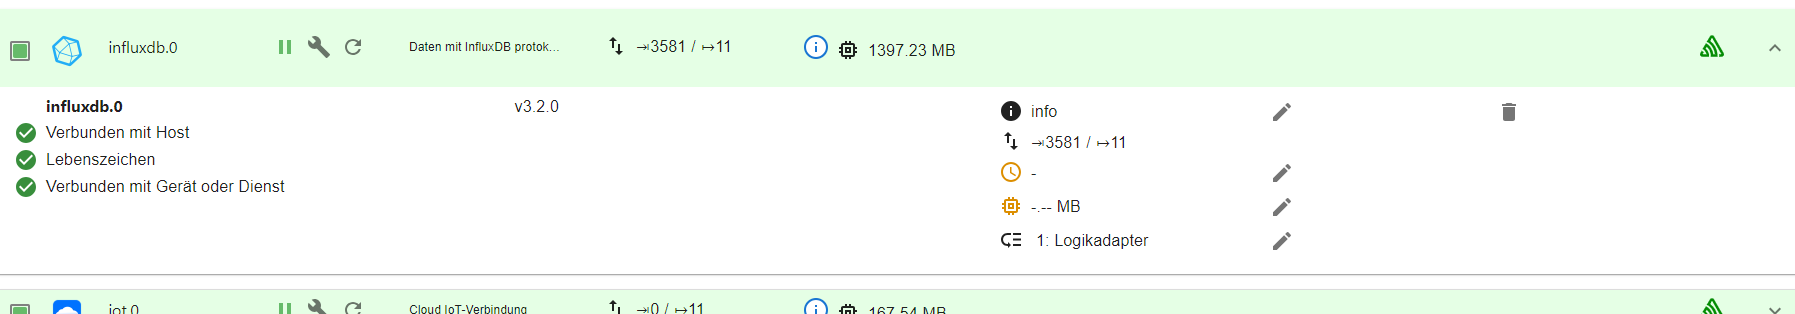
2023-10-23 17:00:38.210  - info: tuya.0 (1538) bf4e76548af6405d8cr8zc: Error on Reconnect (3): connect EHOSTUNREACH 10.1.5.64:6668
2023-10-23 17:00:38.612  - info: linux-control.0 (2922) successful received data from redis (10.1.1.1:22)
2023-10-23 17:00:38.704  - info: linux-control.0 (2922) successful received data from wireguard (10.1.1.8:22)
2023-10-23 17:00:38.852  - info: linux-control.0 (2922) successful received data from hpdl380g8 (10.1.1.6:22)
2023-10-23 17:00:38.996  - info: linux-control.0 (2922) successful received data from grafana (10.1.1.3:22)
2023-10-23 17:00:38.996  - info: linux-control.0 (2922) successful received data from docker (10.1.1.4:22)
2023-10-23 17:00:39.107  - info: tuya.0 (1538) bf86420a244a1df50azygs: Connect locally to device
2023-10-23 17:00:39.107  - info: tuya.0 (1538) bf86420a244a1df50azygs Init with IP=10.1.5.54, Key=KQ^vY%~XP?IUEVIM, Version=3.3
2023-10-23 17:00:39.572  - info: sonoff.0 (1415) Client [RolladenBuero] connected with secret 1698073237940_7667
2023-10-23 17:00:39.705  - error: host.iobroker Caught by controller[0]: <--- Last few GCs --->
2023-10-23 17:00:39.705  - error: host.iobroker Caught by controller[0]: [2342:0x5f8a680]    49936 ms: Scavenge (reduce) 3697.1 (3867.1) -> 3697.0 (3868.3) MB, 25.1 / 0.0 ms  (average mu = 0.855, current mu = 0.922) allocation failure;
2023-10-23 17:00:39.705  - error: host.iobroker Caught by controller[0]: [2342:0x5f8a680]    56391 ms: Mark-sweep (reduce) 4485.9 (4656.6) -> 4484.8 (4644.1) MB, 4211.2 / 0.0 ms  (+ 184.6 ms in 457 steps since start of marking, biggest step 27.5 ms, walltime since start of marking 7290 ms) (average mu = 0.739, current mu = 0.6
2023-10-23 17:00:39.705  - error: host.iobroker Caught by controller[0]: <--- JS stacktrace --->
2023-10-23 17:00:39.706  - error: host.iobroker Caught by controller[0]: FATAL ERROR: Reached heap limit Allocation failed - JavaScript heap out of memory
2023-10-23 17:00:39.706  - error: host.iobroker Caught by controller[1]:  1: 0xb85bc0 node::Abort() [io.admin.0]
2023-10-23 17:00:39.706  - error: host.iobroker Caught by controller[2]:  2: 0xa94834  [io.admin.0]
2023-10-23 17:00:39.706  - error: host.iobroker Caught by controller[3]:  3: 0xd66d10 v8::Utils::ReportOOMFailure(v8::internal::Isolate*, char const*, bool) [io.admin.0]
2023-10-23 17:00:39.706  - error: host.iobroker Caught by controller[4]:  4: 0xd670b7 v8::internal::V8::FatalProcessOutOfMemory(v8::internal::Isolate*, char const*, bool) [io.admin.0]
2023-10-23 17:00:39.706  - error: host.iobroker Caught by controller[5]:  5: 0xf447c5  [io.admin.0]
2023-10-23 17:00:39.706  - error: host.iobroker Caught by controller[6]:  6: 0xf56cad v8::internal::Heap::CollectGarbage(v8::internal::AllocationSpace, v8::internal::GarbageCollectionReason, v8::GCCallbackFlags) [io.admin.0]
2023-10-23 17:00:39.707  - error: host.iobroker Caught by controller[7]:  7: 0xf5999b v8::internal::Heap::AllocateExternalBackingStore(std::function<void* (unsigned long)> const&, unsigned long) [io.admin.0]
2023-10-23 17:00:39.707  - error: host.iobroker Caught by controller[8]:  8: 0x107e1a2 v8::internal::BackingStore::Allocate(v8::internal::Isolate*, unsigned long, v8::internal::SharedFlag, v8::internal::InitializedFlag) [io.admin.0]
2023-10-23 17:00:39.707  - error: host.iobroker Caught by controller[9]:  9: 0xdd1ed8  [io.admin.0]
2023-10-23 17:00:39.707  - error: host.iobroker Caught by controller[10]: 10: 0xdd23a1 v8::internal::Builtin_ArrayBufferConstructor(int, unsigned long*, v8::internal::Isolate*) [io.admin.0]
2023-10-23 17:00:39.707  - error: host.iobroker Caught by controller[11]: 11: 0x1705c39  [io.admin.0]
2023-10-23 17:00:39.707  - warn: host.iobroker instance system.adapter.admin.0 terminated due to SIGABRT
2023-10-23 17:00:39.707  - info: host.iobroker instance system.adapter.admin.0 terminated with code null ()
2023-10-23 17:00:39.708  - info: host.iobroker Restart adapter system.adapter.admin.0 because enabled
2023-10-23 17:00:27.520  - info: influxdb.0 (1962) enabled logging of tuya.0.bf1a78398f3c8faf3cx38r.38, Alias=false
2023-10-23 17:00:27.521  - info: influxdb.0 (1962) enabled logging of system.adapter.javascript.0.alive, Alias=false
ah, jetzt kommt influxdb, obwohl das auf 8192 steht:
2023-10-23 17:05:14.489  - error: host.iobroker Caught by controller[1]: <--- Last few GCs --->
2023-10-23 17:05:14.489  - error: host.iobroker Caught by controller[1]: [6148:0x7756680]   129990 ms: Mark-sweep (reduce) 4067.4 (4142.9) -> 4067.1 (4143.6) MB, 7334.0 / 0.0 ms  (average mu = 0.270, current mu = 0.307) allocation failure; scavenge might not succeed
2023-10-23 17:05:14.490  - error: host.iobroker Caught by controller[1]: [6148:0x7756680]   137240 ms: Mark-sweep (reduce) 4068.3 (4143.6) -> 4068.1 (4144.6) MB, 7245.3 / 0.0 ms  (average mu = 0.143, current mu = 0.001) allocation failure; scavenge might not succeed
2023-10-23 17:05:14.490  - error: host.iobroker Caught by controller[1]: <--- JS stacktrace --->
2023-10-23 17:05:14.490  - error: host.iobroker Caught by controller[1]: FATAL ERROR: Reached heap limit Allocation failed - JavaScript heap out of memory
2023-10-23 17:05:14.490  - error: host.iobroker Caught by controller[2]:  1: 0xb85bc0 node::Abort() [io.influxdb.0]
2023-10-23 17:05:14.490  - error: host.iobroker Caught by controller[3]:  2: 0xa94834  [io.influxdb.0]
2023-10-23 17:05:14.490  - error: host.iobroker Caught by controller[4]:  3: 0xd66d10 v8::Utils::ReportOOMFailure(v8::internal::Isolate*, char const*, bool) [io.influxdb.0]
2023-10-23 17:05:14.491  - error: host.iobroker Caught by controller[5]:  4: 0xd670b7 v8::internal::V8::FatalProcessOutOfMemory(v8::internal::Isolate*, char const*, bool) [io.influxdb.0]
2023-10-23 17:05:14.491  - error: host.iobroker Caught by controller[6]:  5: 0xf447c5  [io.influxdb.0]
2023-10-23 17:05:14.491  - error: host.iobroker Caught by controller[7]:  6: 0xf56cad v8::internal::Heap::CollectGarbage(v8::internal::AllocationSpace, v8::internal::GarbageCollectionReason, v8::GCCallbackFlags) [io.influxdb.0]
2023-10-23 17:05:14.491  - error: host.iobroker Caught by controller[8]:  7: 0xf313ae v8::internal::HeapAllocator::AllocateRawWithLightRetrySlowPath(int, v8::internal::AllocationType, v8::internal::AllocationOrigin, v8::internal::AllocationAlignment) [io.influxdb.0]
2023-10-23 17:05:14.491  - error: host.iobroker Caught by controller[9]:  8: 0xf32777 v8::internal::HeapAllocator::AllocateRawWithRetryOrFailSlowPath(int, v8::internal::AllocationType, v8::internal::AllocationOrigin, v8::internal::AllocationAlignment) [io.influxdb.0]
2023-10-23 17:05:14.492  - error: host.iobroker Caught by controller[10]:  9: 0xf12cc0 v8::internal::Factory::AllocateRaw(int, v8::internal::AllocationType, v8::internal::AllocationAlignment) [io.influxdb.0]
2023-10-23 17:05:14.492  - error: host.iobroker Caught by controller[11]: 10: 0xf0a28c v8::internal::FactoryBase<v8::internal::Factory>::AllocateRawArray(int, v8::internal::AllocationType) [io.influxdb.0]
2023-10-23 17:05:14.492  - error: host.iobroker Caught by controller[12]: 11: 0xf0a405 v8::internal::FactoryBase<v8::internal::Factory>::NewFixedArrayWithFiller(v8::internal::Handle<v8::internal::Map>, int, v8::internal::Handle<v8::internal::Oddball>, v8::internal::AllocationType) [io.influxdb.0]
2023-10-23 17:05:14.492  - error: host.iobroker Caught by controller[13]: 12: 0xf1e195 v8::internal::Factory::NewJSArrayStorage(v8::internal::ElementsKind, int, v8::internal::ArrayStorageAllocationMode) [io.influxdb.0]
2023-10-23 17:05:14.493  - error: host.iobroker Caught by controller[14]: 13: 0xf1e29e v8::internal::Factory::NewJSArray(v8::internal::ElementsKind, int, int, v8::internal::ArrayStorageAllocationMode, v8::internal::AllocationType) [io.influxdb.0]
2023-10-23 17:05:14.493  - error: host.iobroker Caught by controller[15]: 14: 0x10468d5 v8::internal::JsonParser<unsigned short>::BuildJsonArray(v8::internal::JsonParser<unsigned short>::JsonContinuation const&, v8::base::SmallVector<v8::internal::Handle<v8::internal::Object>, 16ul, std::allocator<v8::internal::Handle<v8::internal::Object> > > const&) [io.influxdb.0]
2023-10-23 17:05:14.493  - error: host.iobroker Caught by controller[16]: 15: 0x104e65e v8::internal::JsonParser<unsigned short>::ParseJsonValue() [io.influxdb.0]
2023-10-23 17:05:14.493  - error: host.iobroker Caught by controller[17]: 16: 0x104f53f v8::internal::JsonParser<unsigned short>::ParseJson() [io.influxdb.0]
2023-10-23 17:05:14.497  - error: host.iobroker Caught by controller[18]: 17: 0xdec8f3 v8::internal::Builtin_JsonParse(int, unsigned long*, v8::internal::Isolate*) [io.influxdb.0]
2023-10-23 17:05:14.498  - error: host.iobroker Caught by controller[19]: 18: 0x1705c39  [io.influxdb.0]
2023-10-23 17:05:14.498  - warn: host.iobroker instance system.adapter.influxdb.0 terminated due to SIGABRT
und dann dauerts nicht lange, bis javascript sein comment dazu gibt;;;
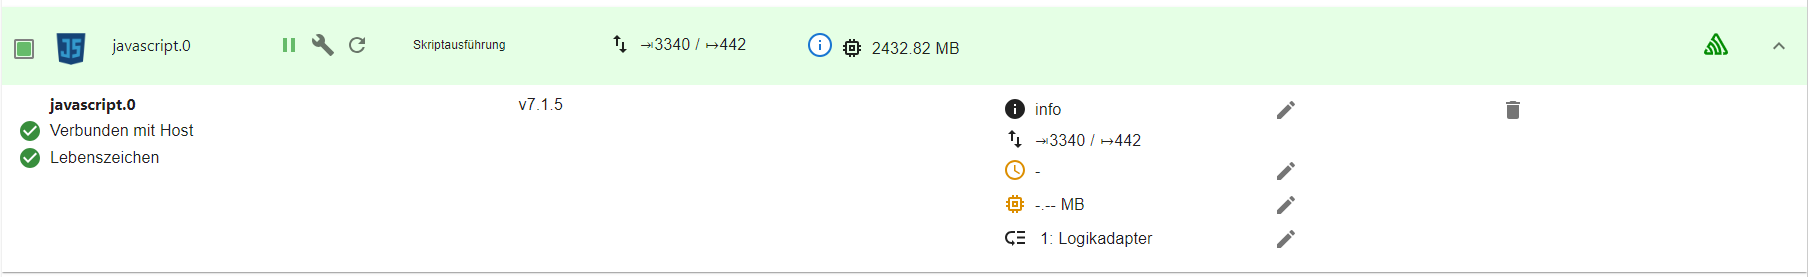
2023-10-23 17:05:52.302  - info: influxdb.0 (10949) Connected!
2023-10-23 17:05:52.302  - info: influxdb.0 (10949) Connected!
2023-10-23 17:05:57.922  - error: host.iobroker Caught by controller[0]: <--- Last few GCs --->
2023-10-23 17:05:57.923  - error: host.iobroker Caught by controller[0]: [8452:0x6415680]    90569 ms: Mark-sweep (reduce) 4076.2 (4143.3) -> 4076.1 (4144.0) MB, 6147.6 / 0.0 ms  (average mu = 0.199, current mu = 0.003) allocation failure; scavenge might not succeed
2023-10-23 17:05:57.923  - error: host.iobroker Caught by controller[0]: <--- JS stacktrace --->
2023-10-23 17:05:57.923  - error: host.iobroker Caught by controller[0]: FATAL ERROR: Reached heap limit Allocation failed - JavaScript heap out of memory
2023-10-23 17:05:57.923  - error: host.iobroker Caught by controller[1]:  1: 0xb85bc0 node::Abort() [io.javascript.0]
2023-10-23 17:05:57.923  - error: host.iobroker Caught by controller[2]:  2: 0xa94834  [io.javascript.0]
2023-10-23 17:05:57.923  - error: host.iobroker Caught by controller[3]:  3: 0xd66d10 v8::Utils::ReportOOMFailure(v8::internal::Isolate*, char const*, bool) [io.javascript.0]
2023-10-23 17:05:57.923  - error: host.iobroker Caught by controller[4]:  4: 0xd670b7 v8::internal::V8::FatalProcessOutOfMemory(v8::internal::Isolate*, char const*, bool) [io.javascript.0]
2023-10-23 17:05:57.924  - error: host.iobroker Caught by controller[5]:  5: 0xf447c5  [io.javascript.0]
2023-10-23 17:05:57.924  - error: host.iobroker Caught by controller[6]:  6: 0xf56cad v8::internal::Heap::CollectGarbage(v8::internal::AllocationSpace, v8::internal::GarbageCollectionReason, v8::GCCallbackFlags) [io.javascript.0]
2023-10-23 17:05:57.924  - error: host.iobroker Caught by controller[7]:  7: 0xf313ae v8::internal::HeapAllocator::AllocateRawWithLightRetrySlowPath(int, v8::internal::AllocationType, v8::internal::AllocationOrigin, v8::internal::AllocationAlignment) [io.javascript.0]
2023-10-23 17:05:57.924  - error: host.iobroker Caught by controller[8]:  8: 0xf32777 v8::internal::HeapAllocator::AllocateRawWithRetryOrFailSlowPath(int, v8::internal::AllocationType, v8::internal::AllocationOrigin, v8::internal::AllocationAlignment) [io.javascript.0]
2023-10-23 17:05:57.924  - error: host.iobroker Caught by controller[9]:  9: 0xf12cc0 v8::internal::Factory::AllocateRaw(int, v8::internal::AllocationType, v8::internal::AllocationAlignment) [io.javascript.0]
2023-10-23 17:05:57.924  - error: host.iobroker Caught by controller[10]: 10: 0xf0a28c v8::internal::FactoryBase<v8::internal::Factory>::AllocateRawArray(int, v8::internal::AllocationType) [io.javascript.0]
2023-10-23 17:05:57.924  - error: host.iobroker Caught by controller[11]: 11: 0xf0a405 v8::internal::FactoryBase<v8::internal::Factory>::NewFixedArrayWithFiller(v8::internal::Handle<v8::internal::Map>, int, v8::internal::Handle<v8::internal::Oddball>, v8::internal::AllocationType) [io.javascript.0]
2023-10-23 17:05:57.924  - error: host.iobroker Caught by controller[12]: 12: 0xf1e195 v8::internal::Factory::NewJSArrayStorage(v8::internal::ElementsKind, int, v8::internal::ArrayStorageAllocationMode) [io.javascript.0]
2023-10-23 17:05:57.925  - error: host.iobroker Caught by controller[13]: 13: 0xf1e29e v8::internal::Factory::NewJSArray(v8::internal::ElementsKind, int, int, v8::internal::ArrayStorageAllocationMode, v8::internal::AllocationType) [io.javascript.0]
2023-10-23 17:05:57.925  - error: host.iobroker Caught by controller[14]: 14: 0x10468d5 v8::internal::JsonParser<unsigned short>::BuildJsonArray(v8::internal::JsonParser<unsigned short>::JsonContinuation const&, v8::base::SmallVector<v8::internal::Handle<v8::internal::Object>, 16ul, std::allocator<v8::internal::Handle<v8::internal::Object> > > const&) [io.javascript.0]
2023-10-23 17:05:57.925  - error: host.iobroker Caught by controller[15]: 15: 0x104e65e v8::internal::JsonParser<unsigned short>::ParseJsonValue() [io.javascript.0]
2023-10-23 17:05:57.925  - error: host.iobroker Caught by controller[16]: 16: 0x104f53f v8::internal::JsonParser<unsigned short>::ParseJson() [io.javascript.0]
2023-10-23 17:05:57.925  - error: host.iobroker Caught by controller[17]: 17: 0xdec8f3 v8::internal::Builtin_JsonParse(int, unsigned long*, v8::internal::Isolate*) [io.javascript.0]
2023-10-23 17:05:57.925  - error: host.iobroker Caught by controller[18]: 18: 0x1705c39  [io.javascript.0]
2023-10-23 17:05:57.925  - warn: host.iobroker instance system.adapter.javascript.0 terminated due to SIGABRT
2023-10-23 17:05:57.925  - info: host.iobroker instance system.adapter.javascript.0 terminated with code null ()
2023-10-23 17:05:57.926  - info: host.iobroker Restart adapter system.adapter.javascript.0 because enabled
2023-10-23 17:06:00.023  - info: host.iobroker instance system.adapter.solarmanpv.0 started with pid 11300
2023-10-23 17:06:00.023  - info: host.iobroker instance system.adapter.solarmanpv.0 started with pid 11300
und der javascript steht auf 8192.. und nutzt nur 4096.. wie es aussieht..
-
@dp20eic
es sind 225 Zigbee Devices, 150 Devices beim Sonoff Adapter, 135 Devices im Tuya-Adapter...
ich versuch ja schon zu filtern ... das Problem ist, dass ich ja auch keine Datenpunkte mehr aus der history loeschen kann (also influx fuer den Datenpunkt deaktivieren), es sei denn, ich mach es einzeln..Hmpff soviel History DP hab ich auch gar nicht.. was mich wundert, ich hatte vorher den Unifi-Adapter noch mit 70000 Objekten drin, und das ging damals... und jetzt hab ich reduziert, und es geht nicht mehr..
hmm seltsam...
@ilovegym sagte in Admin, Influx und Javascript.. Nodejs - Memory Limits?:
loeschen kann (also influx fuer den Datenpunkt deaktivieren)
Moin,
ich denke, dass Du schon an diese Möglichkeit gedacht hast
Und dann weiter Einschränken über Raum, Funktion oder Rolle
VG
Bernd -
@ilovegym sagte in Admin, Influx und Javascript.. Nodejs - Memory Limits?:
loeschen kann (also influx fuer den Datenpunkt deaktivieren)
Moin,
ich denke, dass Du schon an diese Möglichkeit gedacht hast
Und dann weiter Einschränken über Raum, Funktion oder Rolle
VG
Bernd@dp20eic
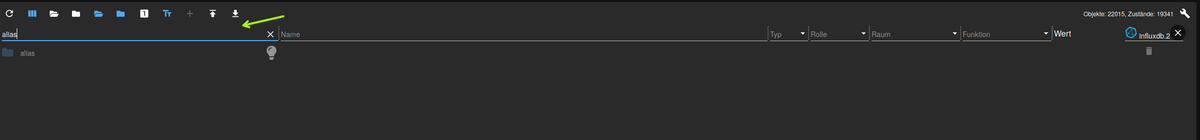
ja, ich kann das NUR so machen.. Filter mit der Instanz, dann noch meist Name, dann noch Raum.. / Funktion...
Vielleicht ist auch meine Datenbank im Eimer... oder das ist die Grenze... das komische ist ja, dass keiner der Adapter mehr als 4GB Ram benutzt, obwohl vorhanden und oder sogar eingestellt....
-
@dp20eic
ja, ich kann das NUR so machen.. Filter mit der Instanz, dann noch meist Name, dann noch Raum.. / Funktion...
Vielleicht ist auch meine Datenbank im Eimer... oder das ist die Grenze... das komische ist ja, dass keiner der Adapter mehr als 4GB Ram benutzt, obwohl vorhanden und oder sogar eingestellt....
@ilovegym sagte in Admin, Influx und Javascript.. Nodejs - Memory Limits?:
Adapter mehr als 4GB Ram benutzt, obwohl vorhanden und oder sogar eingestellt....
Moin,
kenne mich mit nodejs, nicht aus, ist das ein
onlineParameter, oder muss da etwas neu gestartet werden, dass der greift?VG
Bernd -
@ilovegym sagte in Admin, Influx und Javascript.. Nodejs - Memory Limits?:
Adapter mehr als 4GB Ram benutzt, obwohl vorhanden und oder sogar eingestellt....
Moin,
kenne mich mit nodejs, nicht aus, ist das ein
onlineParameter, oder muss da etwas neu gestartet werden, dass der greift?VG
Bernd@dp20eic
lt. Log wurde die Instanz nach Aenderung des Parameters neu gestartet...
Gab dann aber durcheinander und die VM hat sich nicht mehr eingekriegt..Hab jetzt das VM-Backup und LXC-Redis-Backup restored, bin auf Node 20.8.1 und NPM 10.1.0, der Speicherverbrauch ist satte 2GB weniger, laeuft jetzt mit 8-9 GB anstatt mit 11 GB Ram..
beobachte und teste mal morgen weiter... bisher alles gut.. aber jetzt ist auch Feierabend :-)
Gut zu wissen, dass meine 66 Instanzen auch mit Node 20 laufen.. das update hab ich mit dem command "iob nodejs-update 20"gemacht.. -
@dp20eic
lt. Log wurde die Instanz nach Aenderung des Parameters neu gestartet...
Gab dann aber durcheinander und die VM hat sich nicht mehr eingekriegt..Hab jetzt das VM-Backup und LXC-Redis-Backup restored, bin auf Node 20.8.1 und NPM 10.1.0, der Speicherverbrauch ist satte 2GB weniger, laeuft jetzt mit 8-9 GB anstatt mit 11 GB Ram..
beobachte und teste mal morgen weiter... bisher alles gut.. aber jetzt ist auch Feierabend :-)
Gut zu wissen, dass meine 66 Instanzen auch mit Node 20 laufen.. das update hab ich mit dem command "iob nodejs-update 20"gemacht..@ilovegym sagte in Admin, Influx und Javascript.. Nodejs - Memory Limits?:
das update hab ich mit dem command "iob nodejs-update 20"gemacht..


-
Also auch uns kommt das komisch vor. ich verstehe nicht warum Admin beim aufklappen so viel RAM braucht ... @foxriver76 schaut mal rein
-
Also auch uns kommt das komisch vor. ich verstehe nicht warum Admin beim aufklappen so viel RAM braucht ... @foxriver76 schaut mal rein
Danke schonmal! Ich hatte ja vor ein paar Monaten noch viel mehr States und Objects, waren ueber 130000, mit Node 18 und js-controller 4.x und die ersten Admin V6.x.. da lief das ja alles, war in einem Bullseye LXC installiert, Redis auch extern in einem LXC.
Hatte dann auf js-controller 5.x Alpha geupdated und irgendwann fingen die Probleme mit dem Backup an, dass so alles lief, aber beim iob backup der OOM kam.. das hatten wir damals behoben.. und seitdem habe ich auch die Objects und States reduziert, weil wir ja dachten, es liegt daran..Hatte dann mit dem Release von js-controller 5.x ne VM mit Bookworm aufgesetzt, und das Backup eingespielt..
Seitdem frisst der Admin viel mehr.. Vergleichbar ist das alles nicht, da damals andere Versionen von Admin usw. ja installiert waren..Habe gestern dann auf Node 20 hochgezogen, was Problemlos durchlief und nach nem Reboot laeuft auch alles. Insgesamt ist der benutzte Ram etwas weniger, im Schnitt jetzt bei 9,9GB, vorher mit Node18 war er bei 11GB.
Es sind sonst keine Updates gemacht worden.
Habe jetzt bei Admin nix drin stehen, beim Ram, nur bei Influx 8192, und bei Javascript 4096, das laeuft bis jetzt auch alles ohne Fehler. Die gesamte VM hat 64Gb Ram. Habe seitdem auch das Ballooning aus, vielleicht war da auch der Wurm drin.. dass er keine 4GB Ram am Stueck hatte.. hmpff alles schwer nachzuvollziehen... -
-
@apollon77 sagte in Admin, Influx und Javascript.. Nodejs - Memory Limits?:
@ilovegym Schau mal ob sich Admin 6.12.0 wad den RAM verbrauch angeht anders verhält
so, etwas rumgespielt... im Objektbrowser hat sich einiges getan, hier kann ich endlich meine Sonoff (7800 Objekte ) und Zigbee (2600) exportieren, das hat vorher nicht geklappt, kam kein Fehler, ging einfach nicht.. jetzt gehts. Super!
Dann, ich habe mal etliche Objekte (7600) am Stueck aus der History raus genommen, da hat er sich vorher im Memory hochgeschaukelt bis OOM kam... das klappt jetzt! Super!
Also auf jeden Fall verbessert ! -
@ilovegym Der Dank geht voll an @foxriver76
sooo hab was gefunden, wegen hohem Ram Verbrauch von Admin, Influx und Javascript.. und OOM beim Backup.....!!
es war KEINS der 727 Scripte, die laufen...
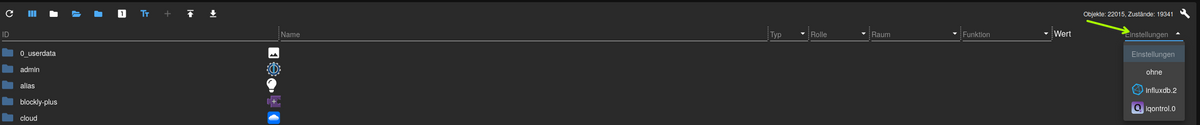
Es haengt zusammen mit dem Objektbrowser vom Admin-Adapter, ich hatte mir immer einige Objektbaeume exportiert und im neuen iobroker dann importiert, um nicht alle 3000 Objecte vom Zigbee-Adapter mit Raeumen und Funktionen und Beschreibungen der Objekte neu erstellen zu muessen.
Also im alten iobroker den Baum exportiert, hier hatte ich meist userdata.0., javascript.0, alias, sonoff, tuya und zigbee gebraucht, und dann diese wieder importiert..Das hat auch immer ohne Fehler geklappt, danach lief aber der Ram im Admin schon hoch.. und wenn ich jetzt noch ein paar Objekte wegen Influx markieren wollte... dann war's vorbei..
Das ist nachvollziehbar, ich hab die letzten 2 Wochen bestimmt 12 neue iobroker-Systeme (lxc, vm, docker) neu aufgesetzt, mit Redis als lxc, Redis im iobroker, und jsonl.. weil ich dachte, da haengts.. neeWenn ich mir die exportierten Objekte so betrachte, dann sind da auch Eintraege von Adaptern drin, die eigentlich beim De-Installieren geloescht werden sollten..
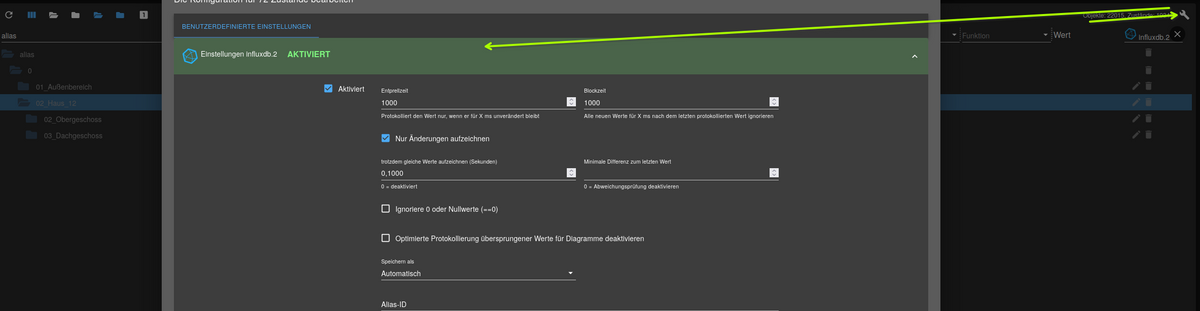
zum Beispiel Influx.1., Lightcontrol, SQL.. habe auf dem Testsystem auch ne zweite Influx Instanz installiert, und geloescht, er fragt ja, ob alle Eintraege geloescht werden sollen, jaaa.. solllen sie.. macht er aber nicht...Jetzt ist die Frage.. ist das ein Fehler von Admin, oder ein Fehler von Influx? Da auch SQL (den Lightcontrol hatte ich als Beta, den lassen wir mal weg.. ) noch drin steht.. denke ich nicht, dass alle Adapter da einen Fehler haben.. denke eher, das ist was von Admin oder js-controller?
Wer loescht den Kram aus den Objekten?irgendeine Idee ? Ich leg gern ein Issue an und stell den kaputten Objects zur Verfuegung, falls sich jemand sein System schiessen mag.. :-)
-
sooo hab was gefunden, wegen hohem Ram Verbrauch von Admin, Influx und Javascript.. und OOM beim Backup.....!!
es war KEINS der 727 Scripte, die laufen...
Es haengt zusammen mit dem Objektbrowser vom Admin-Adapter, ich hatte mir immer einige Objektbaeume exportiert und im neuen iobroker dann importiert, um nicht alle 3000 Objecte vom Zigbee-Adapter mit Raeumen und Funktionen und Beschreibungen der Objekte neu erstellen zu muessen.
Also im alten iobroker den Baum exportiert, hier hatte ich meist userdata.0., javascript.0, alias, sonoff, tuya und zigbee gebraucht, und dann diese wieder importiert..Das hat auch immer ohne Fehler geklappt, danach lief aber der Ram im Admin schon hoch.. und wenn ich jetzt noch ein paar Objekte wegen Influx markieren wollte... dann war's vorbei..
Das ist nachvollziehbar, ich hab die letzten 2 Wochen bestimmt 12 neue iobroker-Systeme (lxc, vm, docker) neu aufgesetzt, mit Redis als lxc, Redis im iobroker, und jsonl.. weil ich dachte, da haengts.. neeWenn ich mir die exportierten Objekte so betrachte, dann sind da auch Eintraege von Adaptern drin, die eigentlich beim De-Installieren geloescht werden sollten..
zum Beispiel Influx.1., Lightcontrol, SQL.. habe auf dem Testsystem auch ne zweite Influx Instanz installiert, und geloescht, er fragt ja, ob alle Eintraege geloescht werden sollen, jaaa.. solllen sie.. macht er aber nicht...Jetzt ist die Frage.. ist das ein Fehler von Admin, oder ein Fehler von Influx? Da auch SQL (den Lightcontrol hatte ich als Beta, den lassen wir mal weg.. ) noch drin steht.. denke ich nicht, dass alle Adapter da einen Fehler haben.. denke eher, das ist was von Admin oder js-controller?
Wer loescht den Kram aus den Objekten?irgendeine Idee ? Ich leg gern ein Issue an und stell den kaputten Objects zur Verfuegung, falls sich jemand sein System schiessen mag.. :-)
Hey! Du scheinst an dieser Unterhaltung interessiert zu sein, hast aber noch kein Konto.
Hast du es satt, bei jedem Besuch durch die gleichen Beiträge zu scrollen? Wenn du dich für ein Konto anmeldest, kommst du immer genau dorthin zurück, wo du zuvor warst, und kannst dich über neue Antworten benachrichtigen lassen (entweder per E-Mail oder Push-Benachrichtigung). Du kannst auch Lesezeichen speichern und Beiträge positiv bewerten, um anderen Community-Mitgliedern deine Wertschätzung zu zeigen.
Mit deinem Input könnte dieser Beitrag noch besser werden 💗
Registrieren Anmelden470
Online33.0k
Benutzer83.4k
Themen1.3m
Beiträge