- ioBroker Community Home
- Deutsch
- Skripten / Logik
- Node-Red
- Diagramm ohne Zeitachse


Diagramm ohne Zeitachse
-
Kennt jemmand eine einfache Möglichkeit ein Linien Diagramm zu erstellen ohne Zeitachse ?
Das Diagramm soll nur Solarstrahlungswert in Abhängigkeit einer Spannung darstellen.
Also z.B. x=1V y=10W/m²
Die meisten Nodes die es gibt arbeiten ja immer mit x als Zeitachse.
Ich hab es schon mit "node-red-contrib-chartjs" versucht aber da komm ich mit dem Object nicht zurecht. -
Kennt jemmand eine einfache Möglichkeit ein Linien Diagramm zu erstellen ohne Zeitachse ?
Das Diagramm soll nur Solarstrahlungswert in Abhängigkeit einer Spannung darstellen.
Also z.B. x=1V y=10W/m²
Die meisten Nodes die es gibt arbeiten ja immer mit x als Zeitachse.
Ich hab es schon mit "node-red-contrib-chartjs" versucht aber da komm ich mit dem Object nicht zurecht.Einfach - weiß ich nicht - bei mir hat diese Node auch nicht funktioniert, aber es gibt einen Flow der ebenfalls chartjs benutzt und eine template Node nutzt.
Hier ist ein flow mit und ohne Zeitachse als X-Achse: https://flows.nodered.org/flow/720044a3c587a310813a9326ed3cb08a
Im Prinzip sollte das also mit diesen Daten hinhauen:
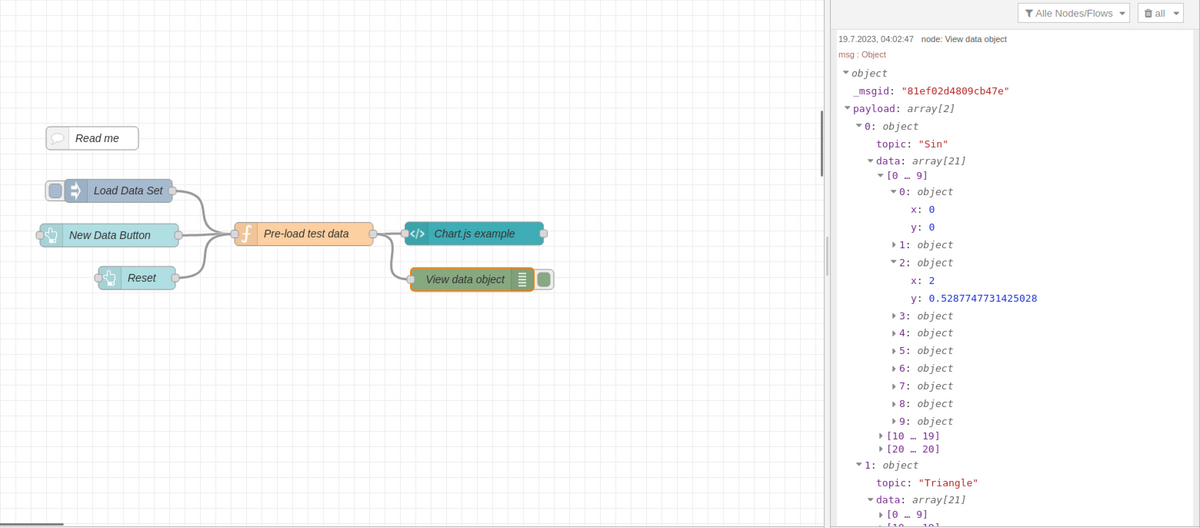
Ich hab das aber auch nicht bis zum Schluß durchgelesen - aber ich denke damit kommst Du zum Ziel.
[
   {
       "id": "83beecec.1abcf",
       "type": "comment",
       "z": "d25606275138920f",
       "name": "Read me",
       "info": "This charting example extends node-red-dashboard and the work by Colin Law here:\nhttp://flows.nodered.org/flow/c3dc75c47323a2754f5285225bce64b5\n\nView the chart at http://localhost:1880/ui\n\nBoth the dashboard chart and Colin's example uses time as the X-axis. The example\nhere uses an integer as the x-axis. Colin's example uses Chart.js inside a\nnode-red-dashboard template node. The example here leaves Colin's code almost \nunchanged except that the chart.js XAxis is changed from:\n\n                xAxes: [{\n                    type: 'time',\n                    time: {\n                        unit: 'minute',\n                        unitStepSize: 1,\n                        displayFormats: {\n                            minute: 'HH:mm'\n                        }\n                    }\n                }],\n\nto this:\n              xAxes: [{\n                    type: 'linear',\n                    position: 'bottom'\n                    }\n                ],\n                \nI also adjusted the way the nodes are rendered.\n\nThis example pre-prepares the data object and uses the msg.action = \"load\" \nmethod to ask the template code to render the data. \n\nA dashboard button on the UI page generates fresh data with a different \nscale each time.\n\n\n",
       "x": 300,
       "y": 1240,
       "wires": []
   },
   {
       "id": "2b14c627.b060aa",
       "type": "ui_template",
       "z": "d25606275138920f",
       "group": "b1d9d1fa.350a38",
       "name": "Chart.js example",
       "order": 9,
       "width": "8",
       "height": "8",
       "format": "<!-- See the read me comment node. Colin Law's original notes follow -->\n\n<!--\nA node-red Dashboard UI template to draw charts using chart.js\nBefore use download the file Chart.bundle.min.js from chartjs.org and \nsave in an appropriate folder (e.g. .node-red/static). \nIn settings.js set httpStatic to the full path of that folder and restart node-red.\nMake sure that the options for 'Pass through messages' and 'Add output messages' \nin this node are cleared.\nFor basic use set the id and size you want in the canvas tag and set chartID to the id\nSetup chartDef as required for your chart (see the chart.js docs)\nIn addition, for each dataset specify in chartDef the message topic that you will use for that channel.\nTo (optionally) provide the chart with a one-off set of data send the node a message with:\nmsg.action = \"load\"\nmsg.payload = [\n{topic: \"mytopic1\", data: [{x: x1,y:y2},{x:x2,y:y2},...]},\n{topic: \"mytopic2\", data: [{x: x1,y:y2},{x:x2,y:y2},...]},\n...]\nWhere mytopic1 and mytopic2 are the the topics specified in the chartDef\n\nTo provide the chart with data incrementally (for a time series for example)\nsend it messages of the form\n{topic: \"mytopic1\", payload: {x:xvalue,y:yvalue}}\nThe chart will be updated as each sample is provided.\nTo limit the growth of the chart set chartMaxPoints and/or chartTimeSpan in the Chart Helper node\nas described at the head of that node.\nIf you find that chart seems to flicker and scroll bars come and go then try \nsetting a size other than auto in the Size specification for this node.\n\nFor Bar charts the x value is the label for the bar and the y value is the bar value\n\nNote that since the chart samples are stored in the browser then the chart will be cleared each\ntime the browser is refreshed (and will be clear on initially opening the view). In order to \nprovided persistency over browser opening and refresh this node may be used in conjunction with\nthe Chart Helper function node.  Details for its use are in the source of that node.\n\nIf your flow includes more that one instance of this script then the line fetching \nChart.bundle.min.js need only be included in one of them\n-->\n\n<script src=\"/Chart.bundle.min.js\"></script>\n<canvas id=\"myChartSimple1\" width=\"300\" height=\"300\"></canvas>\n<script>\n(function() {\n    var chartID = \"myChartSimple1\";           // set this to the id you have specified in the canvas tag above\n    // setup the chart definition as defined in the chart.js documentation, in addition setting up the topic\n    // for each channel\n    var chartDef = {\n        type: 'line',\n        data: {\n            datasets: [{\n                topic: \"Sin\",    // used here not by chart.js\n                label: \"Sin\",\n                yAxisID: \"1\",\n                fill: false,\n                lineTension: 0,\n                borderColor: \"#0000ff\",\n                pointRadius: 5,\n                pointHoverRadius: 5,\n                pointBorderColor: \"#0000ff\",\n                pointBackgroundColor: \"#0000ff\",\n                backgroundColor:  \"#0000ff\",\n                borderWidth: 1,\n                data: []  // data is written here later\n            }, {\n                topic: \"Triangle\",    // used here not by chart.js\n                label: \"Triangle\",\n                yAxisID: \"2\",\n                fill: false,\n                lineTension: 0,\n                borderColor: \"#ff0000\",\n                pointRadius: 5,\n                pointHoverRadius: 5,\n                pointBorderColor: \"#ff0000\",\n                pointBackgroundColor: \"#ff0000\",\n                backgroundColor:  \"#ff0000\",\n                borderWidth: 1,\n                data: []  // data is written here later\n            }]\n        },\n        options: {\n            scales: {\n                xAxes: [{\n                    type: 'linear',\n                    position: 'bottom'\n                    }\n                ],\n                yAxes: [{\n                    id: \"1\",\n                    ticks: {\n                        min: -1,\n                        max: 1,\n                        stepSize: 0.2\n                    }\n                }, {\n                    id: \"2\",\n                    ticks: {\n                        min: -10,\n                        max: 10,\n                        stepSize: 2\n                    }\n                }]\n            },\n            animation: {\n                duration: 0\n            }\n        }\n    }\n        \n/***** You shouldn't normally need to change anything below here *****/    \n    var myChart = null;\n    var loaded = false;     // indicates whether we have already had a load action\n    var chartTimeSpan;\n    var chartMaxPoints;\n\n    function doChart(msg, scope) {\n        if (!myChart) {\n            // chart does not exist so load the data and create it\n            var ctx = document.getElementById(chartID);\n            myChart = new Chart(ctx, chartDef);     \n        }\n        // chart already exists, update it\n        var datasets = myChart.data.datasets;\n        // is this a load or preload action?\n        if (msg.action === \"load\" || msg.action === \"preload\") {\n            // yes, do not allow preload if we have already had a load\n            // so do it if this is a load or we have not previously had a load\n            if (msg.action === \"load\" || !loaded) {\n                // pick up chartTimeSpan and chartMaxPoints if they have been provided\n                if (typeof msg.chartTimeSpan != 'undefined') {\n                    chartTimeSpan = msg.chartTimeSpan;\n                }\n                if (typeof msg.chartMaxPoints != 'undefined') {\n                    chartMaxPoints = msg.chartMaxPoints;\n                }\n                    \n                // replace existing data for matching topics\n                for (var j = 0; j < msg.payload.length; j++) {\n                    var topic = msg.payload[j].topic;\n                    // find it in the chart\n                    for (var i = 0; i < datasets.length; i++) {\n                        if (datasets[i].topic == topic) {\n                            // if stripping old samples by time is required then ensure the x value is Date\n                            if (chartTimeSpan > 0 ) {\n                                var data = msg.payload[j].data;\n                                for (var k = 0; k < data.length; k++) {\n                                    if (typeof data[k].x === \"string\") {\n                                        data[k].x = new Date(data[k].x);\n                                    }\n                                }\n                            }\n                            if (chartDef.type !== \"bar\") {\n                                datasets[i].data = msg.payload[j].data;\n                            } else {\n                                // bar chart so x values must go to labels and y values to dataset\n                                datasets[i].data = [];\n                                myChart.data.labels = [];\n                                var data = msg.payload[j].data;\n                                for (var k = 0; k < data.length; k++) {\n                                    datasets[i].data.push(data[k].y);\n                                    myChart.data.labels.push(data[k].x);\n                                }\n                            }\n                            break;\n                        }\n                    }\n                }\n            }\n            if (msg.action === \"load\") loaded = true;\n            myChart.update();\n        } else {\n            // does the topic match one of the datasets?\n            for (var i = 0; i < datasets.length; i++) {\n                if (datasets[i].topic == msg.topic) {\n                    // if stripping old samples by time is required then ensure the x value is Date\n                    if (chartTimeSpan > 0 && typeof msg.payload.x === \"string\") {\n                        msg.payload.x = new Date(msg.payload.x);\n                    }\n                    if (chartDef.type !== \"bar\") {\n                        datasets[i].data.push(msg.payload);\n                    } else {\n                         // bar chart so x value must go to labels and y value to dataset\n                        datasets[i].data.push(msg.payload.y);\n                        myChart.data.labels.push(msg.payload.x);\n                    }\n                    myChart.update();\n                    break;\n                }\n            }\n        }\n        // strip off samples older than now\n        // charTimeSpan == 0 implies don't do it\n        var shifted = false;\n        if (chartTimeSpan > 0) {\n            var now = new Date();\n            var oldestTimeAllowed = now - chartTimeSpan;\n            for (var i = 0; i < datasets.length; i++) {\n                dataset = datasets[i];\n                while(dataset.data[0] && getTime(dataset.data[0].x) < oldestTimeAllowed) {\n                    dataset.data.shift();\n                    shifted = true;\n                }\n            }\n        }\n        // strip samples off the front if there are now too many\n        // charTimeSpan == 0 implies don't do it\n        if (chartMaxPoints > 0) {\n            for (var i = 0; i < datasets.length; i++) {\n                dataset = datasets[i];\n                while(dataset.data.length > chartMaxPoints) {\n                    dataset.data.shift();\n                    shifted = true;\n                }\n            }\n        }\n        if (shifted) {\n            myChart.update();\n        }\n    };\n\n    // gets the time of an x value, works for strings or Date types\n    function getTime(x) {\n        if (typeof x === \"string\") x = new Date(x);\n        return x.getTime();\n    }\n    \n    // builds the preload message for sending back to the chart helper\n    function preloadMsg() {\n        var preMsg = {action: \"preload\", payload: \"preload\"};\n        // build array of topics in chart\n        var topics = [];\n        for (var i=0; i<chartDef.data.datasets.length; i++) {\n            topics.push(chartDef.data.datasets[i].topic);\n        }\n        preMsg.topics = topics;\n        // has the chart already been created\n        if (myChart) {\n            preMsg.lastXValue = 1;\n        } else {\n            preMsg.lastXValue = 0;\n        }\n        return preMsg;\n    }\n\n    (function(scope) {\n        // this code gets run when the a view is opened on the node in the browser\n        // send a preload message back to node red to ask it send\n        // us a complete set of data. Pass down max points and time span to the helper node for it to use\n        // plus an array of the topics of interest\n        scope.send( preloadMsg() );\n        \n        scope.$watch('msg', function(msg) {\n            if (msg) {\n                doChart(msg, scope);\n            }\n        });\n    })(scope);\n})();\n</script>\n",
       "storeOutMessages": false,
       "fwdInMessages": false,
       "templateScope": "local",
       "x": 796.5499572753906,
       "y": 1363.8833312988281,
       "wires": [
           []
       ]
   },
   {
       "id": "382b4940.b5aece",
       "type": "debug",
       "z": "d25606275138920f",
       "name": "View data object",
       "active": true,
       "tosidebar": true,
       "console": false,
       "complete": "true",
       "statusVal": "",
       "statusType": "auto",
       "x": 794.0000305175781,
       "y": 1423.1333312988281,
       "wires": []
   },
   {
       "id": "e8e31a24.1c89d",
       "type": "inject",
       "z": "d25606275138920f",
       "name": "Load Data Set",
       "repeat": "",
       "crontab": "",
       "once": false,
       "topic": "",
       "payload": "",
       "payloadType": "str",
       "x": 333.99998474121094,
       "y": 1308.3833312988281,
       "wires": [
           [
               "4f0a7091.a1a64"
           ]
       ]
   },
   {
       "id": "4f0a7091.a1a64",
       "type": "function",
       "z": "d25606275138920f",
       "name": "Pre-load test data",
       "func": "\n/* This function creates a two data sets, with different topics,\n   the same x values and different y values*/\n\n// Change the scale factor each time.\nvar scale = context.get('scale') || 0;\nif (msg.topic == \"Reset\") {\n    scale = 0;\n}\nscale++;\ncontext.set('scale', scale);\n\nmsg.payload = [];       // This will be an array of {topic, data} objects\nvar dataPoints1 = [];   // These will be the first array of data points \nvar dataPoints2 = [];   // These will be the second array of data points \nvar numPoints = 20;     // We will create one more than this.\n\n// For the first data set create a sine wave\nfor (var i=0; i<=numPoints; i++) {\n    var point = {};\n    point.x = i;\n    point.y = Math.sin(2 * 3.14 * (i/numPoints)) * scale/10;\n    // build the data array    \n    dataPoints1.push(point);\n}\n\n// For the second data set create a triangle\nfor (var i=0; i<=numPoints; i++) {\n    var point = {};\n    point.x = i;\n    if (i<(numPoints/2)) {\n        // ramp up\n        point.y = i * scale/10;\n    }\n    else {\n        // ramp down\n        point.y = (numPoints - i) * scale/10;\n    }\n    dataPoints2.push(point);    // add to the array\n}\n\nmsg.action = \"load\";    // This instructs the chart node to paint the data\n\n// The payload is an array of two {topic, data} objects\nmsg.payload = [{topic: \"Sin\", data: dataPoints1},\n                {topic: \"Triangle\", data: dataPoints2}];\n\nreturn msg;",
       "outputs": 1,
       "noerr": 0,
       "x": 575,
       "y": 1364.5333251953125,
       "wires": [
           [
               "2b14c627.b060aa",
               "382b4940.b5aece"
           ]
       ]
   },
   {
       "id": "60b53a17.513d74",
       "type": "ui_button",
       "z": "d25606275138920f",
       "name": "New Data Button",
       "group": "b1d9d1fa.350a38",
       "order": 0,
       "width": 0,
       "height": 0,
       "label": "New Data",
       "color": "",
       "bgcolor": "",
       "icon": "",
       "payload": "",
       "payloadType": "str",
       "topic": "",
       "x": 321.99998474121094,
       "y": 1366.183334350586,
       "wires": [
           [
               "4f0a7091.a1a64"
           ]
       ]
   },
   {
       "id": "e44ff289.b11b28",
       "type": "ui_button",
       "z": "d25606275138920f",
       "name": "Reset",
       "group": "b1d9d1fa.350a38",
       "order": 0,
       "width": 0,
       "height": 0,
       "label": "Reset",
       "color": "",
       "bgcolor": "",
       "icon": "",
       "payload": "",
       "payloadType": "str",
       "topic": "Reset",
       "x": 358,
       "y": 1421.1833190917969,
       "wires": [
           [
               "4f0a7091.a1a64"
           ]
       ]
   },
   {
       "id": "b1d9d1fa.350a38",
       "type": "ui_group",
       "name": "Chart with integer X axis",
       "tab": "9d7c530e.2785a",
       "order": 1,
       "disp": true,
       "width": "12"
   },
   {
       "id": "9d7c530e.2785a",
       "type": "ui_tab",
       "name": "Chart.js example",
       "icon": "dashboard",
       "order": 2
   }
]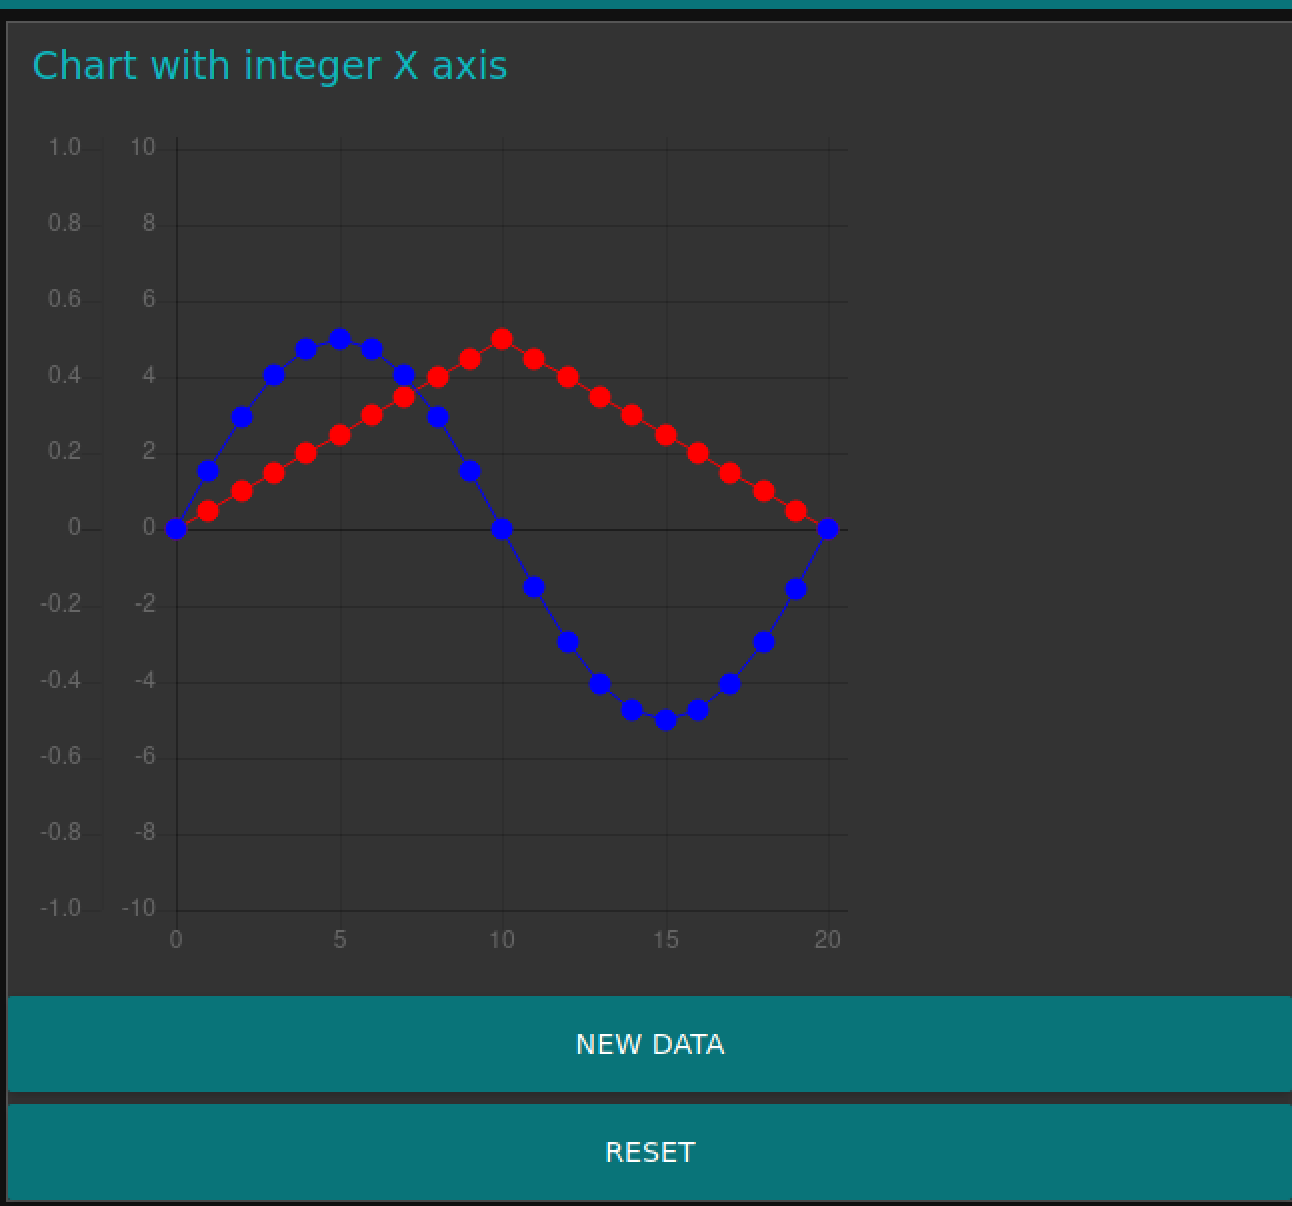
Aber da musst Dich reinfuchsen. Die Nodes, die Du vorher versucht hast, die haben bei mir auch nicht funktioniert.
Jeder Flow bzw. jedes Script, das ich hier poste implementiert jeder auf eigene Gefahr. Flows und Scripts können Fehler aufweisen und weder der Seitenbetreiber noch ich persönlich können hierfür haftbar gemacht werden. Das gleiche gilt für Empfehlungen aller Art.
-
Einfach - weiß ich nicht - bei mir hat diese Node auch nicht funktioniert, aber es gibt einen Flow der ebenfalls chartjs benutzt und eine template Node nutzt.
Hier ist ein flow mit und ohne Zeitachse als X-Achse: https://flows.nodered.org/flow/720044a3c587a310813a9326ed3cb08a
Im Prinzip sollte das also mit diesen Daten hinhauen:
Ich hab das aber auch nicht bis zum Schluß durchgelesen - aber ich denke damit kommst Du zum Ziel.
[
   {
       "id": "83beecec.1abcf",
       "type": "comment",
       "z": "d25606275138920f",
       "name": "Read me",
       "info": "This charting example extends node-red-dashboard and the work by Colin Law here:\nhttp://flows.nodered.org/flow/c3dc75c47323a2754f5285225bce64b5\n\nView the chart at http://localhost:1880/ui\n\nBoth the dashboard chart and Colin's example uses time as the X-axis. The example\nhere uses an integer as the x-axis. Colin's example uses Chart.js inside a\nnode-red-dashboard template node. The example here leaves Colin's code almost \nunchanged except that the chart.js XAxis is changed from:\n\n                xAxes: [{\n                    type: 'time',\n                    time: {\n                        unit: 'minute',\n                        unitStepSize: 1,\n                        displayFormats: {\n                            minute: 'HH:mm'\n                        }\n                    }\n                }],\n\nto this:\n              xAxes: [{\n                    type: 'linear',\n                    position: 'bottom'\n                    }\n                ],\n                \nI also adjusted the way the nodes are rendered.\n\nThis example pre-prepares the data object and uses the msg.action = \"load\" \nmethod to ask the template code to render the data. \n\nA dashboard button on the UI page generates fresh data with a different \nscale each time.\n\n\n",
       "x": 300,
       "y": 1240,
       "wires": []
   },
   {
       "id": "2b14c627.b060aa",
       "type": "ui_template",
       "z": "d25606275138920f",
       "group": "b1d9d1fa.350a38",
       "name": "Chart.js example",
       "order": 9,
       "width": "8",
       "height": "8",
       "format": "<!-- See the read me comment node. Colin Law's original notes follow -->\n\n<!--\nA node-red Dashboard UI template to draw charts using chart.js\nBefore use download the file Chart.bundle.min.js from chartjs.org and \nsave in an appropriate folder (e.g. .node-red/static). \nIn settings.js set httpStatic to the full path of that folder and restart node-red.\nMake sure that the options for 'Pass through messages' and 'Add output messages' \nin this node are cleared.\nFor basic use set the id and size you want in the canvas tag and set chartID to the id\nSetup chartDef as required for your chart (see the chart.js docs)\nIn addition, for each dataset specify in chartDef the message topic that you will use for that channel.\nTo (optionally) provide the chart with a one-off set of data send the node a message with:\nmsg.action = \"load\"\nmsg.payload = [\n{topic: \"mytopic1\", data: [{x: x1,y:y2},{x:x2,y:y2},...]},\n{topic: \"mytopic2\", data: [{x: x1,y:y2},{x:x2,y:y2},...]},\n...]\nWhere mytopic1 and mytopic2 are the the topics specified in the chartDef\n\nTo provide the chart with data incrementally (for a time series for example)\nsend it messages of the form\n{topic: \"mytopic1\", payload: {x:xvalue,y:yvalue}}\nThe chart will be updated as each sample is provided.\nTo limit the growth of the chart set chartMaxPoints and/or chartTimeSpan in the Chart Helper node\nas described at the head of that node.\nIf you find that chart seems to flicker and scroll bars come and go then try \nsetting a size other than auto in the Size specification for this node.\n\nFor Bar charts the x value is the label for the bar and the y value is the bar value\n\nNote that since the chart samples are stored in the browser then the chart will be cleared each\ntime the browser is refreshed (and will be clear on initially opening the view). In order to \nprovided persistency over browser opening and refresh this node may be used in conjunction with\nthe Chart Helper function node.  Details for its use are in the source of that node.\n\nIf your flow includes more that one instance of this script then the line fetching \nChart.bundle.min.js need only be included in one of them\n-->\n\n<script src=\"/Chart.bundle.min.js\"></script>\n<canvas id=\"myChartSimple1\" width=\"300\" height=\"300\"></canvas>\n<script>\n(function() {\n    var chartID = \"myChartSimple1\";           // set this to the id you have specified in the canvas tag above\n    // setup the chart definition as defined in the chart.js documentation, in addition setting up the topic\n    // for each channel\n    var chartDef = {\n        type: 'line',\n        data: {\n            datasets: [{\n                topic: \"Sin\",    // used here not by chart.js\n                label: \"Sin\",\n                yAxisID: \"1\",\n                fill: false,\n                lineTension: 0,\n                borderColor: \"#0000ff\",\n                pointRadius: 5,\n                pointHoverRadius: 5,\n                pointBorderColor: \"#0000ff\",\n                pointBackgroundColor: \"#0000ff\",\n                backgroundColor:  \"#0000ff\",\n                borderWidth: 1,\n                data: []  // data is written here later\n            }, {\n                topic: \"Triangle\",    // used here not by chart.js\n                label: \"Triangle\",\n                yAxisID: \"2\",\n                fill: false,\n                lineTension: 0,\n                borderColor: \"#ff0000\",\n                pointRadius: 5,\n                pointHoverRadius: 5,\n                pointBorderColor: \"#ff0000\",\n                pointBackgroundColor: \"#ff0000\",\n                backgroundColor:  \"#ff0000\",\n                borderWidth: 1,\n                data: []  // data is written here later\n            }]\n        },\n        options: {\n            scales: {\n                xAxes: [{\n                    type: 'linear',\n                    position: 'bottom'\n                    }\n                ],\n                yAxes: [{\n                    id: \"1\",\n                    ticks: {\n                        min: -1,\n                        max: 1,\n                        stepSize: 0.2\n                    }\n                }, {\n                    id: \"2\",\n                    ticks: {\n                        min: -10,\n                        max: 10,\n                        stepSize: 2\n                    }\n                }]\n            },\n            animation: {\n                duration: 0\n            }\n        }\n    }\n        \n/***** You shouldn't normally need to change anything below here *****/    \n    var myChart = null;\n    var loaded = false;     // indicates whether we have already had a load action\n    var chartTimeSpan;\n    var chartMaxPoints;\n\n    function doChart(msg, scope) {\n        if (!myChart) {\n            // chart does not exist so load the data and create it\n            var ctx = document.getElementById(chartID);\n            myChart = new Chart(ctx, chartDef);     \n        }\n        // chart already exists, update it\n        var datasets = myChart.data.datasets;\n        // is this a load or preload action?\n        if (msg.action === \"load\" || msg.action === \"preload\") {\n            // yes, do not allow preload if we have already had a load\n            // so do it if this is a load or we have not previously had a load\n            if (msg.action === \"load\" || !loaded) {\n                // pick up chartTimeSpan and chartMaxPoints if they have been provided\n                if (typeof msg.chartTimeSpan != 'undefined') {\n                    chartTimeSpan = msg.chartTimeSpan;\n                }\n                if (typeof msg.chartMaxPoints != 'undefined') {\n                    chartMaxPoints = msg.chartMaxPoints;\n                }\n                    \n                // replace existing data for matching topics\n                for (var j = 0; j < msg.payload.length; j++) {\n                    var topic = msg.payload[j].topic;\n                    // find it in the chart\n                    for (var i = 0; i < datasets.length; i++) {\n                        if (datasets[i].topic == topic) {\n                            // if stripping old samples by time is required then ensure the x value is Date\n                            if (chartTimeSpan > 0 ) {\n                                var data = msg.payload[j].data;\n                                for (var k = 0; k < data.length; k++) {\n                                    if (typeof data[k].x === \"string\") {\n                                        data[k].x = new Date(data[k].x);\n                                    }\n                                }\n                            }\n                            if (chartDef.type !== \"bar\") {\n                                datasets[i].data = msg.payload[j].data;\n                            } else {\n                                // bar chart so x values must go to labels and y values to dataset\n                                datasets[i].data = [];\n                                myChart.data.labels = [];\n                                var data = msg.payload[j].data;\n                                for (var k = 0; k < data.length; k++) {\n                                    datasets[i].data.push(data[k].y);\n                                    myChart.data.labels.push(data[k].x);\n                                }\n                            }\n                            break;\n                        }\n                    }\n                }\n            }\n            if (msg.action === \"load\") loaded = true;\n            myChart.update();\n        } else {\n            // does the topic match one of the datasets?\n            for (var i = 0; i < datasets.length; i++) {\n                if (datasets[i].topic == msg.topic) {\n                    // if stripping old samples by time is required then ensure the x value is Date\n                    if (chartTimeSpan > 0 && typeof msg.payload.x === \"string\") {\n                        msg.payload.x = new Date(msg.payload.x);\n                    }\n                    if (chartDef.type !== \"bar\") {\n                        datasets[i].data.push(msg.payload);\n                    } else {\n                         // bar chart so x value must go to labels and y value to dataset\n                        datasets[i].data.push(msg.payload.y);\n                        myChart.data.labels.push(msg.payload.x);\n                    }\n                    myChart.update();\n                    break;\n                }\n            }\n        }\n        // strip off samples older than now\n        // charTimeSpan == 0 implies don't do it\n        var shifted = false;\n        if (chartTimeSpan > 0) {\n            var now = new Date();\n            var oldestTimeAllowed = now - chartTimeSpan;\n            for (var i = 0; i < datasets.length; i++) {\n                dataset = datasets[i];\n                while(dataset.data[0] && getTime(dataset.data[0].x) < oldestTimeAllowed) {\n                    dataset.data.shift();\n                    shifted = true;\n                }\n            }\n        }\n        // strip samples off the front if there are now too many\n        // charTimeSpan == 0 implies don't do it\n        if (chartMaxPoints > 0) {\n            for (var i = 0; i < datasets.length; i++) {\n                dataset = datasets[i];\n                while(dataset.data.length > chartMaxPoints) {\n                    dataset.data.shift();\n                    shifted = true;\n                }\n            }\n        }\n        if (shifted) {\n            myChart.update();\n        }\n    };\n\n    // gets the time of an x value, works for strings or Date types\n    function getTime(x) {\n        if (typeof x === \"string\") x = new Date(x);\n        return x.getTime();\n    }\n    \n    // builds the preload message for sending back to the chart helper\n    function preloadMsg() {\n        var preMsg = {action: \"preload\", payload: \"preload\"};\n        // build array of topics in chart\n        var topics = [];\n        for (var i=0; i<chartDef.data.datasets.length; i++) {\n            topics.push(chartDef.data.datasets[i].topic);\n        }\n        preMsg.topics = topics;\n        // has the chart already been created\n        if (myChart) {\n            preMsg.lastXValue = 1;\n        } else {\n            preMsg.lastXValue = 0;\n        }\n        return preMsg;\n    }\n\n    (function(scope) {\n        // this code gets run when the a view is opened on the node in the browser\n        // send a preload message back to node red to ask it send\n        // us a complete set of data. Pass down max points and time span to the helper node for it to use\n        // plus an array of the topics of interest\n        scope.send( preloadMsg() );\n        \n        scope.$watch('msg', function(msg) {\n            if (msg) {\n                doChart(msg, scope);\n            }\n        });\n    })(scope);\n})();\n</script>\n",
       "storeOutMessages": false,
       "fwdInMessages": false,
       "templateScope": "local",
       "x": 796.5499572753906,
       "y": 1363.8833312988281,
       "wires": [
           []
       ]
   },
   {
       "id": "382b4940.b5aece",
       "type": "debug",
       "z": "d25606275138920f",
       "name": "View data object",
       "active": true,
       "tosidebar": true,
       "console": false,
       "complete": "true",
       "statusVal": "",
       "statusType": "auto",
       "x": 794.0000305175781,
       "y": 1423.1333312988281,
       "wires": []
   },
   {
       "id": "e8e31a24.1c89d",
       "type": "inject",
       "z": "d25606275138920f",
       "name": "Load Data Set",
       "repeat": "",
       "crontab": "",
       "once": false,
       "topic": "",
       "payload": "",
       "payloadType": "str",
       "x": 333.99998474121094,
       "y": 1308.3833312988281,
       "wires": [
           [
               "4f0a7091.a1a64"
           ]
       ]
   },
   {
       "id": "4f0a7091.a1a64",
       "type": "function",
       "z": "d25606275138920f",
       "name": "Pre-load test data",
       "func": "\n/* This function creates a two data sets, with different topics,\n   the same x values and different y values*/\n\n// Change the scale factor each time.\nvar scale = context.get('scale') || 0;\nif (msg.topic == \"Reset\") {\n    scale = 0;\n}\nscale++;\ncontext.set('scale', scale);\n\nmsg.payload = [];       // This will be an array of {topic, data} objects\nvar dataPoints1 = [];   // These will be the first array of data points \nvar dataPoints2 = [];   // These will be the second array of data points \nvar numPoints = 20;     // We will create one more than this.\n\n// For the first data set create a sine wave\nfor (var i=0; i<=numPoints; i++) {\n    var point = {};\n    point.x = i;\n    point.y = Math.sin(2 * 3.14 * (i/numPoints)) * scale/10;\n    // build the data array    \n    dataPoints1.push(point);\n}\n\n// For the second data set create a triangle\nfor (var i=0; i<=numPoints; i++) {\n    var point = {};\n    point.x = i;\n    if (i<(numPoints/2)) {\n        // ramp up\n        point.y = i * scale/10;\n    }\n    else {\n        // ramp down\n        point.y = (numPoints - i) * scale/10;\n    }\n    dataPoints2.push(point);    // add to the array\n}\n\nmsg.action = \"load\";    // This instructs the chart node to paint the data\n\n// The payload is an array of two {topic, data} objects\nmsg.payload = [{topic: \"Sin\", data: dataPoints1},\n                {topic: \"Triangle\", data: dataPoints2}];\n\nreturn msg;",
       "outputs": 1,
       "noerr": 0,
       "x": 575,
       "y": 1364.5333251953125,
       "wires": [
           [
               "2b14c627.b060aa",
               "382b4940.b5aece"
           ]
       ]
   },
   {
       "id": "60b53a17.513d74",
       "type": "ui_button",
       "z": "d25606275138920f",
       "name": "New Data Button",
       "group": "b1d9d1fa.350a38",
       "order": 0,
       "width": 0,
       "height": 0,
       "label": "New Data",
       "color": "",
       "bgcolor": "",
       "icon": "",
       "payload": "",
       "payloadType": "str",
       "topic": "",
       "x": 321.99998474121094,
       "y": 1366.183334350586,
       "wires": [
           [
               "4f0a7091.a1a64"
           ]
       ]
   },
   {
       "id": "e44ff289.b11b28",
       "type": "ui_button",
       "z": "d25606275138920f",
       "name": "Reset",
       "group": "b1d9d1fa.350a38",
       "order": 0,
       "width": 0,
       "height": 0,
       "label": "Reset",
       "color": "",
       "bgcolor": "",
       "icon": "",
       "payload": "",
       "payloadType": "str",
       "topic": "Reset",
       "x": 358,
       "y": 1421.1833190917969,
       "wires": [
           [
               "4f0a7091.a1a64"
           ]
       ]
   },
   {
       "id": "b1d9d1fa.350a38",
       "type": "ui_group",
       "name": "Chart with integer X axis",
       "tab": "9d7c530e.2785a",
       "order": 1,
       "disp": true,
       "width": "12"
   },
   {
       "id": "9d7c530e.2785a",
       "type": "ui_tab",
       "name": "Chart.js example",
       "icon": "dashboard",
       "order": 2
   }
]
Aber da musst Dich reinfuchsen. Die Nodes, die Du vorher versucht hast, die haben bei mir auch nicht funktioniert.
-
@bernd1967 hast du hier ein Ergebnis hinbekommen ?
Hey! Du scheinst an dieser Unterhaltung interessiert zu sein, hast aber noch kein Konto.
Hast du es satt, bei jedem Besuch durch die gleichen Beiträge zu scrollen? Wenn du dich für ein Konto anmeldest, kommst du immer genau dorthin zurück, wo du zuvor warst, und kannst dich über neue Antworten benachrichtigen lassen (entweder per E-Mail oder Push-Benachrichtigung). Du kannst auch Lesezeichen speichern und Beiträge positiv bewerten, um anderen Community-Mitgliedern deine Wertschätzung zu zeigen.
Mit deinem Input könnte dieser Beitrag noch besser werden 💗
Registrieren AnmeldenSupport us
645
Online33.0k
Benutzer83.3k
Themen1.3m
Beiträge