

ERL: Cron-Daemon-Mails von PVE bzgl. smartctl
-
Seit neuestem kommen bei mir Mails durch, die ich bisher nicht kannte.
Ein Cron-Job, der im Hypervisor ausgeführt wird, und die Festplatten testen soll schmeißt jetzt Mails aus, weil eine der Festplatten bei den smartctl Queries etwas zickt ...
Returncode 4Bit 2:
Some SMART or other ATA command to the disk failed, or there was a checksum error in a SMART data structure (see '-b' option above).
Scheint bei der USB-HDD so zu sein, dass die da bei einigen Parametern zickt, ansonsten sehen die Health-Parameter alle ok aus ...
Mails werden seit 17.10 04:11 für jeden Cron-Durchlauf generiert ....
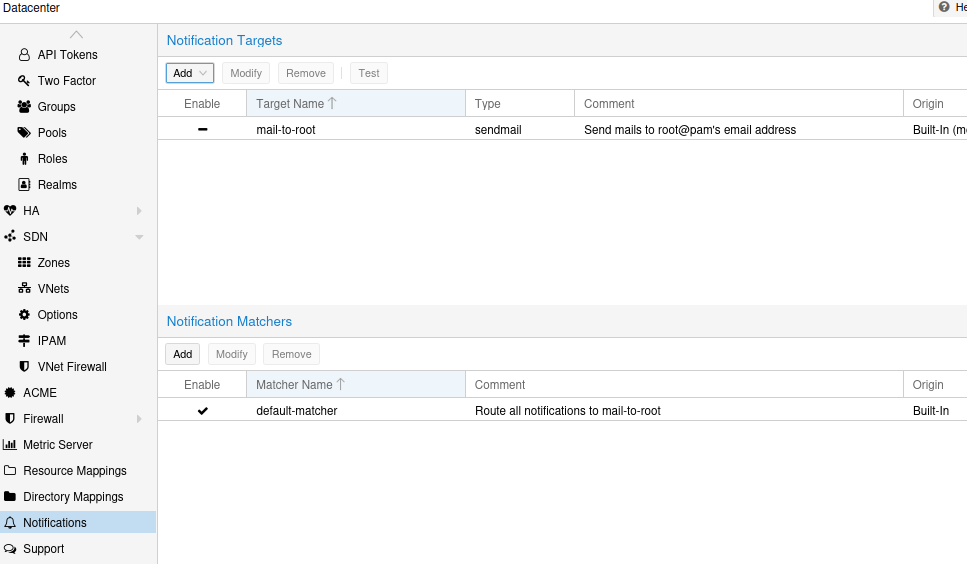
Entweder hat sich bei einem Proxmox-Update der Mailer von selber eingeschaltet, oder ein Spam-Filter meines Mail-Kontos ist nicht mehr so scharf wie früher ...Habe jetzt erstmal den Mailversand abgestellt (Strich statt Haken im untenstehenden Screenshot)
Mails sahen so aus ...
Cron Eintrag dazu
11 */4 * * * bash /root/scripte/Proxmox_Skripte/check_usb_hdd.sh 2>&1 /dev/nullMuss mal schauen, dass ich feiner granuliert nur von diesem Script keine Alarm-Mail bekomme... bin mir nicht sicher, ob ich bei den Umleitungen bei dem Crontab Eintrag alles richtig gemacht habe...
Intel(R) Celeron(R) CPU N3000 @1.04GHz 8G RAM 480G SSD * Virtualization : unprivileged lxc container on Proxmox * 6 GByte RAM für den iobroker Container * Remote-Access über Wireguard meiner Fritzbox
-
Seit neuestem kommen bei mir Mails durch, die ich bisher nicht kannte.
Ein Cron-Job, der im Hypervisor ausgeführt wird, und die Festplatten testen soll schmeißt jetzt Mails aus, weil eine der Festplatten bei den smartctl Queries etwas zickt ...
Returncode 4Bit 2:
Some SMART or other ATA command to the disk failed, or there was a checksum error in a SMART data structure (see '-b' option above).
Scheint bei der USB-HDD so zu sein, dass die da bei einigen Parametern zickt, ansonsten sehen die Health-Parameter alle ok aus ...
Mails werden seit 17.10 04:11 für jeden Cron-Durchlauf generiert ....
Entweder hat sich bei einem Proxmox-Update der Mailer von selber eingeschaltet, oder ein Spam-Filter meines Mail-Kontos ist nicht mehr so scharf wie früher ...Habe jetzt erstmal den Mailversand abgestellt (Strich statt Haken im untenstehenden Screenshot)
Mails sahen so aus ...
Cron Eintrag dazu
11 */4 * * * bash /root/scripte/Proxmox_Skripte/check_usb_hdd.sh 2>&1 /dev/nullMuss mal schauen, dass ich feiner granuliert nur von diesem Script keine Alarm-Mail bekomme... bin mir nicht sicher, ob ich bei den Umleitungen bei dem Crontab Eintrag alles richtig gemacht habe...
@martinp Ergänzung - Hier die smartctl-Ausgabe
Obige Mail ist Jsonifiziert, um das Ergebnis besser mit Influx verarbeiten zu können.
EDIT: In der vorigen Version die SSD erwischtsmartctl 7.3 2022-02-28 r5338 [x86_64-linux-6.8.12-15-pve] (local build) Copyright (C) 2002-22, Bruce Allen, Christian Franke, www.smartmontools.org === START OF INFORMATION SECTION === Model Family: Seagate BarraCuda 3.5 (SMR) Device Model: ST4000DM004-2CV104 Serial Number: Z9703MW4 LU WWN Device Id: 5 000c50 0a28fd89c Firmware Version: 0001 User Capacity: 4,000,787,030,016 bytes [4.00 TB] Sector Sizes: 512 bytes logical, 4096 bytes physical Rotation Rate: 5425 rpm Device is: In smartctl database 7.3/5319 ATA Version is: ACS-3 T13/2161-D revision 5 SATA Version is: SATA 3.1, 6.0 Gb/s (current: 6.0 Gb/s) Local Time is: Thu Oct 23 13:35:58 2025 CEST SMART support is: Available - device has SMART capability. SMART support is: Enabled === START OF READ SMART DATA SECTION === SMART Status command failed: scsi error unsupported scsi opcode SMART overall-health self-assessment test result: PASSED Warning: This result is based on an Attribute check. General SMART Values: Offline data collection status: (0x82) Offline data collection activity was completed without error. Auto Offline Data Collection: Enabled. Self-test execution status: ( 0) The previous self-test routine completed without error or no self-test has ever been run. Total time to complete Offline data collection: ( 0) seconds. Offline data collection capabilities: (0x7b) SMART execute Offline immediate. Auto Offline data collection on/off support. Suspend Offline collection upon new command. Offline surface scan supported. Self-test supported. Conveyance Self-test supported. Selective Self-test supported. SMART capabilities: (0x0003) Saves SMART data before entering power-saving mode. Supports SMART auto save timer. Error logging capability: (0x01) Error logging supported. General Purpose Logging supported. Short self-test routine recommended polling time: ( 1) minutes. Extended self-test routine recommended polling time: ( 478) minutes. Conveyance self-test routine recommended polling time: ( 2) minutes. SCT capabilities: (0x30a5) SCT Status supported. SCT Data Table supported. SMART Attributes Data Structure revision number: 10 Vendor Specific SMART Attributes with Thresholds: ID# ATTRIBUTE_NAME FLAG VALUE WORST THRESH TYPE UPDATED WHEN_FAILED RAW_VALUE 1 Raw_Read_Error_Rate 0x000f 079 062 006 Pre-fail Always - 81140992 3 Spin_Up_Time 0x0003 096 096 000 Pre-fail Always - 0 4 Start_Stop_Count 0x0032 037 037 020 Old_age Always - 65535 5 Reallocated_Sector_Ct 0x0033 100 100 010 Pre-fail Always - 0 7 Seek_Error_Rate 0x000f 087 060 030 Pre-fail Always - 503426318 9 Power_On_Hours 0x0032 028 028 000 Old_age Always - 63505h+51m+29.298s 10 Spin_Retry_Count 0x0013 100 100 097 Pre-fail Always - 0 12 Power_Cycle_Count 0x0032 100 100 020 Old_age Always - 29 183 Runtime_Bad_Block 0x0032 100 100 000 Old_age Always - 0 184 End-to-End_Error 0x0032 100 100 099 Old_age Always - 0 187 Reported_Uncorrect 0x0032 100 100 000 Old_age Always - 0 188 Command_Timeout 0x0032 100 099 000 Old_age Always - 1 1 1 189 High_Fly_Writes 0x003a 100 100 000 Old_age Always - 0 190 Airflow_Temperature_Cel 0x0022 072 049 040 Old_age Always - 28 (Min/Max 24/42) 191 G-Sense_Error_Rate 0x0032 100 100 000 Old_age Always - 0 192 Power-Off_Retract_Count 0x0032 099 099 000 Old_age Always - 2562 193 Load_Cycle_Count 0x0032 004 004 000 Old_age Always - 193342 194 Temperature_Celsius 0x0022 028 051 000 Old_age Always - 28 (0 18 0 0 0) 195 Hardware_ECC_Recovered 0x001a 079 064 000 Old_age Always - 81140992 197 Current_Pending_Sector 0x0012 100 100 000 Old_age Always - 48 198 Offline_Uncorrectable 0x0010 100 100 000 Old_age Offline - 48 199 UDMA_CRC_Error_Count 0x003e 200 200 000 Old_age Always - 0 240 Head_Flying_Hours 0x0000 100 253 000 Old_age Offline - 18429h+04m+15.967s 241 Total_LBAs_Written 0x0000 100 253 000 Old_age Offline - 16731442768 242 Total_LBAs_Read 0x0000 100 253 000 Old_age Offline - 13243482656 SMART Error Log Version: 1 No Errors Logged SMART Self-test log structure revision number 1 No self-tests have been logged. [To run self-tests, use: smartctl -t] SMART Selective self-test log data structure revision number 1 SPAN MIN_LBA MAX_LBA CURRENT_TEST_STATUS 1 0 0 Not_testing 2 0 0 Not_testing 3 0 0 Not_testing 4 0 0 Not_testing 5 0 0 Not_testing Selective self-test flags (0x0): After scanning selected spans, do NOT read-scan remainder of disk. If Selective self-test is pending on power-up, resume after 0 minute delay. result: 4 p2 0 OK(4): test_hdd_data.sh drive health check data of system ssd retrievedIntel(R) Celeron(R) CPU N3000 @1.04GHz 8G RAM 480G SSD * Virtualization : unprivileged lxc container on Proxmox * 6 GByte RAM für den iobroker Container * Remote-Access über Wireguard meiner Fritzbox
-
@martinp Ergänzung - Hier die smartctl-Ausgabe
Obige Mail ist Jsonifiziert, um das Ergebnis besser mit Influx verarbeiten zu können.
EDIT: In der vorigen Version die SSD erwischtsmartctl 7.3 2022-02-28 r5338 [x86_64-linux-6.8.12-15-pve] (local build) Copyright (C) 2002-22, Bruce Allen, Christian Franke, www.smartmontools.org === START OF INFORMATION SECTION === Model Family: Seagate BarraCuda 3.5 (SMR) Device Model: ST4000DM004-2CV104 Serial Number: Z9703MW4 LU WWN Device Id: 5 000c50 0a28fd89c Firmware Version: 0001 User Capacity: 4,000,787,030,016 bytes [4.00 TB] Sector Sizes: 512 bytes logical, 4096 bytes physical Rotation Rate: 5425 rpm Device is: In smartctl database 7.3/5319 ATA Version is: ACS-3 T13/2161-D revision 5 SATA Version is: SATA 3.1, 6.0 Gb/s (current: 6.0 Gb/s) Local Time is: Thu Oct 23 13:35:58 2025 CEST SMART support is: Available - device has SMART capability. SMART support is: Enabled === START OF READ SMART DATA SECTION === SMART Status command failed: scsi error unsupported scsi opcode SMART overall-health self-assessment test result: PASSED Warning: This result is based on an Attribute check. General SMART Values: Offline data collection status: (0x82) Offline data collection activity was completed without error. Auto Offline Data Collection: Enabled. Self-test execution status: ( 0) The previous self-test routine completed without error or no self-test has ever been run. Total time to complete Offline data collection: ( 0) seconds. Offline data collection capabilities: (0x7b) SMART execute Offline immediate. Auto Offline data collection on/off support. Suspend Offline collection upon new command. Offline surface scan supported. Self-test supported. Conveyance Self-test supported. Selective Self-test supported. SMART capabilities: (0x0003) Saves SMART data before entering power-saving mode. Supports SMART auto save timer. Error logging capability: (0x01) Error logging supported. General Purpose Logging supported. Short self-test routine recommended polling time: ( 1) minutes. Extended self-test routine recommended polling time: ( 478) minutes. Conveyance self-test routine recommended polling time: ( 2) minutes. SCT capabilities: (0x30a5) SCT Status supported. SCT Data Table supported. SMART Attributes Data Structure revision number: 10 Vendor Specific SMART Attributes with Thresholds: ID# ATTRIBUTE_NAME FLAG VALUE WORST THRESH TYPE UPDATED WHEN_FAILED RAW_VALUE 1 Raw_Read_Error_Rate 0x000f 079 062 006 Pre-fail Always - 81140992 3 Spin_Up_Time 0x0003 096 096 000 Pre-fail Always - 0 4 Start_Stop_Count 0x0032 037 037 020 Old_age Always - 65535 5 Reallocated_Sector_Ct 0x0033 100 100 010 Pre-fail Always - 0 7 Seek_Error_Rate 0x000f 087 060 030 Pre-fail Always - 503426318 9 Power_On_Hours 0x0032 028 028 000 Old_age Always - 63505h+51m+29.298s 10 Spin_Retry_Count 0x0013 100 100 097 Pre-fail Always - 0 12 Power_Cycle_Count 0x0032 100 100 020 Old_age Always - 29 183 Runtime_Bad_Block 0x0032 100 100 000 Old_age Always - 0 184 End-to-End_Error 0x0032 100 100 099 Old_age Always - 0 187 Reported_Uncorrect 0x0032 100 100 000 Old_age Always - 0 188 Command_Timeout 0x0032 100 099 000 Old_age Always - 1 1 1 189 High_Fly_Writes 0x003a 100 100 000 Old_age Always - 0 190 Airflow_Temperature_Cel 0x0022 072 049 040 Old_age Always - 28 (Min/Max 24/42) 191 G-Sense_Error_Rate 0x0032 100 100 000 Old_age Always - 0 192 Power-Off_Retract_Count 0x0032 099 099 000 Old_age Always - 2562 193 Load_Cycle_Count 0x0032 004 004 000 Old_age Always - 193342 194 Temperature_Celsius 0x0022 028 051 000 Old_age Always - 28 (0 18 0 0 0) 195 Hardware_ECC_Recovered 0x001a 079 064 000 Old_age Always - 81140992 197 Current_Pending_Sector 0x0012 100 100 000 Old_age Always - 48 198 Offline_Uncorrectable 0x0010 100 100 000 Old_age Offline - 48 199 UDMA_CRC_Error_Count 0x003e 200 200 000 Old_age Always - 0 240 Head_Flying_Hours 0x0000 100 253 000 Old_age Offline - 18429h+04m+15.967s 241 Total_LBAs_Written 0x0000 100 253 000 Old_age Offline - 16731442768 242 Total_LBAs_Read 0x0000 100 253 000 Old_age Offline - 13243482656 SMART Error Log Version: 1 No Errors Logged SMART Self-test log structure revision number 1 No self-tests have been logged. [To run self-tests, use: smartctl -t] SMART Selective self-test log data structure revision number 1 SPAN MIN_LBA MAX_LBA CURRENT_TEST_STATUS 1 0 0 Not_testing 2 0 0 Not_testing 3 0 0 Not_testing 4 0 0 Not_testing 5 0 0 Not_testing Selective self-test flags (0x0): After scanning selected spans, do NOT read-scan remainder of disk. If Selective self-test is pending on power-up, resume after 0 minute delay. result: 4 p2 0 OK(4): test_hdd_data.sh drive health check data of system ssd retrieved@martinp hab mal den cronjob umgebaut
11 */4 * * * bash /root/scripte/Proxmox_Skripte/check_usb_hdd.sh 1> /dev/null 2> /dev/nullAlles umgeleitet nach /dev/null, aber ob das den Returncode auch entschärft
EDIT Scheint geholfen zu haben, habe den Haken bei "Notifications / mail-to-root" wieder aktiviert, und bisher keine mails...
EDIT2: da fehlte ein führender Slash bei "/dev/null" hab es oben geändert...
Hey! Du scheinst an dieser Unterhaltung interessiert zu sein, hast aber noch kein Konto.
Hast du es satt, bei jedem Besuch durch die gleichen Beiträge zu scrollen? Wenn du dich für ein Konto anmeldest, kommst du immer genau dorthin zurück, wo du zuvor warst, und kannst dich über neue Antworten benachrichtigen lassen (entweder per E-Mail oder Push-Benachrichtigung). Du kannst auch Lesezeichen speichern und Beiträge positiv bewerten, um anderen Community-Mitgliedern deine Wertschätzung zu zeigen.
Mit deinem Input könnte dieser Beitrag noch besser werden 💗
Registrieren AnmeldenSupport us
428
Online33.0k
Benutzer83.4k
Themen1.3m
Beiträge