

JSON parsen
-
Für den FlexCharts-Adapter von @jrbwh möchte ich ein als JSON gespeichertes Chart mittels JSON.parse im RAM als Objekt anlagen. Leider gelingt es mir nicht (mehr). Der Inhalt des Datenpunktes mit dem Chart lautet ..
title: {
  text: 'Tageswerte',
  top: '5%',
  left: '5%',
  textStyle: {
    fontSize: 20,
    fontWeight: 'bold',
    color: '#ffffff'
  },
},
legend: {
  data: [
      {
        name: 'Gas',
        itemStyle: {color: '#00ff00'}
      },
      {
        name: 'gH',
        itemStyle: {color: '#ff0000'}
      },
      {
        name: 'gW',
                itemStyle: {color: '#0000ff'}
      },
      {
        name: 'pH',
        itemStyle: {color: '#ff7f7f'}
      },
      {
        name: 'pW',
        itemStyle: {color: '#7f7fff'}
      }
  ],
  orient: 'vertical',
  right: '10%'
},
tooltip: {},
xAxis: {
  data: ['Gas','gH','gW','pH','pW']
},
yAxis: {
  axisLabel: {
    formatter: '{value} KWh',
    align: 'center'
  }
},
grid: {
  left: '5%',
  right: '5%',
  top: '15%',
  bottom: '5%'
},
series: [
  {
    name: 'Gas',
    type: 'bar',
    stack: 'one',
    data: [{value: 0.81, itemStyle: {color: '#00ff00'}},0,0,0,0]
  },
  {
    name: 'gH',
    type: 'bar',
    stack: 'one',
    data: [0,{value: 66.6, itemStyle: {color: '#ff7f7f'}},0,0,0]
  },
  {
    name: 'gW',
    type: 'bar',
    stack: 'one',
    data: [0,0,{value: 3.9, itemStyle: {color: '#7f7fff'}},0,0]
  },
  {
    name: 'pH',
    type: 'bar',
    stack: 'one',
    data: [0,0,0,{value: 14.9, itemStyle: {color: '#ff0000'}},0]
  },
  {
    name: 'pW',
    type: 'bar',
    stack: 'one',
    data: [0,0,0,0,{value: 1.4, itemStyle: {color: '#0000ff'}}]
  }
]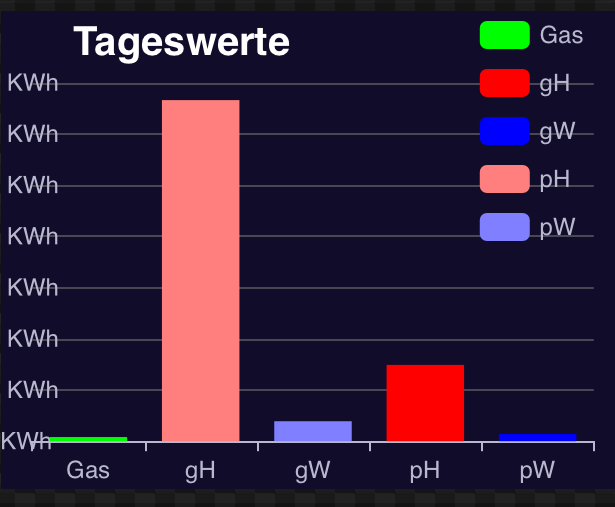
Was mache ich bloß falsch? Muss ich am Ende alle Bezeichner in Anführungszeichen setzen?
Raspberry Pi 5 mit 8GB + 120GB SSD + Coordinator COD-m + ioBroker ..
-
Für den FlexCharts-Adapter von @jrbwh möchte ich ein als JSON gespeichertes Chart mittels JSON.parse im RAM als Objekt anlagen. Leider gelingt es mir nicht (mehr). Der Inhalt des Datenpunktes mit dem Chart lautet ..
title: {
  text: 'Tageswerte',
  top: '5%',
  left: '5%',
  textStyle: {
    fontSize: 20,
    fontWeight: 'bold',
    color: '#ffffff'
  },
},
legend: {
  data: [
      {
        name: 'Gas',
        itemStyle: {color: '#00ff00'}
      },
      {
        name: 'gH',
        itemStyle: {color: '#ff0000'}
      },
      {
        name: 'gW',
                itemStyle: {color: '#0000ff'}
      },
      {
        name: 'pH',
        itemStyle: {color: '#ff7f7f'}
      },
      {
        name: 'pW',
        itemStyle: {color: '#7f7fff'}
      }
  ],
  orient: 'vertical',
  right: '10%'
},
tooltip: {},
xAxis: {
  data: ['Gas','gH','gW','pH','pW']
},
yAxis: {
  axisLabel: {
    formatter: '{value} KWh',
    align: 'center'
  }
},
grid: {
  left: '5%',
  right: '5%',
  top: '15%',
  bottom: '5%'
},
series: [
  {
    name: 'Gas',
    type: 'bar',
    stack: 'one',
    data: [{value: 0.81, itemStyle: {color: '#00ff00'}},0,0,0,0]
  },
  {
    name: 'gH',
    type: 'bar',
    stack: 'one',
    data: [0,{value: 66.6, itemStyle: {color: '#ff7f7f'}},0,0,0]
  },
  {
    name: 'gW',
    type: 'bar',
    stack: 'one',
    data: [0,0,{value: 3.9, itemStyle: {color: '#7f7fff'}},0,0]
  },
  {
    name: 'pH',
    type: 'bar',
    stack: 'one',
    data: [0,0,0,{value: 14.9, itemStyle: {color: '#ff0000'}},0]
  },
  {
    name: 'pW',
    type: 'bar',
    stack: 'one',
    data: [0,0,0,0,{value: 1.4, itemStyle: {color: '#0000ff'}}]
  }
]
Was mache ich bloß falsch? Muss ich am Ende alle Bezeichner in Anführungszeichen setzen?
hab copilot gesagt er soll mal:
{ "title": { "text": "Tageswerte", "top": "5%", "left": "5%", "textStyle": { "fontSize": 20, "fontWeight": "bold", "color": "#ffffff" } }, "legend": { "data": [ { "name": "Gas", "itemStyle": {"color": "#00ff00"} }, { "name": "gH", "itemStyle": {"color": "#ff0000"} }, { "name": "gW", "itemStyle": {"color": "#0000ff"} }, { "name": "pH", "itemStyle": {"color": "#ff7f7f"} }, { "name": "pW", "itemStyle": {"color": "#7f7fff"} } ], "orient": "vertical", "right": "10%" }, "tooltip": {}, "xAxis": { "data": ["Gas", "gH", "gW", "pH", "pW"] }, "yAxis": { "axisLabel": { "formatter": "{value} KWh", "align": "center" } }, "grid": { "left": "5%", "right": "5%", "top": "15%", "bottom": "5%" }, "series": [ { "name": "Gas", "type": "bar", "stack": "one", "data": [ {"value": 0.81, "itemStyle": {"color": "#00ff00"}}, 0, 0, 0, 0 ] }, { "name": "gH", "type": "bar", "stack": "one", "data": [ 0, {"value": 66.6, "itemStyle": {"color": "#ff7f7f"}}, 0, 0, 0 ] }, { "name": "gW", "type": "bar", "stack": "one", "data": [ 0, 0, {"value": 3.9, "itemStyle": {"color": "#7f7fff"}}, 0, 0 ] }, { "name": "pH", "type": "bar", "stack": "one", "data": [ 0, 0, 0, {"value": 14.9, "itemStyle": {"color": "#ff0000"}}, 0 ] }, { "name": "pW", "type": "bar", "stack": "one", "data": [ 0, 0, 0, 0, {"value": 1.4, "itemStyle": {"color": "#0000ff"}} ] } ] } -
hab copilot gesagt er soll mal:
{
  "title": {
    "text": "Tageswerte",
    "top": "5%",
    "left": "5%",
    "textStyle": {
      "fontSize": 20,
      "fontWeight": "bold",
      "color": "#ffffff"
    }
  },
  "legend": {
    "data": [
      {
        "name": "Gas",
        "itemStyle": {"color": "#00ff00"}
      },
      {
        "name": "gH",
        "itemStyle": {"color": "#ff0000"}
      },
      {
        "name": "gW",
        "itemStyle": {"color": "#0000ff"}
      },
      {
        "name": "pH",
        "itemStyle": {"color": "#ff7f7f"}
      },
      {
        "name": "pW",
        "itemStyle": {"color": "#7f7fff"}
      }
    ],
    "orient": "vertical",
    "right": "10%"
  },
  "tooltip": {},
  "xAxis": {
    "data": ["Gas", "gH", "gW", "pH", "pW"]
  },
  "yAxis": {
    "axisLabel": {
      "formatter": "{value} KWh",
      "align": "center"
    }
  },
  "grid": {
    "left": "5%",
    "right": "5%",
    "top": "15%",
    "bottom": "5%"
  },
  "series": [
    {
      "name": "Gas",
      "type": "bar",
      "stack": "one",
      "data": [
        {"value": 0.81, "itemStyle": {"color": "#00ff00"}},
        0,
        0,
        0,
        0
      ]
    },
    {
      "name": "gH",
      "type": "bar",
      "stack": "one",
      "data": [
        0,
        {"value": 66.6, "itemStyle": {"color": "#ff7f7f"}},
        0,
        0,
        0
      ]
    },
    {
      "name": "gW",
      "type": "bar",
      "stack": "one",
      "data": [
        0,
        0,
        {"value": 3.9, "itemStyle": {"color": "#7f7fff"}},
        0,
        0
      ]
    },
    {
      "name": "pH",
      "type": "bar",
      "stack": "one",
      "data": [
        0,
        0,
        0,
        {"value": 14.9, "itemStyle": {"color": "#ff0000"}},
        0
      ]
    },
    {
      "name": "pW",
      "type": "bar",
      "stack": "one",
      "data": [
        0,
        0,
        0,
        0,
        {"value": 1.4, "itemStyle": {"color": "#0000ff"}}
      ]
    }
  ]
}

Hey! Du scheinst an dieser Unterhaltung interessiert zu sein, hast aber noch kein Konto.
Hast du es satt, bei jedem Besuch durch die gleichen Beiträge zu scrollen? Wenn du dich für ein Konto anmeldest, kommst du immer genau dorthin zurück, wo du zuvor warst, und kannst dich über neue Antworten benachrichtigen lassen (entweder per E-Mail oder Push-Benachrichtigung). Du kannst auch Lesezeichen speichern und Beiträge positiv bewerten, um anderen Community-Mitgliedern deine Wertschätzung zu zeigen.
Mit deinem Input könnte dieser Beitrag noch besser werden 💗
Registrieren Anmelden458
Online33.0k
Benutzer83.3k
Themen1.3m
Beiträge