


"Unauthorized" Meldung beim Sign in in Grafana
-
@ro75 sagte in "Unauthorized" Meldung beim Sign in in Grafana:
@wibear Windows 11
Ro75
Das ist der Unterschied. Wie kann ich Grafana downgraden? -
@ro75 sagte in "Unauthorized" Meldung beim Sign in in Grafana:
Schaut mal hier nach.
Habe die Datei geändert und wollte Grafana neu starten mit:
sudo service grafana-server restart
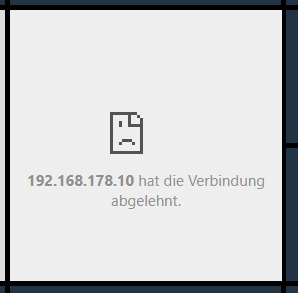
Jetzt läuft Grafana gar nicht mehr, auch nach dem Reboot von Raspi.
Was soll ich überprüfen? -
@ro75 sagte in "Unauthorized" Meldung beim Sign in in Grafana:
Schaut mal hier nach.
Habe die Datei geändert und wollte Grafana neu starten mit:
sudo service grafana-server restart
Jetzt läuft Grafana gar nicht mehr, auch nach dem Reboot von Raspi.
Was soll ich überprüfen? -
@wibear mal so versuchen
sudo systemctl start grafana-serverODER
sudo systemctl restart grafana-serverRo75.
-
@ro75 sagte in "Unauthorized" Meldung beim Sign in in Grafana:
dann hast du ggfs. die einen Fehler in die ini eingebaut.
Ich hab nur das geändert:

-
...skipping... ● grafana-server.service - Grafana instance Loaded: loaded (/lib/systemd/system/grafana-server.service; enabled; vendor preset: enabled) Active: failed (Result: exit-code) since Sat 2024-10-19 11:18:20 CEST; 15min ago Docs: http://docs.grafana.org Process: 3157 ExecStart=/usr/share/grafana/bin/grafana server --config=${CONF_FILE} --pidfile=${PID_FILE_DIR}/grafana> Main PID: 3157 (code=exited, status=1/FAILURE) CPU: 394ms Oct 19 11:18:20 iobroker-pi systemd[1]: grafana-server.service: Scheduled restart job, restart counter is at 5. Oct 19 11:18:20 iobroker-pi systemd[1]: Stopped Grafana instance. Oct 19 11:18:20 iobroker-pi systemd[1]: grafana-server.service: Start request repeated too quickly. Oct 19 11:18:20 iobroker-pi systemd[1]: grafana-server.service: Failed with result 'exit-code'. Oct 19 11:18:20 iobroker-pi systemd[1]: Failed to start Grafana instance. -
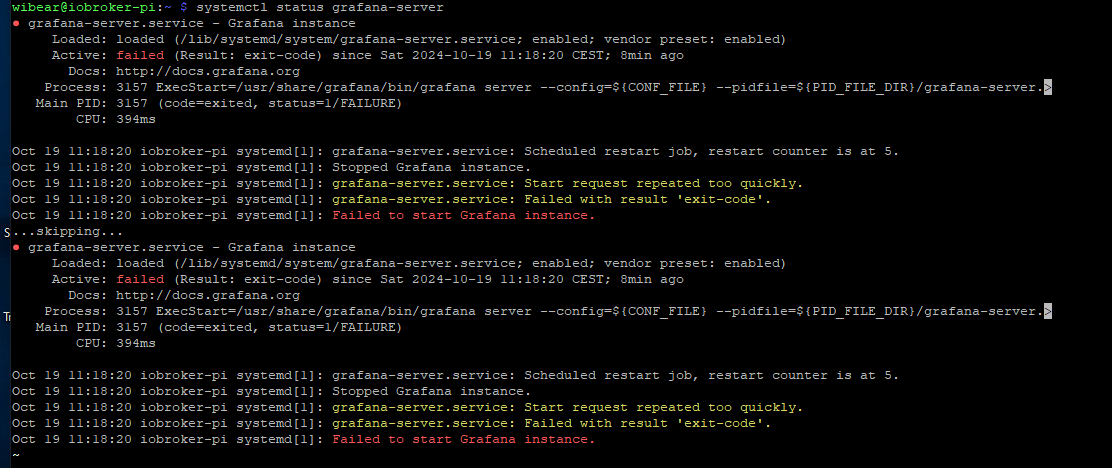
wibear@iobroker-pi:~ $ systemctl status grafana-server ● grafana-server.service - Grafana instance Loaded: loaded (/lib/systemd/system/grafana-server.service; enabled; vendor preset: enabled) Active: failed (Result: exit-code) since Sat 2024-10-19 11:18:20 CEST; 16min ago Docs: http://docs.grafana.org Process: 3157 ExecStart=/usr/share/grafana/bin/grafana server --config=${CONF_FILE} --pidfile=${PID_FILE_DIR}/grafana> Main PID: 3157 (code=exited, status=1/FAILURE) CPU: 394ms Oct 19 11:18:20 iobroker-pi systemd[1]: grafana-server.service: Scheduled restart job, restart counter is at 5. Oct 19 11:18:20 iobroker-pi systemd[1]: Stopped Grafana instance. Oct 19 11:18:20 iobroker-pi systemd[1]: grafana-server.service: Start request repeated too quickly. Oct 19 11:18:20 iobroker-pi systemd[1]: grafana-server.service: Failed with result 'exit-code'. Oct 19 11:18:20 iobroker-pi systemd[1]: Failed to start Grafana instance. -
wibear@iobroker-pi:~ $ systemctl status grafana-server ● grafana-server.service - Grafana instance Loaded: loaded (/lib/systemd/system/grafana-server.service; enabled; vendor preset: enabled) Active: failed (Result: exit-code) since Sat 2024-10-19 11:18:20 CEST; 16min ago Docs: http://docs.grafana.org Process: 3157 ExecStart=/usr/share/grafana/bin/grafana server --config=${CONF_FILE} --pidfile=${PID_FILE_DIR}/grafana> Main PID: 3157 (code=exited, status=1/FAILURE) CPU: 394ms Oct 19 11:18:20 iobroker-pi systemd[1]: grafana-server.service: Scheduled restart job, restart counter is at 5. Oct 19 11:18:20 iobroker-pi systemd[1]: Stopped Grafana instance. Oct 19 11:18:20 iobroker-pi systemd[1]: grafana-server.service: Start request repeated too quickly. Oct 19 11:18:20 iobroker-pi systemd[1]: grafana-server.service: Failed with result 'exit-code'. Oct 19 11:18:20 iobroker-pi systemd[1]: Failed to start Grafana instance. -
@ro75 sagte in "Unauthorized" Meldung beim Sign in in Grafana:
Die Kiste mal neu starten.
wibear@iobroker-pi:~ $ systemctl status grafana-server ● grafana-server.service - Grafana instance Loaded: loaded (/lib/systemd/system/grafana-server.service; enabled; vendor preset: enabled) Active: failed (Result: exit-code) since Sat 2024-10-19 11:37:43 CEST; 4min 36s ago Docs: http://docs.grafana.org Process: 1675 ExecStart=/usr/share/grafana/bin/grafana server --config=${CONF_FILE} --pidfile=${PID_FILE_DIR}/grafana> Main PID: 1675 (code=exited, status=1/FAILURE) CPU: 475ms Oct 19 11:37:43 iobroker-pi systemd[1]: grafana-server.service: Scheduled restart job, restart counter is at 5. Oct 19 11:37:43 iobroker-pi systemd[1]: Stopped Grafana instance. Oct 19 11:37:43 iobroker-pi systemd[1]: grafana-server.service: Start request repeated too quickly. Oct 19 11:37:43 iobroker-pi systemd[1]: grafana-server.service: Failed with result 'exit-code'. Oct 19 11:37:43 iobroker-pi systemd[1]: Failed to start Grafana instance. -
@ro75 sagte in "Unauthorized" Meldung beim Sign in in Grafana:
Die Kiste mal neu starten.
zum 2. Mal neu gestartet ohne Erfolg.
Support us
639
Online32.7k
Users82.5k
Topics1.3m
Posts