Skip to content
  • Home
  • Recent
  • Tags
  • 0 Unread 0
  • Categories
  • Unreplied
  • Popular
  • GitHub
  • Docu
  • Hilfe
Skins
  • Light
  • Brite
  • Cerulean
  • Cosmo
  • Flatly
  • Journal
  • Litera
  • Lumen
  • Lux
  • Materia
  • Minty
  • Morph
  • Pulse
  • Sandstone
  • Simplex
  • Sketchy
  • Spacelab
  • United
  • Yeti
  • Zephyr
  • Dark
  • Cyborg
  • Darkly
  • Quartz
  • Slate
  • Solar
  • Superhero
  • Vapor

  • Default (No Skin)
  • No Skin
Collapse
ioBroker Logo

Community Forum

donate donate
  1. ioBroker Community Home
  2. Deutsch
  3. Off Topic
  4. Grafana
  5. "Unauthorized" Meldung beim Sign in in Grafana

NEWS

  • Monatsrückblick Januar/Februar 2026 ist online!
    BluefoxB
    Bluefox
    16
    1
    346

  • Jahresrückblick 2025 – unser neuer Blogbeitrag ist online! ✨
    BluefoxB
    Bluefox
    17
    1
    4.8k

  • Neuer Blogbeitrag: Monatsrückblick - Dezember 2025 🎄
    BluefoxB
    Bluefox
    13
    1
    1.3k

"Unauthorized" Meldung beim Sign in in Grafana

Scheduled Pinned Locked Moved Grafana
123 Posts 9 Posters 10.5k Views 7 Watching
  • Oldest to Newest
  • Newest to Oldest
  • Most Votes
Reply
  • Reply as topic
Log in to reply
This topic has been deleted. Only users with topic management privileges can see it.
  • Ro75R Ro75

    @wibear sagte in "Unauthorized" Meldung beim Sign in in Grafana:

    Alles sicherheitshalber nochmals aktualisiert.

    Dann geh mit grafana mal auf die 11.2 zurück. Mein Windows ist auf dem aktuellsten Stand und habe keine Login Probleme. Allerdings bin ich noch nicht auf 11.2.2

    Ro75

    W Offline
    W Offline
    wibear
    wrote on last edited by
    #38

    @ro75
    Ich benutze Windows 10, und Du?

    Ro75R 1 Reply Last reply
    0
    • W wibear

      @ro75
      Ich benutze Windows 10, und Du?

      Ro75R Offline
      Ro75R Offline
      Ro75
      wrote on last edited by Ro75
      #39

      @wibear Windows 11

      Ro75

      SERVER = Beelink U59 16GB DDR4 RAM 512GB SSD, FB 7490, FritzDect 200+301+440, ConBee II, Zigbee Aqara Sensoren + NOUS A1Z, NOUS A1T, Philips Hue ** ioBroker, REDIS, influxdb2, Grafana, PiHole, Plex-Mediaserver, paperless-ngx (Docker), MariaDB + phpmyadmin *** VIS-Runtime = Intel NUC 8GB RAM 128GB SSD + 24" Touchscreen

      W 2 Replies Last reply
      0
      • Ro75R Ro75

        @wibear Windows 11

        Ro75

        W Offline
        W Offline
        wibear
        wrote on last edited by
        #40

        @ro75 sagte in "Unauthorized" Meldung beim Sign in in Grafana:

        @wibear Windows 11

        Ro75
        Das ist der Unterschied. Wie kann ich Grafana downgraden?

        Ro75R 1 Reply Last reply
        0
        • W wibear

          @ro75 sagte in "Unauthorized" Meldung beim Sign in in Grafana:

          @wibear Windows 11

          Ro75
          Das ist der Unterschied. Wie kann ich Grafana downgraden?

          Ro75R Offline
          Ro75R Offline
          Ro75
          wrote on last edited by
          #41

          @wibear sudo apt install grafana=11.2.0
          Eventuell ohne .0

          Ro75

          SERVER = Beelink U59 16GB DDR4 RAM 512GB SSD, FB 7490, FritzDect 200+301+440, ConBee II, Zigbee Aqara Sensoren + NOUS A1Z, NOUS A1T, Philips Hue ** ioBroker, REDIS, influxdb2, Grafana, PiHole, Plex-Mediaserver, paperless-ngx (Docker), MariaDB + phpmyadmin *** VIS-Runtime = Intel NUC 8GB RAM 128GB SSD + 24" Touchscreen

          1 Reply Last reply
          0
          • Ro75R Ro75

            @wibear Windows 11

            Ro75

            W Offline
            W Offline
            wibear
            wrote on last edited by
            #42

            @ro75

            Habe gerade auf Windows 11 ausprobiert mit 11.2.2: keine Anmeldung möglich.

            1 Reply Last reply
            0
            • Ro75R Offline
              Ro75R Offline
              Ro75
              wrote on last edited by Ro75
              #43

              Lösung?

              Schaut mal hier nach.

              Ro75

              SERVER = Beelink U59 16GB DDR4 RAM 512GB SSD, FB 7490, FritzDect 200+301+440, ConBee II, Zigbee Aqara Sensoren + NOUS A1Z, NOUS A1T, Philips Hue ** ioBroker, REDIS, influxdb2, Grafana, PiHole, Plex-Mediaserver, paperless-ngx (Docker), MariaDB + phpmyadmin *** VIS-Runtime = Intel NUC 8GB RAM 128GB SSD + 24" Touchscreen

              F W 2 Replies Last reply
              0
              • Ro75R Ro75

                Lösung?

                Schaut mal hier nach.

                Ro75

                F Offline
                F Offline
                funkydoc
                wrote on last edited by
                #44

                @ro75 top, danke das wars. Grafana.ini geändert und geht wieder.
                Vielen Dank 🙏

                1 Reply Last reply
                0
                • Ro75R Ro75

                  Lösung?

                  Schaut mal hier nach.

                  Ro75

                  W Offline
                  W Offline
                  wibear
                  wrote on last edited by
                  #45

                  @ro75 sagte in "Unauthorized" Meldung beim Sign in in Grafana:

                  Schaut mal hier nach.

                  Habe die Datei geändert und wollte Grafana neu starten mit:

                  sudo service grafana-server restart

                  Jetzt läuft Grafana gar nicht mehr, auch nach dem Reboot von Raspi.
                  Was soll ich überprüfen?

                  Ro75R 1 Reply Last reply
                  0
                  • W wibear

                    @ro75 sagte in "Unauthorized" Meldung beim Sign in in Grafana:

                    Schaut mal hier nach.

                    Habe die Datei geändert und wollte Grafana neu starten mit:

                    sudo service grafana-server restart

                    Jetzt läuft Grafana gar nicht mehr, auch nach dem Reboot von Raspi.
                    Was soll ich überprüfen?

                    Ro75R Offline
                    Ro75R Offline
                    Ro75
                    wrote on last edited by Ro75
                    #46

                    @wibear mal so versuchen

                    sudo systemctl start grafana-server
                    

                    ODER

                    sudo systemctl restart grafana-server
                    

                    Ro75.

                    SERVER = Beelink U59 16GB DDR4 RAM 512GB SSD, FB 7490, FritzDect 200+301+440, ConBee II, Zigbee Aqara Sensoren + NOUS A1Z, NOUS A1T, Philips Hue ** ioBroker, REDIS, influxdb2, Grafana, PiHole, Plex-Mediaserver, paperless-ngx (Docker), MariaDB + phpmyadmin *** VIS-Runtime = Intel NUC 8GB RAM 128GB SSD + 24" Touchscreen

                    W 1 Reply Last reply
                    0
                    • Ro75R Ro75

                      @wibear mal so versuchen

                      sudo systemctl start grafana-server
                      

                      ODER

                      sudo systemctl restart grafana-server
                      

                      Ro75.

                      W Offline
                      W Offline
                      wibear
                      wrote on last edited by
                      #47

                      @ro75

                      Habe beides versucht, aber die Verindung zu <IP>:3000 wird abgelehnt

                      Ro75R 1 Reply Last reply
                      0
                      • W wibear

                        @ro75

                        Habe beides versucht, aber die Verindung zu <IP>:3000 wird abgelehnt

                        Ro75R Offline
                        Ro75R Offline
                        Ro75
                        wrote on last edited by
                        #48

                        @wibear dann hast du ggfs. die einen Fehler in die ini eingebaut.

                        Ro75.

                        SERVER = Beelink U59 16GB DDR4 RAM 512GB SSD, FB 7490, FritzDect 200+301+440, ConBee II, Zigbee Aqara Sensoren + NOUS A1Z, NOUS A1T, Philips Hue ** ioBroker, REDIS, influxdb2, Grafana, PiHole, Plex-Mediaserver, paperless-ngx (Docker), MariaDB + phpmyadmin *** VIS-Runtime = Intel NUC 8GB RAM 128GB SSD + 24" Touchscreen

                        W 1 Reply Last reply
                        0
                        • Ro75R Ro75

                          @wibear dann hast du ggfs. die einen Fehler in die ini eingebaut.

                          Ro75.

                          W Offline
                          W Offline
                          wibear
                          wrote on last edited by
                          #49

                          @ro75 sagte in "Unauthorized" Meldung beim Sign in in Grafana:

                          dann hast du ggfs. die einen Fehler in die ini eingebaut.

                          Ich hab nur das geändert:

                          3fc0768a-3ab5-4ff9-ac67-45e74b75a481-grafik.png

                          Ro75R 1 Reply Last reply
                          0
                          • W wibear

                            @ro75 sagte in "Unauthorized" Meldung beim Sign in in Grafana:

                            dann hast du ggfs. die einen Fehler in die ini eingebaut.

                            Ich hab nur das geändert:

                            3fc0768a-3ab5-4ff9-ac67-45e74b75a481-grafik.png

                            Ro75R Offline
                            Ro75R Offline
                            Ro75
                            wrote on last edited by
                            #50

                            @wibear was sagt

                            systemctl status grafana-server
                            

                            Ro75.

                            SERVER = Beelink U59 16GB DDR4 RAM 512GB SSD, FB 7490, FritzDect 200+301+440, ConBee II, Zigbee Aqara Sensoren + NOUS A1Z, NOUS A1T, Philips Hue ** ioBroker, REDIS, influxdb2, Grafana, PiHole, Plex-Mediaserver, paperless-ngx (Docker), MariaDB + phpmyadmin *** VIS-Runtime = Intel NUC 8GB RAM 128GB SSD + 24" Touchscreen

                            W 1 Reply Last reply
                            0
                            • Ro75R Ro75

                              @wibear was sagt

                              systemctl status grafana-server
                              

                              Ro75.

                              W Offline
                              W Offline
                              wibear
                              wrote on last edited by
                              #51

                              @ro75
                              91691768-167f-48f9-a471-89c1322b12da-grafik.png

                              ist es gut lesbar?

                              Ro75R 1 Reply Last reply
                              0
                              • W wibear

                                @ro75
                                91691768-167f-48f9-a471-89c1322b12da-grafik.png

                                ist es gut lesbar?

                                Ro75R Offline
                                Ro75R Offline
                                Ro75
                                wrote on last edited by
                                #52

                                @wibear nein. immer in code-tags (</>). Starte mal das Gerät mal neu.

                                Ro75.

                                SERVER = Beelink U59 16GB DDR4 RAM 512GB SSD, FB 7490, FritzDect 200+301+440, ConBee II, Zigbee Aqara Sensoren + NOUS A1Z, NOUS A1T, Philips Hue ** ioBroker, REDIS, influxdb2, Grafana, PiHole, Plex-Mediaserver, paperless-ngx (Docker), MariaDB + phpmyadmin *** VIS-Runtime = Intel NUC 8GB RAM 128GB SSD + 24" Touchscreen

                                W 2 Replies Last reply
                                0
                                • Ro75R Ro75

                                  @wibear nein. immer in code-tags (</>). Starte mal das Gerät mal neu.

                                  Ro75.

                                  W Offline
                                  W Offline
                                  wibear
                                  wrote on last edited by
                                  #53

                                  @ro75

                                  
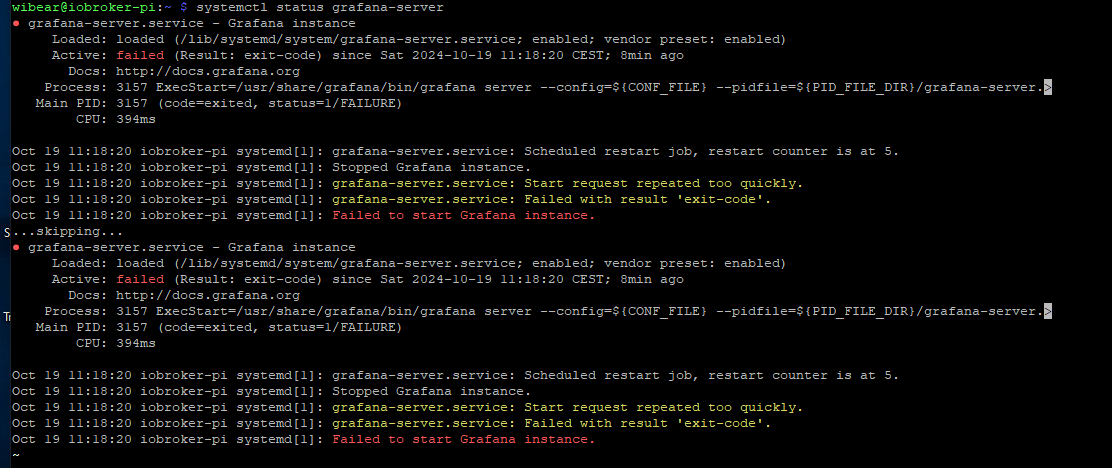
                                  ...skipping...
                                  ● grafana-server.service - Grafana instance
                                       Loaded: loaded (/lib/systemd/system/grafana-server.service; enabled; vendor preset: enabled)
                                       Active: failed (Result: exit-code) since Sat 2024-10-19 11:18:20 CEST; 15min ago
                                         Docs: http://docs.grafana.org
                                      Process: 3157 ExecStart=/usr/share/grafana/bin/grafana server --config=${CONF_FILE} --pidfile=${PID_FILE_DIR}/grafana>
                                     Main PID: 3157 (code=exited, status=1/FAILURE)
                                          CPU: 394ms
                                  
                                  Oct 19 11:18:20 iobroker-pi systemd[1]: grafana-server.service: Scheduled restart job, restart counter is at 5.
                                  Oct 19 11:18:20 iobroker-pi systemd[1]: Stopped Grafana instance.
                                  Oct 19 11:18:20 iobroker-pi systemd[1]: grafana-server.service: Start request repeated too quickly.
                                  Oct 19 11:18:20 iobroker-pi systemd[1]: grafana-server.service: Failed with result 'exit-code'.
                                  Oct 19 11:18:20 iobroker-pi systemd[1]: Failed to start Grafana instance.
                                  
                                  
                                  1 Reply Last reply
                                  0
                                  • Ro75R Ro75

                                    @wibear nein. immer in code-tags (</>). Starte mal das Gerät mal neu.

                                    Ro75.

                                    W Offline
                                    W Offline
                                    wibear
                                    wrote on last edited by
                                    #54

                                    @ro75

                                    wibear@iobroker-pi:~ $ systemctl status grafana-server
                                    ● grafana-server.service - Grafana instance
                                         Loaded: loaded (/lib/systemd/system/grafana-server.service; enabled; vendor preset: enabled)
                                         Active: failed (Result: exit-code) since Sat 2024-10-19 11:18:20 CEST; 16min ago
                                           Docs: http://docs.grafana.org
                                        Process: 3157 ExecStart=/usr/share/grafana/bin/grafana server --config=${CONF_FILE} --pidfile=${PID_FILE_DIR}/grafana>
                                       Main PID: 3157 (code=exited, status=1/FAILURE)
                                            CPU: 394ms
                                    
                                    Oct 19 11:18:20 iobroker-pi systemd[1]: grafana-server.service: Scheduled restart job, restart counter is at 5.
                                    Oct 19 11:18:20 iobroker-pi systemd[1]: Stopped Grafana instance.
                                    Oct 19 11:18:20 iobroker-pi systemd[1]: grafana-server.service: Start request repeated too quickly.
                                    Oct 19 11:18:20 iobroker-pi systemd[1]: grafana-server.service: Failed with result 'exit-code'.
                                    Oct 19 11:18:20 iobroker-pi systemd[1]: Failed to start Grafana instance.
                                    
                                    
                                    Ro75R 1 Reply Last reply
                                    0
                                    • W wibear

                                      @ro75

                                      wibear@iobroker-pi:~ $ systemctl status grafana-server
                                      ● grafana-server.service - Grafana instance
                                           Loaded: loaded (/lib/systemd/system/grafana-server.service; enabled; vendor preset: enabled)
                                           Active: failed (Result: exit-code) since Sat 2024-10-19 11:18:20 CEST; 16min ago
                                             Docs: http://docs.grafana.org
                                          Process: 3157 ExecStart=/usr/share/grafana/bin/grafana server --config=${CONF_FILE} --pidfile=${PID_FILE_DIR}/grafana>
                                         Main PID: 3157 (code=exited, status=1/FAILURE)
                                              CPU: 394ms
                                      
                                      Oct 19 11:18:20 iobroker-pi systemd[1]: grafana-server.service: Scheduled restart job, restart counter is at 5.
                                      Oct 19 11:18:20 iobroker-pi systemd[1]: Stopped Grafana instance.
                                      Oct 19 11:18:20 iobroker-pi systemd[1]: grafana-server.service: Start request repeated too quickly.
                                      Oct 19 11:18:20 iobroker-pi systemd[1]: grafana-server.service: Failed with result 'exit-code'.
                                      Oct 19 11:18:20 iobroker-pi systemd[1]: Failed to start Grafana instance.
                                      
                                      
                                      Ro75R Offline
                                      Ro75R Offline
                                      Ro75
                                      wrote on last edited by
                                      #55

                                      @wibear das ist ja von 11:18. Die Kiste mal neu starten.

                                      Ro75.

                                      SERVER = Beelink U59 16GB DDR4 RAM 512GB SSD, FB 7490, FritzDect 200+301+440, ConBee II, Zigbee Aqara Sensoren + NOUS A1Z, NOUS A1T, Philips Hue ** ioBroker, REDIS, influxdb2, Grafana, PiHole, Plex-Mediaserver, paperless-ngx (Docker), MariaDB + phpmyadmin *** VIS-Runtime = Intel NUC 8GB RAM 128GB SSD + 24" Touchscreen

                                      W 2 Replies Last reply
                                      0
                                      • Ro75R Ro75

                                        @wibear das ist ja von 11:18. Die Kiste mal neu starten.

                                        Ro75.

                                        W Offline
                                        W Offline
                                        wibear
                                        wrote on last edited by
                                        #56

                                        @ro75 sagte in "Unauthorized" Meldung beim Sign in in Grafana:

                                        Die Kiste mal neu starten.

                                        zum 2. Mal neu gestartet ohne Erfolg.

                                        43f046b4-4cd4-4f01-866c-5de0d4dd9f76-grafik.png

                                        Ro75R 1 Reply Last reply
                                        0
                                        • Ro75R Ro75

                                          @wibear das ist ja von 11:18. Die Kiste mal neu starten.

                                          Ro75.

                                          W Offline
                                          W Offline
                                          wibear
                                          wrote on last edited by
                                          #57

                                          @ro75 sagte in "Unauthorized" Meldung beim Sign in in Grafana:

                                          Die Kiste mal neu starten.

                                          
                                          wibear@iobroker-pi:~ $ systemctl status grafana-server
                                          ● grafana-server.service - Grafana instance
                                               Loaded: loaded (/lib/systemd/system/grafana-server.service; enabled; vendor preset: enabled)
                                               Active: failed (Result: exit-code) since Sat 2024-10-19 11:37:43 CEST; 4min 36s ago
                                                 Docs: http://docs.grafana.org
                                              Process: 1675 ExecStart=/usr/share/grafana/bin/grafana server --config=${CONF_FILE} --pidfile=${PID_FILE_DIR}/grafana>
                                             Main PID: 1675 (code=exited, status=1/FAILURE)
                                                  CPU: 475ms
                                          
                                          Oct 19 11:37:43 iobroker-pi systemd[1]: grafana-server.service: Scheduled restart job, restart counter is at 5.
                                          Oct 19 11:37:43 iobroker-pi systemd[1]: Stopped Grafana instance.
                                          Oct 19 11:37:43 iobroker-pi systemd[1]: grafana-server.service: Start request repeated too quickly.
                                          Oct 19 11:37:43 iobroker-pi systemd[1]: grafana-server.service: Failed with result 'exit-code'.
                                          Oct 19 11:37:43 iobroker-pi systemd[1]: Failed to start Grafana instance.
                                          
                                          
                                          1 Reply Last reply
                                          0
                                          Reply
                                          • Reply as topic
                                          Log in to reply
                                          • Oldest to Newest
                                          • Newest to Oldest
                                          • Most Votes


                                          Support us

                                          ioBroker
                                          Community Adapters
                                          Donate

                                          605

                                          Online

                                          32.7k

                                          Users

                                          82.5k

                                          Topics

                                          1.3m

                                          Posts
                                          Community
                                          Impressum | Datenschutz-Bestimmungen | Nutzungsbedingungen | Einwilligungseinstellungen
                                          ioBroker Community 2014-2025
                                          logo
                                          • Login

                                          • Don't have an account? Register

                                          • Login or register to search.
                                          • First post
                                            Last post
                                          0
                                          • Home
                                          • Recent
                                          • Tags
                                          • Unread 0
                                          • Categories
                                          • Unreplied
                                          • Popular
                                          • GitHub
                                          • Docu
                                          • Hilfe