

[solved] Custom HTML with Object ID bindings
-
Hello, I've noticed this question was asked at least 2 times but without answers.
I have custom html code:
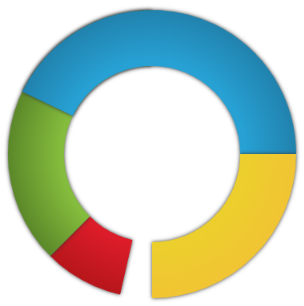
<!DOCTYPE html>
<html>
    <body>

        <canvas id="myCanvas" width="401" height="401" style="border:1px solid #d3d3d3;">
            Your browser does not support the HTML5 canvas tag.
        </canvas>

        <script type="text/javascript">

            var X = 200;
            var Y = 200;
            var outterRadius = 180;
            var innerRadius = 110;

            // 1. get a reference to myCanvas element.
            var c = document.getElementById("myCanvas");

            // 2. get canvas context
            var context = c.getContext("2d");

            // 3. draw donut chart

            // RED
            setRadialGradient("#DC1C29", "#B7161B");
            drawDonut(Math.PI * 0.5, Math.PI * 0.75);

            // GREEN
            setRadialGradient("#84BC3D", "#5B8829");
            drawDonut(Math.PI*0.75 , Math.PI* 1.5);

            // BLUE
            setRadialGradient("#27A1D4", "#2182AD");
            drawDonut(Math.PI * 1.5, Math.PI*2);

            // YELLOW
            setRadialGradient("#ECCF2D", "#F1C433");
            drawDonut(0, Math.PI*.5);

            //*******************************************************//\
            // drawDonut() function drawes 2 full or partial circles inside each other one clockwise and the other is counter-clockwise
            function drawDonut(sRadian, eRadian){

                context.beginPath();
                    context.arc(X, Y, outterRadius, sRadian, eRadian, false); // Outer: CCW
                    context.arc(X, Y, innerRadius, eRadian, sRadian, true); // Inner: CW
                context.closePath();

                // add shadow
                addShadow();

                context.fill();
            }

            function addShadow(){
                context.shadowColor = "#333";
                context.shadowBlur = 5;
                context.shadowOffsetX = 0;
                context.shadowOffsetY = 0;
            }

            function setRadialGradient(sgc, bgc){
                var grd = context.createRadialGradient(X, Y, innerRadius + 5, X, Y, outterRadius);
                grd.addColorStop(0,sgc);
                grd.addColorStop(1,bgc);
                context.fillStyle = grd;
            }
        </script>
    </body>
</html>
How to make
            // RED
            setRadialGradient("#DC1C29", "#B7161B");
            drawDonut(Math.PI * 0.5, Math.PI * 0.75);

            // GREEN
            setRadialGradient("#84BC3D", "#5B8829");
            drawDonut(Math.PI*0.75 , Math.PI* 1.5);
dynamic Object ID bindings something like:
drawDonut(Math.PI * {node-red.val1}, Math.PI * 0.75);?
-
Hello, I've noticed this question was asked at least 2 times but without answers.
I have custom html code:
<!DOCTYPE html>
<html>
    <body>

        <canvas id="myCanvas" width="401" height="401" style="border:1px solid #d3d3d3;">
            Your browser does not support the HTML5 canvas tag.
        </canvas>

        <script type="text/javascript">

            var X = 200;
            var Y = 200;
            var outterRadius = 180;
            var innerRadius = 110;

            // 1. get a reference to myCanvas element.
            var c = document.getElementById("myCanvas");

            // 2. get canvas context
            var context = c.getContext("2d");

            // 3. draw donut chart

            // RED
            setRadialGradient("#DC1C29", "#B7161B");
            drawDonut(Math.PI * 0.5, Math.PI * 0.75);

            // GREEN
            setRadialGradient("#84BC3D", "#5B8829");
            drawDonut(Math.PI*0.75 , Math.PI* 1.5);

            // BLUE
            setRadialGradient("#27A1D4", "#2182AD");
            drawDonut(Math.PI * 1.5, Math.PI*2);

            // YELLOW
            setRadialGradient("#ECCF2D", "#F1C433");
            drawDonut(0, Math.PI*.5);

            //*******************************************************//\
            // drawDonut() function drawes 2 full or partial circles inside each other one clockwise and the other is counter-clockwise
            function drawDonut(sRadian, eRadian){

                context.beginPath();
                    context.arc(X, Y, outterRadius, sRadian, eRadian, false); // Outer: CCW
                    context.arc(X, Y, innerRadius, eRadian, sRadian, true); // Inner: CW
                context.closePath();

                // add shadow
                addShadow();

                context.fill();
            }

            function addShadow(){
                context.shadowColor = "#333";
                context.shadowBlur = 5;
                context.shadowOffsetX = 0;
                context.shadowOffsetY = 0;
            }

            function setRadialGradient(sgc, bgc){
                var grd = context.createRadialGradient(X, Y, innerRadius + 5, X, Y, outterRadius);
                grd.addColorStop(0,sgc);
                grd.addColorStop(1,bgc);
                context.fillStyle = grd;
            }
        </script>
    </body>
</html>
How to make
            // RED
            setRadialGradient("#DC1C29", "#B7161B");
            drawDonut(Math.PI * 0.5, Math.PI * 0.75);

            // GREEN
            setRadialGradient("#84BC3D", "#5B8829");
            drawDonut(Math.PI*0.75 , Math.PI* 1.5);
dynamic Object ID bindings something like:
drawDonut(Math.PI * {node-red.val1}, Math.PI * 0.75);?
@KarolisL To the best of my knowledge, Bindings are not possible in Javascript code, only in the vis attributes. If your topic is realated to html in vis, then you could get the states value by using the value of
vis.states. But note that vis.states only contains the values of the states which are necessary for your widgets. So you could add a dummy widget with the desired states and make it invisible. Probabaly there is also the possibility to usesocket.emit('getState', 'yourState', function (err, state) {})when socket io is included.Hier könnt ihr mich unterstützen.
-
@KarolisL To the best of my knowledge, Bindings are not possible in Javascript code, only in the vis attributes. If your topic is realated to html in vis, then you could get the states value by using the value of
vis.states. But note that vis.states only contains the values of the states which are necessary for your widgets. So you could add a dummy widget with the desired states and make it invisible. Probabaly there is also the possibility to usesocket.emit('getState', 'yourState', function (err, state) {})when socket io is included.@foxriver76 Thanks for quick response. Sadly I didn't understand fully:
Lets say I tried to use state admin.0.info.updatesNumber which is internal in admin.0 object
var part1=vis.states(admin.0.info.updatesNumber);
            // RED
            setRadialGradient("#DC1C29", "#B7161B");
            drawDonut(Math.PI * part1, Math.PI * 0.75);
As I understand I'm missing something, how to extract state value by using:
vis.statescommand?
-
@foxriver76 Thanks for quick response. Sadly I didn't understand fully:
Lets say I tried to use state admin.0.info.updatesNumber which is internal in admin.0 object
var part1=vis.states(admin.0.info.updatesNumber);
            // RED
            setRadialGradient("#DC1C29", "#B7161B");
            drawDonut(Math.PI * part1, Math.PI * 0.75);
As I understand I'm missing something, how to extract state value by using:
vis.statescommand?
@KarolisL vis.states is just an array. By logging it you can get the contained information in the browsers console.
<script type="text/javascript">
    console.log(vis.states);
</script>
It's an array with the following structure:
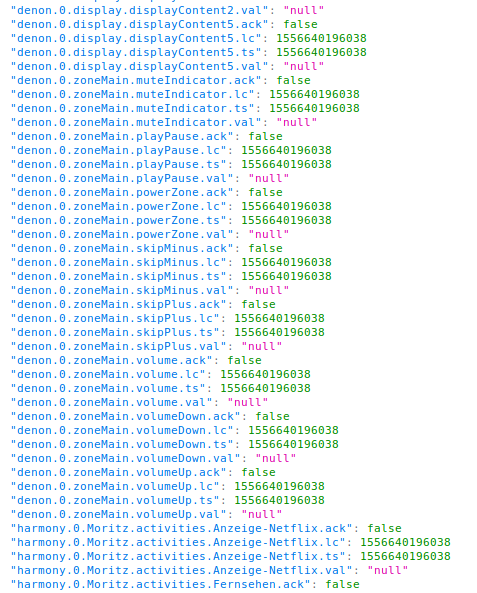
So it contains the states value, ts, last changed ts and acknowledge flag. You can access an array by its unqiue id:
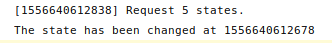
<script type="text/javascript">
    console.log('The state has been changed at ' + vis.states["denon.0.zoneMain.volumeDown.lc"]);
</script>
which results in:
Hier könnt ihr mich unterstützen.
-
@KarolisL vis.states is just an array. By logging it you can get the contained information in the browsers console.
<script type="text/javascript">
    console.log(vis.states);
</script>
It's an array with the following structure:
So it contains the states value, ts, last changed ts and acknowledge flag. You can access an array by its unqiue id:
<script type="text/javascript">
    console.log('The state has been changed at ' + vis.states["denon.0.zoneMain.volumeDown.lc"]);
</script>
which results in:
@foxriver76 Thank you. For future references if anybody will have similar problems:
to access global variables/objects you just have to address them through
var variable = vis.states["node-red.0.DATA"] // or whatever you see in console.log (vis.states())can't thank you enough
How to mark as solved?
-
@KarolisL you are welcome.
When editing the first post, you can change the title and e. g. write ‘[solved]’ in front of it.
One last question, this is how it looks in editor (pic1)
Why parts with vis.states are missing like that in runtime (pic2)?

<!DOCTYPE html> <html> <body> <canvas id="myCanvas" width="401" height="401" style="border:1px solid #d3d3d3;"> Your browser does not support the HTML5 canvas tag. </canvas> <script type="text/javascript"> console.log(vis.states["admin.0.info.updatesNumber.val"]); var part1 = vis.states["admin.0.info.updatesNumber.val"]/7; var X = 200; var Y = 200; var outterRadius = 180; var innerRadius = 110; // 1. get a reference to myCanvas element. var c = document.getElementById("myCanvas"); // 2. get canvas context var context = c.getContext("2d"); // 3. draw donut chart // RED setRadialGradient("#DC1C29", "#B7161B"); drawDonut(Math.PI *part1, Math.PI * 0.75); // GREEN setRadialGradient("#84BC3D", "#5B8829"); drawDonut(Math.PI*0.75 , Math.PI* 1.5); // BLUE setRadialGradient("#27A1D4", "#2182AD"); drawDonut(Math.PI * 2*part1, Math.PI*2); // YELLOW setRadialGradient("#ECCF2D", "#F1C433"); drawDonut(0, Math.PI*.5); //*******************************************************//\ // drawDonut() function drawes 2 full or partial circles inside each other one clockwise and the other is counter-clockwise function drawDonut(sRadian, eRadian){ context.beginPath(); context.arc(X, Y, outterRadius, sRadian, eRadian, false); // Outer: CCW context.arc(X, Y, innerRadius, eRadian, sRadian, true); // Inner: CW context.closePath(); // add shadow addShadow(); context.fill(); } function addShadow(){ context.shadowColor = "#333"; context.shadowBlur = 5; context.shadowOffsetX = 0; context.shadowOffsetY = 0; } function setRadialGradient(sgc, bgc){ var grd = context.createRadialGradient(X, Y, innerRadius + 5, X, Y, outterRadius); grd.addColorStop(0,sgc); grd.addColorStop(1,bgc); context.fillStyle = grd; } </script> </body> </html> -
One last question, this is how it looks in editor (pic1)
Why parts with vis.states are missing like that in runtime (pic2)?
<!DOCTYPE html> <html> <body> <canvas id="myCanvas" width="401" height="401" style="border:1px solid #d3d3d3;"> Your browser does not support the HTML5 canvas tag. </canvas> <script type="text/javascript"> console.log(vis.states["admin.0.info.updatesNumber.val"]); var part1 = vis.states["admin.0.info.updatesNumber.val"]/7; var X = 200; var Y = 200; var outterRadius = 180; var innerRadius = 110; // 1. get a reference to myCanvas element. var c = document.getElementById("myCanvas"); // 2. get canvas context var context = c.getContext("2d"); // 3. draw donut chart // RED setRadialGradient("#DC1C29", "#B7161B"); drawDonut(Math.PI *part1, Math.PI * 0.75); // GREEN setRadialGradient("#84BC3D", "#5B8829"); drawDonut(Math.PI*0.75 , Math.PI* 1.5); // BLUE setRadialGradient("#27A1D4", "#2182AD"); drawDonut(Math.PI * 2*part1, Math.PI*2); // YELLOW setRadialGradient("#ECCF2D", "#F1C433"); drawDonut(0, Math.PI*.5); //*******************************************************//\ // drawDonut() function drawes 2 full or partial circles inside each other one clockwise and the other is counter-clockwise function drawDonut(sRadian, eRadian){ context.beginPath(); context.arc(X, Y, outterRadius, sRadian, eRadian, false); // Outer: CCW context.arc(X, Y, innerRadius, eRadian, sRadian, true); // Inner: CW context.closePath(); // add shadow addShadow(); context.fill(); } function addShadow(){ context.shadowColor = "#333"; context.shadowBlur = 5; context.shadowOffsetX = 0; context.shadowOffsetY = 0; } function setRadialGradient(sgc, bgc){ var grd = context.createRadialGradient(X, Y, innerRadius + 5, X, Y, outterRadius); grd.addColorStop(0,sgc); grd.addColorStop(1,bgc); context.fillStyle = grd; } </script> </body> </html> -
@KarolisL only the states which are on the active view will be synced, that’s why in my screenshot so many values are null and browser console said only requested 5 states. So probably it’s due to this fact?
@foxriver76 The problem was that all states were present in tab-objects, but for them to appear in visualization and to be synchronized, you have to create dummy widget and make it invisible later as you mentioned in post 2. "So you could add a dummy widget with the desired states and make it invisible. "
Hey! Du scheinst an dieser Unterhaltung interessiert zu sein, hast aber noch kein Konto.
Hast du es satt, bei jedem Besuch durch die gleichen Beiträge zu scrollen? Wenn du dich für ein Konto anmeldest, kommst du immer genau dorthin zurück, wo du zuvor warst, und kannst dich über neue Antworten benachrichtigen lassen (entweder per E-Mail oder Push-Benachrichtigung). Du kannst auch Lesezeichen speichern und Beiträge positiv bewerten, um anderen Community-Mitgliedern deine Wertschätzung zu zeigen.
Mit deinem Input könnte dieser Beitrag noch besser werden 💗
Registrieren AnmeldenSupport us
276
Online33.0k
Benutzer83.5k
Themen1.3m
Beiträge