

"Filming" vis-views?
-
One question:
I have succeeded in displaying values of some sensors/adapters overlain ove a picture:
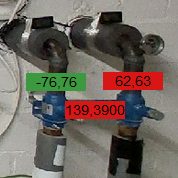
Now I would like to have a kind "video" of it.
Is there any possibility to have some adapter call the views regularly from (1) a specified start date/time for (2) a specified amount of time and (3) in a specified interval, and "capture" the visual output, adding these pictures to a kind of "video" (mp4?), if possible, (4) adding date and time to each frame?One could then view the development in a kind of time lapse
Thanks in advance
-
One question:
I have succeeded in displaying values of some sensors/adapters overlain ove a picture:
Now I would like to have a kind "video" of it.
Is there any possibility to have some adapter call the views regularly from (1) a specified start date/time for (2) a specified amount of time and (3) in a specified interval, and "capture" the visual output, adding these pictures to a kind of "video" (mp4?), if possible, (4) adding date and time to each frame?One could then view the development in a kind of time lapse
Thanks in advance
With the following library you can convert a html element
To a picture.
https://html2canvas.hertzen.com/documentation
But due to security reasons the browser is inside a sandbox and cannot save without user interaction files to disk but you can send data to server
You additional need an Iobroker Skript that receives the data and save it as picture to disk
With several tools you can convert a series of pictures to a video -
One question:
I have succeeded in displaying values of some sensors/adapters overlain ove a picture:
Now I would like to have a kind "video" of it.
Is there any possibility to have some adapter call the views regularly from (1) a specified start date/time for (2) a specified amount of time and (3) in a specified interval, and "capture" the visual output, adding these pictures to a kind of "video" (mp4?), if possible, (4) adding date and time to each frame?One could then view the development in a kind of time lapse
Thanks in advance
@wrod Ergänzung:
Vielleicht lässt sich das auch anders lösen. Dann bräuchte es einen Adapter o.ä., der nicht "Live" aufzeichnetn, sondern die entsprechenden Werte der gewünschten Zeitpunkte nacheinander aus der influxdb (oder einer anderen Datenbank) Datenbank holt, mit dem View visualisiert, und dann abspeichert.
Hey! Du scheinst an dieser Unterhaltung interessiert zu sein, hast aber noch kein Konto.
Hast du es satt, bei jedem Besuch durch die gleichen Beiträge zu scrollen? Wenn du dich für ein Konto anmeldest, kommst du immer genau dorthin zurück, wo du zuvor warst, und kannst dich über neue Antworten benachrichtigen lassen (entweder per E-Mail oder Push-Benachrichtigung). Du kannst auch Lesezeichen speichern und Beiträge positiv bewerten, um anderen Community-Mitgliedern deine Wertschätzung zu zeigen.
Mit deinem Input könnte dieser Beitrag noch besser werden 💗
Registrieren AnmeldenSupport us
354
Online33.0k
Benutzer83.3k
Themen1.3m
Beiträge