

Test Adapter flexcharts - Stapeldiagramme und mehr
-
Vielen Dank für den Adapter und die unendlichen Möglichkeiten für die Darstellung von Charts

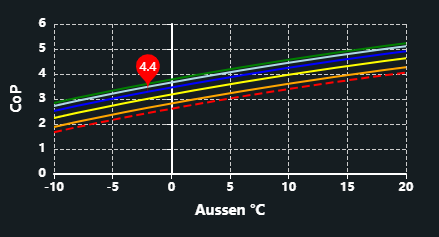
Ich scheitere derzeit an diesem Chart für ein CoP Netz der Wärmepumpe. Auf der Apache echarts Webseite funktioniert die Darstellung (bis auf Details und aktuellen Betriebspunkt) wie gewollt

In der Vis bleibt nur die Farbskala und der Rest ist weg

Der Datensatz dazu
Klar kann man das auch z.B. als Liniendiagramm darstellen, das klappt auch in Vis-2 ...aber das 3D scatter gefällt mir besser.
Eingebunden in der Vis über ein HTML widget mit Inhalt:http://192.168.178.9:8082/flexcharts/echarts.html?source=state&id=0_userdata.0.0000_Visualisierung.Heizung.copnetzHast Du eine Idee warum das in Vis-2 (vis nicht getestet) nicht angezeigt wird?
Danke vorab@ullij Das ist ziemlich seltsam. Es gibt Beispiele mit scatter3D, wenn ich aber in die Docs schaue bei series.type wird da kein scatter3D aufgelistet.
Und der Browser meldet in der Konsole "[ECharts] Unknown series scatter3D" beim Versuch, das Chart darzustellen.
Hab noch keine Idee, was da los ist. -
@jrbwh sagte in Test Adapter flexcharts - Stapeldiagramme und mehr:
@sms Ich habe das Skript mal als Text in die Anleitung eingefügt. Das ist leichter verständlich. Der State
chartWeeklyenthält die Definition des Charts. Das habe ich auf Basis eines Beispiels von den Apache Echart Seiten erstellt - wie ich weiter oben erläutert habe. Wenn das Chart anders aussehen soll, musst Du diesen State ändern.Für ein Daily Chart:
chartWeeklynachchartDailykopieren und ggf. anpassen
Ich scheitere irgendwie schon hierbei. Ich muss doch hier auf kopieren:
aber wo einfügen?tibberDailyanlegen und die richtigen Daten reinkopieren
Einfach hierüber anlegen?

- Im Skript die ersten 3 Konstanten kopieren und anpassen
- den Funktionsaufruf evalTibberData() (Zeile 9) kopieren und anpassen
- die Funktion on() kopieren und anpassen
Mal schauen ob ich das hinbekomme.
@sms Ja, das meine ich. Schau mal hier (https://www.youtube.com/@haus_automation), da gibt es eine hervorragende Tutorial-Reihe zum ioBroker.
-
Vielen Dank für den Adapter und die unendlichen Möglichkeiten für die Darstellung von Charts
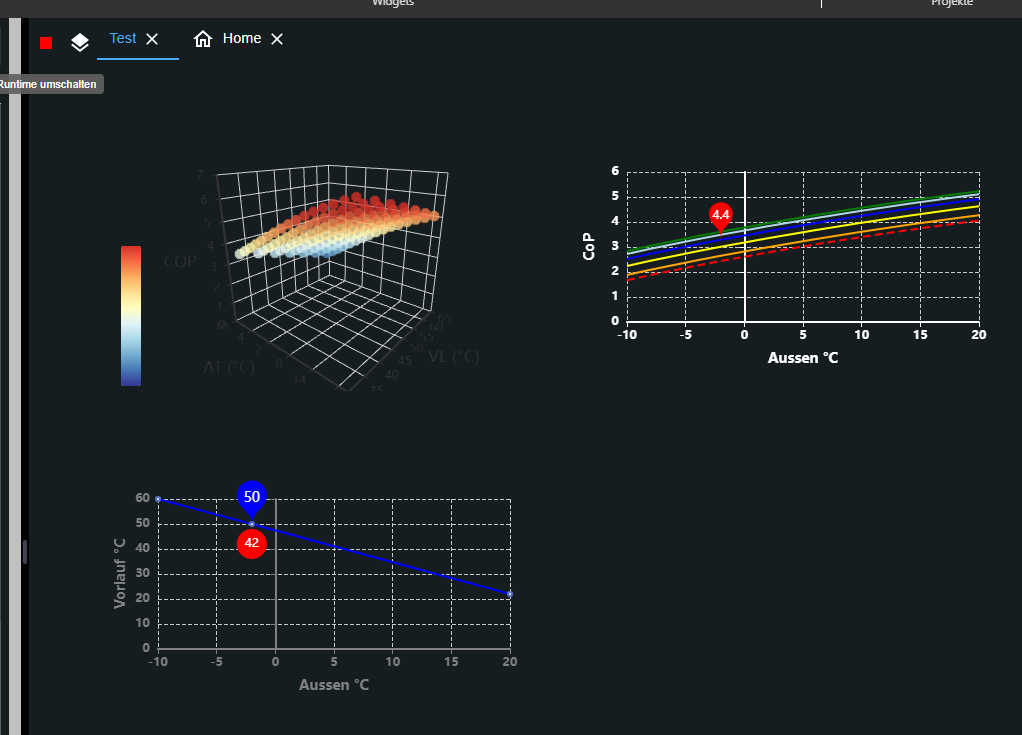
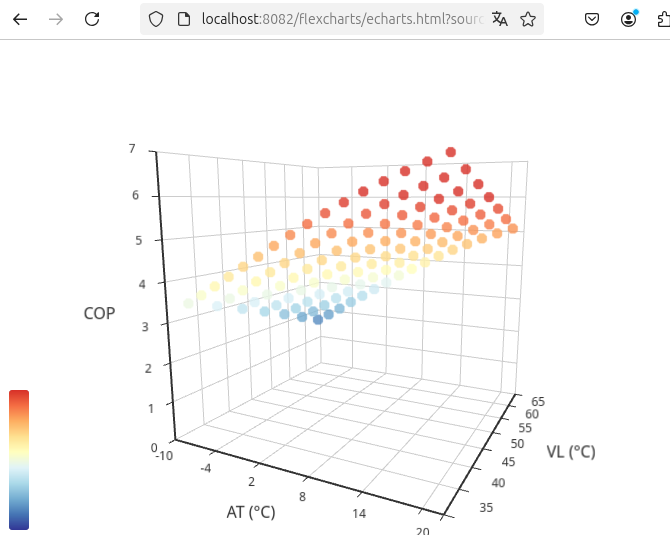
Ich scheitere derzeit an diesem Chart für ein CoP Netz der Wärmepumpe. Auf der Apache echarts Webseite funktioniert die Darstellung (bis auf Details und aktuellen Betriebspunkt) wie gewollt
In der Vis bleibt nur die Farbskala und der Rest ist weg
Der Datensatz dazu
Klar kann man das auch z.B. als Liniendiagramm darstellen, das klappt auch in Vis-2 ...aber das 3D scatter gefällt mir besser.
Eingebunden in der Vis über ein HTML widget mit Inhalt:http://192.168.178.9:8082/flexcharts/echarts.html?source=state&id=0_userdata.0.0000_Visualisierung.Heizung.copnetzHast Du eine Idee warum das in Vis-2 (vis nicht getestet) nicht angezeigt wird?
Danke vorab -
@ullij Hab eine Spur. Schaut man sich den "full code" im Beispiel von Apache ECharts an, steht da ein "import 'echarts-gl';". Das wird von flexcharts nicht importiert.
Muss ich mir näher anschauen.@jrbwh
top, danke soweit schon mal.
Ich hatte das Chart auch mal als HTML von Apache echarts runter geladen und da blieb sie lokal im Browser weiss.
Im Html code waren dann verschiedene scripte auskommentiert. Eine davon bezieht sich auf "echarts-gl". Wenn ich das aktiviere wird das Chart im Browser angezeigtProxmox auf iNuc, lxc für IoB, InfluxDB2, Grafana, u.a. *** Homematic & Homematic IP, Shellies, Zigbee etc
-
@jrbwh
top, danke soweit schon mal.
Ich hatte das Chart auch mal als HTML von Apache echarts runter geladen und da blieb sie lokal im Browser weiss.
Im Html code waren dann verschiedene scripte auskommentiert. Eine davon bezieht sich auf "echarts-gl". Wenn ich das aktiviere wird das Chart im Browser angezeigt -
@jrbwh sagte in Test Adapter flexcharts - Stapeldiagramme und mehr:
Werde das am WE oder nächste Woche einbauen und ein Release machen.
Super, danke und gute Reise
Proxmox auf iNuc, lxc für IoB, InfluxDB2, Grafana, u.a. *** Homematic & Homematic IP, Shellies, Zigbee etc
-
@sms Ja, das meine ich. Schau mal hier (https://www.youtube.com/@haus_automation), da gibt es eine hervorragende Tutorial-Reihe zum ioBroker.
@jrbwh Denke ich habe es hinbekommen:
könnte das richtig sein?
Daten eingefügt und alles wo weekly stand in daily bzw. hourly abgeänderthier habe ich einen Unterschied:
Frage zu Punkt 2 deine Anleitung:
welches soll ich nehmen?
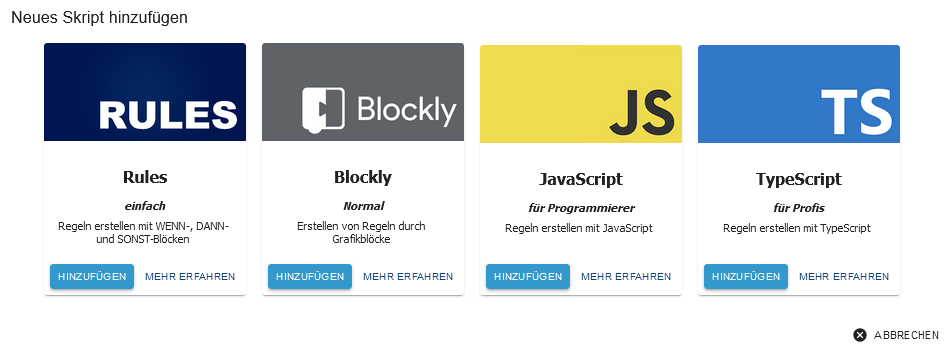
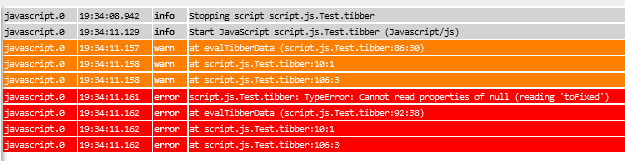
nehme ich JS und füge alles ein (ich habe jetzt mal das Skript für daily und hourly geändert und drüber eingefügt// // Create chart for Tibber hourly data to be used with flexcharts // const ID_TIBBER_HOURLY = '0_userdata.0.flexcharts.tibberLink.tibberHourly'; // State id containing tibber data (json format) const ID_CHART_HOURLY = '0_userdata.0.flexcharts.tibberLink.charthourly'; // State id containing template for chart data (json format) const TITLE_HOURLY = 'Tibber hourly'; // Title of chart evalTibberData(ID_TIBBER_HOURLY, ID_CHART_HOURLY, TITLE_HOURLY); // Convert data on start of script on({id: ID_TIBBER_HOURLY, change: "any"}, function (obj) { evalTibberData(ID_TIBBER_HOURLY, ID_CHART_HOURLY, TITLE_HOURLY); }); function evalTibberData(idTibber, idChart, title) { const tibber = JSON.parse(getState(idTibber).val); // Read tibber data const chart = JSON.parse(getState(idChart).val); // Read chart template const xAxis = []; const yAxis0 = []; const yAxis1 = []; for (const data of Object.values(tibber)) { xAxis.push(new Date(data.from).toLocaleDateString()); yAxis0.push(data.consumption.toFixed(2)); yAxis1.push(data.cost.toFixed(2)); } chart.title.text = title; // Set chart title chart.xAxis[0].data = xAxis; // Set chart x-axis data chart.series[0].data = yAxis0; // Set chart y-values consumption chart.series[1].data = yAxis1; // Set chart y-values cost setState(idChart, JSON.stringify(chart), true); // Write changed chart data to state console.log('Evaluation of tibber hourly data done. Title: '+title); } // // // // Create chart for Tibber daily data to be used with flexcharts // const ID_TIBBER_DAILY = '0_userdata.0.flexcharts.tibberLink.tibberDaily'; // State id containing tibber data (json format) const ID_CHART_DAILY = '0_userdata.0.flexcharts.tibberLink.chartDaily'; // State id containing template for chart data (json format) const TITLE_DAILY = 'Tibber daily'; // Title of chart evalTibberData(ID_TIBBER_DAILY, ID_CHART_DAILY, TITLE_DAILY); // Convert data on start of script on({id: ID_TIBBER_DAILY, change: "any"}, function (obj) { evalTibberData(ID_TIBBER_DAILY, ID_CHART_DAILY, TITLE_DAILY); }); function evalTibberData(idTibber, idChart, title) { const tibber = JSON.parse(getState(idTibber).val); // Read tibber data const chart = JSON.parse(getState(idChart).val); // Read chart template const xAxis = []; const yAxis0 = []; const yAxis1 = []; for (const data of Object.values(tibber)) { xAxis.push(new Date(data.from).toLocaleDateString()); yAxis0.push(data.consumption.toFixed(2)); yAxis1.push(data.cost.toFixed(2)); } chart.title.text = title; // Set chart title chart.xAxis[0].data = xAxis; // Set chart x-axis data chart.series[0].data = yAxis0; // Set chart y-values consumption chart.series[1].data = yAxis1; // Set chart y-values cost setState(idChart, JSON.stringify(chart), true); // Write changed chart data to state console.log('Evaluation of tibber daily data done. Title: '+title); } // // // // Create chart for Tibber weekly data to be used with flexcharts // const ID_TIBBER_WEEKLY = '0_userdata.0.flexcharts.tibberLink.tibberWeekly'; // State id containing tibber data (json format) const ID_CHART_WEEKLY = '0_userdata.0.flexcharts.tibberLink.chartWeekly'; // State id containing template for chart data (json format) const TITLE_WEEKLY = 'Tibber weekly'; // Title of chart evalTibberData(ID_TIBBER_WEEKLY, ID_CHART_WEEKLY, TITLE_WEEKLY); // Convert data on start of script on({id: ID_TIBBER_WEEKLY, change: "any"}, function (obj) { evalTibberData(ID_TIBBER_WEEKLY, ID_CHART_WEEKLY, TITLE_WEEKLY); }); function evalTibberData(idTibber, idChart, title) { const tibber = JSON.parse(getState(idTibber).val); // Read tibber data const chart = JSON.parse(getState(idChart).val); // Read chart template const xAxis = []; const yAxis0 = []; const yAxis1 = []; for (const data of Object.values(tibber)) { xAxis.push(new Date(data.from).toLocaleDateString()); yAxis0.push(data.consumption.toFixed(2)); yAxis1.push(data.cost.toFixed(2)); } chart.title.text = title; // Set chart title chart.xAxis[0].data = xAxis; // Set chart x-axis data chart.series[0].data = yAxis0; // Set chart y-values consumption chart.series[1].data = yAxis1; // Set chart y-values cost setState(idChart, JSON.stringify(chart), true); // Write changed chart data to state console.log('Evaluation of tibber weekly data done. Title: '+title); }und starte das Skript kommen folgende Meldungen:
nehme ich blockly bleibt das Feld leer!
Die Seite aktualisiert sich leider auch nicht wenn das json geändert wird.
-
@jrbwh Denke ich habe es hinbekommen:
könnte das richtig sein?
Daten eingefügt und alles wo weekly stand in daily bzw. hourly abgeänderthier habe ich einen Unterschied:
Frage zu Punkt 2 deine Anleitung:
welches soll ich nehmen?
nehme ich JS und füge alles ein (ich habe jetzt mal das Skript für daily und hourly geändert und drüber eingefügt// // Create chart for Tibber hourly data to be used with flexcharts // const ID_TIBBER_HOURLY = '0_userdata.0.flexcharts.tibberLink.tibberHourly'; // State id containing tibber data (json format) const ID_CHART_HOURLY = '0_userdata.0.flexcharts.tibberLink.charthourly'; // State id containing template for chart data (json format) const TITLE_HOURLY = 'Tibber hourly'; // Title of chart evalTibberData(ID_TIBBER_HOURLY, ID_CHART_HOURLY, TITLE_HOURLY); // Convert data on start of script on({id: ID_TIBBER_HOURLY, change: "any"}, function (obj) { evalTibberData(ID_TIBBER_HOURLY, ID_CHART_HOURLY, TITLE_HOURLY); }); function evalTibberData(idTibber, idChart, title) { const tibber = JSON.parse(getState(idTibber).val); // Read tibber data const chart = JSON.parse(getState(idChart).val); // Read chart template const xAxis = []; const yAxis0 = []; const yAxis1 = []; for (const data of Object.values(tibber)) { xAxis.push(new Date(data.from).toLocaleDateString()); yAxis0.push(data.consumption.toFixed(2)); yAxis1.push(data.cost.toFixed(2)); } chart.title.text = title; // Set chart title chart.xAxis[0].data = xAxis; // Set chart x-axis data chart.series[0].data = yAxis0; // Set chart y-values consumption chart.series[1].data = yAxis1; // Set chart y-values cost setState(idChart, JSON.stringify(chart), true); // Write changed chart data to state console.log('Evaluation of tibber hourly data done. Title: '+title); } // // // // Create chart for Tibber daily data to be used with flexcharts // const ID_TIBBER_DAILY = '0_userdata.0.flexcharts.tibberLink.tibberDaily'; // State id containing tibber data (json format) const ID_CHART_DAILY = '0_userdata.0.flexcharts.tibberLink.chartDaily'; // State id containing template for chart data (json format) const TITLE_DAILY = 'Tibber daily'; // Title of chart evalTibberData(ID_TIBBER_DAILY, ID_CHART_DAILY, TITLE_DAILY); // Convert data on start of script on({id: ID_TIBBER_DAILY, change: "any"}, function (obj) { evalTibberData(ID_TIBBER_DAILY, ID_CHART_DAILY, TITLE_DAILY); }); function evalTibberData(idTibber, idChart, title) { const tibber = JSON.parse(getState(idTibber).val); // Read tibber data const chart = JSON.parse(getState(idChart).val); // Read chart template const xAxis = []; const yAxis0 = []; const yAxis1 = []; for (const data of Object.values(tibber)) { xAxis.push(new Date(data.from).toLocaleDateString()); yAxis0.push(data.consumption.toFixed(2)); yAxis1.push(data.cost.toFixed(2)); } chart.title.text = title; // Set chart title chart.xAxis[0].data = xAxis; // Set chart x-axis data chart.series[0].data = yAxis0; // Set chart y-values consumption chart.series[1].data = yAxis1; // Set chart y-values cost setState(idChart, JSON.stringify(chart), true); // Write changed chart data to state console.log('Evaluation of tibber daily data done. Title: '+title); } // // // // Create chart for Tibber weekly data to be used with flexcharts // const ID_TIBBER_WEEKLY = '0_userdata.0.flexcharts.tibberLink.tibberWeekly'; // State id containing tibber data (json format) const ID_CHART_WEEKLY = '0_userdata.0.flexcharts.tibberLink.chartWeekly'; // State id containing template for chart data (json format) const TITLE_WEEKLY = 'Tibber weekly'; // Title of chart evalTibberData(ID_TIBBER_WEEKLY, ID_CHART_WEEKLY, TITLE_WEEKLY); // Convert data on start of script on({id: ID_TIBBER_WEEKLY, change: "any"}, function (obj) { evalTibberData(ID_TIBBER_WEEKLY, ID_CHART_WEEKLY, TITLE_WEEKLY); }); function evalTibberData(idTibber, idChart, title) { const tibber = JSON.parse(getState(idTibber).val); // Read tibber data const chart = JSON.parse(getState(idChart).val); // Read chart template const xAxis = []; const yAxis0 = []; const yAxis1 = []; for (const data of Object.values(tibber)) { xAxis.push(new Date(data.from).toLocaleDateString()); yAxis0.push(data.consumption.toFixed(2)); yAxis1.push(data.cost.toFixed(2)); } chart.title.text = title; // Set chart title chart.xAxis[0].data = xAxis; // Set chart x-axis data chart.series[0].data = yAxis0; // Set chart y-values consumption chart.series[1].data = yAxis1; // Set chart y-values cost setState(idChart, JSON.stringify(chart), true); // Write changed chart data to state console.log('Evaluation of tibber weekly data done. Title: '+title); }und starte das Skript kommen folgende Meldungen:
nehme ich blockly bleibt das Feld leer!
Die Seite aktualisiert sich leider auch nicht wenn das json geändert wird.
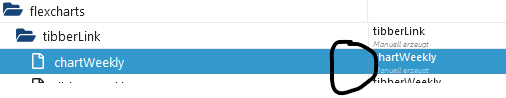
@sms Ja, JS ist richtig. Aber Du hast die Funktion evalTibberData() jetzt zweimal definiert. Das ist falsch. Jede Funktion darf nur einmal definiert werden. Durch die Übergabe der Parameter arbeitet die Funktion ja jeweils mit den gewünschten Daten. Bei charthourly hast Du einen Schreibfehler drin. Das H muss groß geschrieben sein!
Alle Datenpunkte müssen das Format "JSON" haben. -
@sms Ja, JS ist richtig. Aber Du hast die Funktion evalTibberData() jetzt zweimal definiert. Das ist falsch. Jede Funktion darf nur einmal definiert werden. Durch die Übergabe der Parameter arbeitet die Funktion ja jeweils mit den gewünschten Daten. Bei charthourly hast Du einen Schreibfehler drin. Das H muss groß geschrieben sein!
Alle Datenpunkte müssen das Format "JSON" haben.@jrbwh Einen Schreibfehler habe ich gefunden. Aber irgendwas passt immer noch nicht:
//
// Create chart for Tibber hourly data to be used with flexcharts
//

const ID_TIBBER_HOURLY = '0_userdata.0.flexcharts.tibberLink.tibberHourly';    // State id containing tibber data (json format)
const ID_CHART_HOURLY  = '0_userdata.0.flexcharts.tibberLink.chartHourly';     // State id containing template for chart data (json format)
const TITLE_HOURLY     = 'Tibber hourly';                                                             // Title of chart

evalTibberData(ID_TIBBER_HOURLY, ID_CHART_HOURLY, TITLE_HOURLY);    // Convert data on start of script

on({id: ID_TIBBER_HOURLY, change: "any"}, function (obj) {
    evalTibberData(ID_TIBBER_HOURLY, ID_CHART_HOURLY, TITLE_HOURLY);
});

function evalTibberData(idTibber, idChart, title) {
    const tibber = JSON.parse(getState(idTibber).val);  // Read tibber data
    const chart = JSON.parse(getState(idChart).val);    // Read chart template
    const xAxis  = [];
    const yAxis0 = [];
    const yAxis1 = [];
    for (const data of Object.values(tibber)) {
        xAxis.push(new Date(data.from).toLocaleDateString());
        yAxis0.push(data.consumption.toFixed(2));
        yAxis1.push(data.cost.toFixed(2));
    }
    chart.title.text = title;           // Set chart title
    chart.xAxis[0].data  = xAxis;       // Set chart x-axis data
    chart.series[0].data = yAxis0;      // Set chart y-values consumption
    chart.series[1].data = yAxis1;      // Set chart y-values cost
    setState(idChart, JSON.stringify(chart), true); // Write changed chart data to state
    console.log('Evaluation of tibber hourly data done. Title: '+title);
}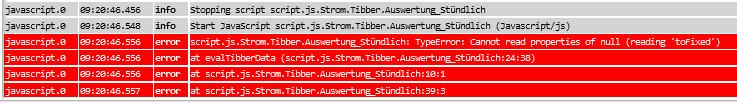
Geändert habe ich weekly oder WEEKLY auf hourly oder HOURLY, also eigentlich genauso geschrieben (Groß- und Kleinbuchstaben). Da finde ich jetzt keinen Fehler mehr. Komischerweise hat es bei daily funktioniert. Außer das ich noch nicht weiß ob die Seite aktualisiert wird, da es heute morgen nicht geklappt hat.
Jede Abfrage hat jetzt ein eigenes Skript.

Kann es was mit der Uhrzeit zu tun haben?
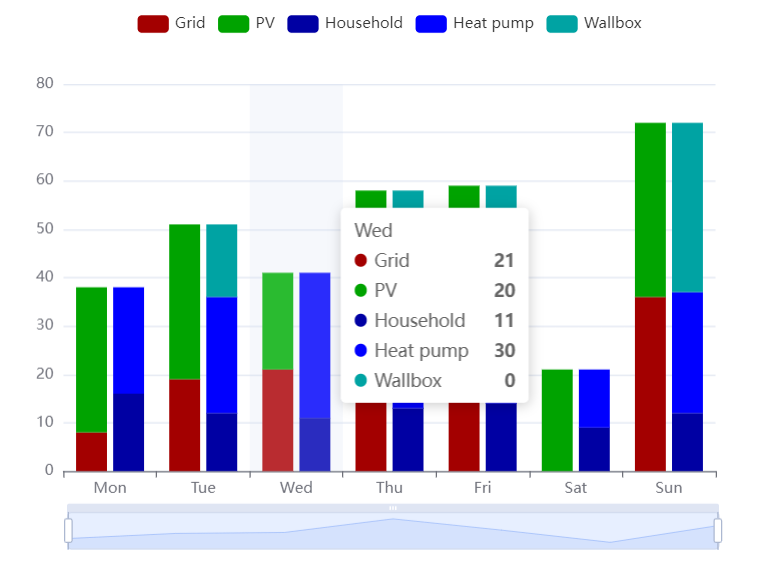
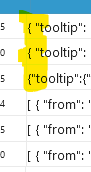
In chartHourly steht:{ "tooltip": { "trigger": "axis", "axisPointer": { "type": "cross" } }, "legend": { "show": true, "orient": "horizontal", "left": "center", "top": 25 }, "title": { "left": "center", "text": "Tibber hourly" }, "grid": { "right": "20%" }, "toolbox": { "feature": { "dataView": { "show": true, "readOnly": false }, "restore": { "show": true }, "saveAsImage": { "show": true } } }, "xAxis": [ { "type": "category", "axisTick": { "alignWithLabel": true }, "data": [ "14:00", "15:00", "16:00" ] } ], "yAxis": [ { "type": "value", "position": "left", "alignTicks": true, "axisLine": { "show": true, "lineStyle": { "color": "#5470C6" } }, "axisLabel": { "formatter": "{value} kWh" } }, { "type": "value", "position": "right", "alignTicks": true, "axisLine": { "show": true, "lineStyle": { "color": "#91CC75" } }, "axisLabel": { "formatter": "{value} €" } } ], "series": [ { "name": "Consumption", "type": "bar", "data": [ "0.081", "0.096", "0.086" ] }, { "name": "Cost", "type": "bar", "yAxisIndex": 1, "data": [ "0.03", "0.03", "0.03" ] } ] }Wobei ich die Uhrzeiten selbst eingetragen habe.
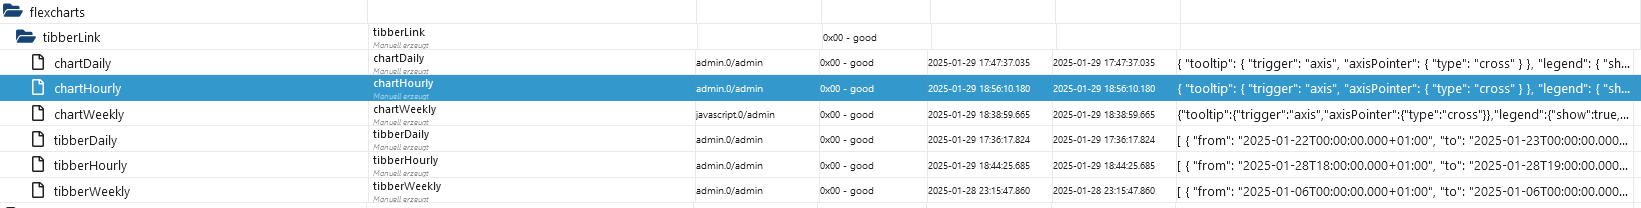
In tibberHourly steht:[ { "from": "2025-01-29T09:00:00.000+01:00", "to": "2025-01-29T10:00:00.000+01:00", "cost": 0.029134056, "unitPrice": 0.3641757, "unitPriceVAT": 0.0581457, "consumption": 0.08, "consumptionUnit": "kWh", "totalCost": 0.02616991475, "unitCost": 0.029134056, "currency": "EUR" }, { "from": "2025-01-29T10:00:00.000+01:00", "to": "2025-01-29T11:00:00.000+01:00", "cost": 0.0497585053, "unitPrice": 0.3339497, "unitPriceVAT": 0.0533197, "consumption": 0.149, "consumptionUnit": "kWh", "totalCost": 0.04679436405, "unitCost": 0.0497585053, "currency": "EUR" }, { "from": "2025-01-29T11:00:00.000+01:00", "to": "2025-01-29T12:00:00.000+01:00", "cost": 0.0412843487, "unitPrice": 0.3151477, "unitPriceVAT": 0.0503177, "consumption": 0.131, "consumptionUnit": "kWh", "totalCost": 0.03832020745, "unitCost": 0.0412843487, "currency": "EUR" }, { "from": "2025-01-29T12:00:00.000+01:00", "to": "2025-01-29T13:00:00.000+01:00", "cost": 0.021706314, "unitPrice": 0.3100902, "unitPriceVAT": 0.0495102, "consumption": 0.07, "consumptionUnit": "kWh", "totalCost": 0.01874217275, "unitCost": 0.021706314, "currency": "EUR" }, { "from": "2025-01-29T13:00:00.000+01:00", "to": "2025-01-29T14:00:00.000+01:00", "cost": 0.0307613691, "unitPrice": 0.3107209, "unitPriceVAT": 0.0496109, "consumption": 0.099, "consumptionUnit": "kWh", "totalCost": 0.02779722785, "unitCost": 0.0307613691, "currency": "EUR" }, { "from": "2025-01-29T14:00:00.000+01:00", "to": "2025-01-29T15:00:00.000+01:00", "cost": 0.0253746675, "unitPrice": 0.3132675, "unitPriceVAT": 0.0500175, "consumption": 0.081, "consumptionUnit": "kWh", "totalCost": 0.02241052625, "unitCost": 0.0253746675, "currency": "EUR" }, { "from": "2025-01-29T15:00:00.000+01:00", "to": "2025-01-29T16:00:00.000+01:00", "cost": 0.0317964192, "unitPrice": 0.3312127, "unitPriceVAT": 0.0528827, "consumption": 0.096, "consumptionUnit": "kWh", "totalCost": 0.02883227795, "unitCost": 0.0317964192, "currency": "EUR" }, { "from": "2025-01-29T16:00:00.000+01:00", "to": "2025-01-29T17:00:00.000+01:00", "cost": 0.0315452816, "unitPrice": 0.3668056, "unitPriceVAT": 0.0585656, "consumption": 0.086, "consumptionUnit": "kWh", "totalCost": 0.02858114035, "unitCost": 0.0315452816, "currency": "EUR" }, { "from": "2025-01-29T17:00:00.000+01:00", "to": "2025-01-29T18:00:00.000+01:00", "cost": 0.0228287815, "unitPrice": 0.3869285, "unitPriceVAT": 0.0617785, "consumption": 0.059, "consumptionUnit": "kWh", "totalCost": 0.01986464025, "unitCost": 0.0228287815, "currency": "EUR" }, { "from": "2025-01-29T18:00:00.000+01:00", "to": "2025-01-29T19:00:00.000+01:00", "cost": 0.0112388717, "unitPrice": 0.3875473, "unitPriceVAT": 0.0618773, "consumption": 0.029, "consumptionUnit": "kWh", "totalCost": 0.00827473045, "unitCost": 0.0112388717, "currency": "EUR" }, { "from": "2025-01-29T19:00:00.000+01:00", "to": "2025-01-29T20:00:00.000+01:00", "cost": 0.007660744, "unitPrice": 0.3830372, "unitPriceVAT": 0.0611572, "consumption": 0.02, "consumptionUnit": "kWh", "totalCost": 0.00469660275, "unitCost": 0.007660744, "currency": "EUR" }, { "from": "2025-01-29T20:00:00.000+01:00", "to": "2025-01-29T21:00:00.000+01:00", "cost": 0.0065872926, "unitPrice": 0.3659607, "unitPriceVAT": 0.0584307, "consumption": 0.018, "consumptionUnit": "kWh", "totalCost": 0.00362315135, "unitCost": 0.0065872926, "currency": "EUR" }, { "from": "2025-01-29T21:00:00.000+01:00", "to": "2025-01-29T22:00:00.000+01:00", "cost": 0.0063238266, "unitPrice": 0.3513237, "unitPriceVAT": 0.0560937, "consumption": 0.018, "consumptionUnit": "kWh", "totalCost": 0.00335968535, "unitCost": 0.0063238266, "currency": "EUR" }, { "from": "2025-01-29T22:00:00.000+01:00", "to": "2025-01-29T23:00:00.000+01:00", "cost": 0.0065019577, "unitPrice": 0.3422083, "unitPriceVAT": 0.0546383, "consumption": 0.019, "consumptionUnit": "kWh", "totalCost": 0.00353781645, "unitCost": 0.0065019577, "currency": "EUR" }, { "from": "2025-01-29T23:00:00.000+01:00", "to": "2025-01-30T00:00:00.000+01:00", "cost": 1.1309330053, "unitPrice": 0.3271429, "unitPriceVAT": 0.0522329, "consumption": 3.457, "consumptionUnit": "kWh", "totalCost": 1.12796886405, "unitCost": 1.1309330053, "currency": "EUR" }, { "from": "2025-01-30T00:00:00.000+01:00", "to": "2025-01-30T01:00:00.000+01:00", "cost": 0.1119367431, "unitPrice": 0.3189081, "unitPriceVAT": 0.0509181, "consumption": 0.351, "consumptionUnit": "kWh", "totalCost": 0.10897260185, "unitCost": 0.1119367431, "currency": "EUR" }, { "from": "2025-01-30T01:00:00.000+01:00", "to": "2025-01-30T02:00:00.000+01:00", "cost": 0.1058853908, "unitPrice": 0.3189319, "unitPriceVAT": 0.0509219, "consumption": 0.332, "consumptionUnit": "kWh", "totalCost": 0.10292124955, "unitCost": 0.1058853908, "currency": "EUR" }, { "from": "2025-01-30T02:00:00.000+01:00", "to": "2025-01-30T03:00:00.000+01:00", "cost": 0.0892808091, "unitPrice": 0.3200029, "unitPriceVAT": 0.0510929, "consumption": 0.279, "consumptionUnit": "kWh", "totalCost": 0.08631666785, "unitCost": 0.0892808091, "currency": "EUR" }, { "from": "2025-01-30T03:00:00.000+01:00", "to": "2025-01-30T04:00:00.000+01:00", "cost": 0.089474196, "unitPrice": 0.3195507, "unitPriceVAT": 0.0510207, "consumption": 0.28, "consumptionUnit": "kWh", "totalCost": 0.08651005475, "unitCost": 0.089474196, "currency": "EUR" }, { "from": "2025-01-30T04:00:00.000+01:00", "to": "2025-01-30T05:00:00.000+01:00", "cost": 0.1077989822, "unitPrice": 0.3189319, "unitPriceVAT": 0.0509219, "consumption": 0.338, "consumptionUnit": "kWh", "totalCost": 0.10483484095, "unitCost": 0.1077989822, "currency": "EUR" }, { "from": "2025-01-30T05:00:00.000+01:00", "to": "2025-01-30T06:00:00.000+01:00", "cost": 0.1200729635, "unitPrice": 0.3382337, "unitPriceVAT": 0.0540037, "consumption": 0.355, "consumptionUnit": "kWh", "totalCost": 0.11710882225, "unitCost": 0.1200729635, "currency": "EUR" }, { "from": "2025-01-30T06:00:00.000+01:00", "to": "2025-01-30T07:00:00.000+01:00", "cost": 0.0240216256, "unitPrice": 0.3753379, "unitPriceVAT": 0.0599279, "consumption": 0.064, "consumptionUnit": "kWh", "totalCost": 0.02105748435, "unitCost": 0.0240216256, "currency": "EUR" }, { "from": "2025-01-30T07:00:00.000+01:00", "to": "2025-01-30T08:00:00.000+01:00", "cost": 0.0121080358, "unitPrice": 0.3905818, "unitPriceVAT": 0.0623618, "consumption": 0.031, "consumptionUnit": "kWh", "totalCost": 0.00914389455, "unitCost": 0.0121080358, "currency": "EUR" }, { "from": "2025-01-30T08:00:00.000+01:00", "to": "2025-01-30T09:00:00.000+01:00", "cost": null, "unitPrice": 0.3996972, "unitPriceVAT": 0.0638172, "consumption": null, "consumptionUnit": "kWh", "totalCost": null, "unitCost": null, "currency": "EUR" } ]Bez. wenn ich auf den Stift gehe unter Objektdaten bei chartHourly:
{
  "common": {
    "name": "chartHourly",
    "desc": "Manuell erzeugt",
    "role": "state",
    "type": "json",
    "read": true,
    "write": true
  },
  "type": "state",
  "native": {},
  "from": "system.adapter.admin.0",
  "user": "system.user.admin",
  "ts": 1738172595401,
  "_id": "0_userdata.0.flexcharts.tibberLink.chartHourly",
  "acl": {
    "object": 1638,
    "state": 1638,
    "owner": "system.user.admin",
    "ownerGroup": "system.group.administrator"
  }
}
und bei tibberHourly:
{ "common": { "name": "tibberHourly", "desc": "Manuell erzeugt", "role": "state", "type": "json", "read": true, "write": true }, "type": "state", "native": {}, "from": "system.adapter.admin.0", "user": "system.user.admin", "ts": 1738172636549, "_id": "0_userdata.0.flexcharts.tibberLink.tibberHourly", "acl": { "object": 1638, "state": 1638, "owner": "system.user.admin", "ownerGroup": "system.group.administrator" } } -
@jrbwh Einen Schreibfehler habe ich gefunden. Aber irgendwas passt immer noch nicht:
//
// Create chart for Tibber hourly data to be used with flexcharts
//

const ID_TIBBER_HOURLY = '0_userdata.0.flexcharts.tibberLink.tibberHourly';    // State id containing tibber data (json format)
const ID_CHART_HOURLY  = '0_userdata.0.flexcharts.tibberLink.chartHourly';     // State id containing template for chart data (json format)
const TITLE_HOURLY     = 'Tibber hourly';                                                             // Title of chart

evalTibberData(ID_TIBBER_HOURLY, ID_CHART_HOURLY, TITLE_HOURLY);    // Convert data on start of script

on({id: ID_TIBBER_HOURLY, change: "any"}, function (obj) {
    evalTibberData(ID_TIBBER_HOURLY, ID_CHART_HOURLY, TITLE_HOURLY);
});

function evalTibberData(idTibber, idChart, title) {
    const tibber = JSON.parse(getState(idTibber).val);  // Read tibber data
    const chart = JSON.parse(getState(idChart).val);    // Read chart template
    const xAxis  = [];
    const yAxis0 = [];
    const yAxis1 = [];
    for (const data of Object.values(tibber)) {
        xAxis.push(new Date(data.from).toLocaleDateString());
        yAxis0.push(data.consumption.toFixed(2));
        yAxis1.push(data.cost.toFixed(2));
    }
    chart.title.text = title;           // Set chart title
    chart.xAxis[0].data  = xAxis;       // Set chart x-axis data
    chart.series[0].data = yAxis0;      // Set chart y-values consumption
    chart.series[1].data = yAxis1;      // Set chart y-values cost
    setState(idChart, JSON.stringify(chart), true); // Write changed chart data to state
    console.log('Evaluation of tibber hourly data done. Title: '+title);
}
Geändert habe ich weekly oder WEEKLY auf hourly oder HOURLY, also eigentlich genauso geschrieben (Groß- und Kleinbuchstaben). Da finde ich jetzt keinen Fehler mehr. Komischerweise hat es bei daily funktioniert. Außer das ich noch nicht weiß ob die Seite aktualisiert wird, da es heute morgen nicht geklappt hat.
Jede Abfrage hat jetzt ein eigenes Skript.
Kann es was mit der Uhrzeit zu tun haben?
In chartHourly steht:{ "tooltip": { "trigger": "axis", "axisPointer": { "type": "cross" } }, "legend": { "show": true, "orient": "horizontal", "left": "center", "top": 25 }, "title": { "left": "center", "text": "Tibber hourly" }, "grid": { "right": "20%" }, "toolbox": { "feature": { "dataView": { "show": true, "readOnly": false }, "restore": { "show": true }, "saveAsImage": { "show": true } } }, "xAxis": [ { "type": "category", "axisTick": { "alignWithLabel": true }, "data": [ "14:00", "15:00", "16:00" ] } ], "yAxis": [ { "type": "value", "position": "left", "alignTicks": true, "axisLine": { "show": true, "lineStyle": { "color": "#5470C6" } }, "axisLabel": { "formatter": "{value} kWh" } }, { "type": "value", "position": "right", "alignTicks": true, "axisLine": { "show": true, "lineStyle": { "color": "#91CC75" } }, "axisLabel": { "formatter": "{value} €" } } ], "series": [ { "name": "Consumption", "type": "bar", "data": [ "0.081", "0.096", "0.086" ] }, { "name": "Cost", "type": "bar", "yAxisIndex": 1, "data": [ "0.03", "0.03", "0.03" ] } ] }Wobei ich die Uhrzeiten selbst eingetragen habe.
In tibberHourly steht:[ { "from": "2025-01-29T09:00:00.000+01:00", "to": "2025-01-29T10:00:00.000+01:00", "cost": 0.029134056, "unitPrice": 0.3641757, "unitPriceVAT": 0.0581457, "consumption": 0.08, "consumptionUnit": "kWh", "totalCost": 0.02616991475, "unitCost": 0.029134056, "currency": "EUR" }, { "from": "2025-01-29T10:00:00.000+01:00", "to": "2025-01-29T11:00:00.000+01:00", "cost": 0.0497585053, "unitPrice": 0.3339497, "unitPriceVAT": 0.0533197, "consumption": 0.149, "consumptionUnit": "kWh", "totalCost": 0.04679436405, "unitCost": 0.0497585053, "currency": "EUR" }, { "from": "2025-01-29T11:00:00.000+01:00", "to": "2025-01-29T12:00:00.000+01:00", "cost": 0.0412843487, "unitPrice": 0.3151477, "unitPriceVAT": 0.0503177, "consumption": 0.131, "consumptionUnit": "kWh", "totalCost": 0.03832020745, "unitCost": 0.0412843487, "currency": "EUR" }, { "from": "2025-01-29T12:00:00.000+01:00", "to": "2025-01-29T13:00:00.000+01:00", "cost": 0.021706314, "unitPrice": 0.3100902, "unitPriceVAT": 0.0495102, "consumption": 0.07, "consumptionUnit": "kWh", "totalCost": 0.01874217275, "unitCost": 0.021706314, "currency": "EUR" }, { "from": "2025-01-29T13:00:00.000+01:00", "to": "2025-01-29T14:00:00.000+01:00", "cost": 0.0307613691, "unitPrice": 0.3107209, "unitPriceVAT": 0.0496109, "consumption": 0.099, "consumptionUnit": "kWh", "totalCost": 0.02779722785, "unitCost": 0.0307613691, "currency": "EUR" }, { "from": "2025-01-29T14:00:00.000+01:00", "to": "2025-01-29T15:00:00.000+01:00", "cost": 0.0253746675, "unitPrice": 0.3132675, "unitPriceVAT": 0.0500175, "consumption": 0.081, "consumptionUnit": "kWh", "totalCost": 0.02241052625, "unitCost": 0.0253746675, "currency": "EUR" }, { "from": "2025-01-29T15:00:00.000+01:00", "to": "2025-01-29T16:00:00.000+01:00", "cost": 0.0317964192, "unitPrice": 0.3312127, "unitPriceVAT": 0.0528827, "consumption": 0.096, "consumptionUnit": "kWh", "totalCost": 0.02883227795, "unitCost": 0.0317964192, "currency": "EUR" }, { "from": "2025-01-29T16:00:00.000+01:00", "to": "2025-01-29T17:00:00.000+01:00", "cost": 0.0315452816, "unitPrice": 0.3668056, "unitPriceVAT": 0.0585656, "consumption": 0.086, "consumptionUnit": "kWh", "totalCost": 0.02858114035, "unitCost": 0.0315452816, "currency": "EUR" }, { "from": "2025-01-29T17:00:00.000+01:00", "to": "2025-01-29T18:00:00.000+01:00", "cost": 0.0228287815, "unitPrice": 0.3869285, "unitPriceVAT": 0.0617785, "consumption": 0.059, "consumptionUnit": "kWh", "totalCost": 0.01986464025, "unitCost": 0.0228287815, "currency": "EUR" }, { "from": "2025-01-29T18:00:00.000+01:00", "to": "2025-01-29T19:00:00.000+01:00", "cost": 0.0112388717, "unitPrice": 0.3875473, "unitPriceVAT": 0.0618773, "consumption": 0.029, "consumptionUnit": "kWh", "totalCost": 0.00827473045, "unitCost": 0.0112388717, "currency": "EUR" }, { "from": "2025-01-29T19:00:00.000+01:00", "to": "2025-01-29T20:00:00.000+01:00", "cost": 0.007660744, "unitPrice": 0.3830372, "unitPriceVAT": 0.0611572, "consumption": 0.02, "consumptionUnit": "kWh", "totalCost": 0.00469660275, "unitCost": 0.007660744, "currency": "EUR" }, { "from": "2025-01-29T20:00:00.000+01:00", "to": "2025-01-29T21:00:00.000+01:00", "cost": 0.0065872926, "unitPrice": 0.3659607, "unitPriceVAT": 0.0584307, "consumption": 0.018, "consumptionUnit": "kWh", "totalCost": 0.00362315135, "unitCost": 0.0065872926, "currency": "EUR" }, { "from": "2025-01-29T21:00:00.000+01:00", "to": "2025-01-29T22:00:00.000+01:00", "cost": 0.0063238266, "unitPrice": 0.3513237, "unitPriceVAT": 0.0560937, "consumption": 0.018, "consumptionUnit": "kWh", "totalCost": 0.00335968535, "unitCost": 0.0063238266, "currency": "EUR" }, { "from": "2025-01-29T22:00:00.000+01:00", "to": "2025-01-29T23:00:00.000+01:00", "cost": 0.0065019577, "unitPrice": 0.3422083, "unitPriceVAT": 0.0546383, "consumption": 0.019, "consumptionUnit": "kWh", "totalCost": 0.00353781645, "unitCost": 0.0065019577, "currency": "EUR" }, { "from": "2025-01-29T23:00:00.000+01:00", "to": "2025-01-30T00:00:00.000+01:00", "cost": 1.1309330053, "unitPrice": 0.3271429, "unitPriceVAT": 0.0522329, "consumption": 3.457, "consumptionUnit": "kWh", "totalCost": 1.12796886405, "unitCost": 1.1309330053, "currency": "EUR" }, { "from": "2025-01-30T00:00:00.000+01:00", "to": "2025-01-30T01:00:00.000+01:00", "cost": 0.1119367431, "unitPrice": 0.3189081, "unitPriceVAT": 0.0509181, "consumption": 0.351, "consumptionUnit": "kWh", "totalCost": 0.10897260185, "unitCost": 0.1119367431, "currency": "EUR" }, { "from": "2025-01-30T01:00:00.000+01:00", "to": "2025-01-30T02:00:00.000+01:00", "cost": 0.1058853908, "unitPrice": 0.3189319, "unitPriceVAT": 0.0509219, "consumption": 0.332, "consumptionUnit": "kWh", "totalCost": 0.10292124955, "unitCost": 0.1058853908, "currency": "EUR" }, { "from": "2025-01-30T02:00:00.000+01:00", "to": "2025-01-30T03:00:00.000+01:00", "cost": 0.0892808091, "unitPrice": 0.3200029, "unitPriceVAT": 0.0510929, "consumption": 0.279, "consumptionUnit": "kWh", "totalCost": 0.08631666785, "unitCost": 0.0892808091, "currency": "EUR" }, { "from": "2025-01-30T03:00:00.000+01:00", "to": "2025-01-30T04:00:00.000+01:00", "cost": 0.089474196, "unitPrice": 0.3195507, "unitPriceVAT": 0.0510207, "consumption": 0.28, "consumptionUnit": "kWh", "totalCost": 0.08651005475, "unitCost": 0.089474196, "currency": "EUR" }, { "from": "2025-01-30T04:00:00.000+01:00", "to": "2025-01-30T05:00:00.000+01:00", "cost": 0.1077989822, "unitPrice": 0.3189319, "unitPriceVAT": 0.0509219, "consumption": 0.338, "consumptionUnit": "kWh", "totalCost": 0.10483484095, "unitCost": 0.1077989822, "currency": "EUR" }, { "from": "2025-01-30T05:00:00.000+01:00", "to": "2025-01-30T06:00:00.000+01:00", "cost": 0.1200729635, "unitPrice": 0.3382337, "unitPriceVAT": 0.0540037, "consumption": 0.355, "consumptionUnit": "kWh", "totalCost": 0.11710882225, "unitCost": 0.1200729635, "currency": "EUR" }, { "from": "2025-01-30T06:00:00.000+01:00", "to": "2025-01-30T07:00:00.000+01:00", "cost": 0.0240216256, "unitPrice": 0.3753379, "unitPriceVAT": 0.0599279, "consumption": 0.064, "consumptionUnit": "kWh", "totalCost": 0.02105748435, "unitCost": 0.0240216256, "currency": "EUR" }, { "from": "2025-01-30T07:00:00.000+01:00", "to": "2025-01-30T08:00:00.000+01:00", "cost": 0.0121080358, "unitPrice": 0.3905818, "unitPriceVAT": 0.0623618, "consumption": 0.031, "consumptionUnit": "kWh", "totalCost": 0.00914389455, "unitCost": 0.0121080358, "currency": "EUR" }, { "from": "2025-01-30T08:00:00.000+01:00", "to": "2025-01-30T09:00:00.000+01:00", "cost": null, "unitPrice": 0.3996972, "unitPriceVAT": 0.0638172, "consumption": null, "consumptionUnit": "kWh", "totalCost": null, "unitCost": null, "currency": "EUR" } ]Bez. wenn ich auf den Stift gehe unter Objektdaten bei chartHourly:
{
  "common": {
    "name": "chartHourly",
    "desc": "Manuell erzeugt",
    "role": "state",
    "type": "json",
    "read": true,
    "write": true
  },
  "type": "state",
  "native": {},
  "from": "system.adapter.admin.0",
  "user": "system.user.admin",
  "ts": 1738172595401,
  "_id": "0_userdata.0.flexcharts.tibberLink.chartHourly",
  "acl": {
    "object": 1638,
    "state": 1638,
    "owner": "system.user.admin",
    "ownerGroup": "system.group.administrator"
  }
}
und bei tibberHourly:
{ "common": { "name": "tibberHourly", "desc": "Manuell erzeugt", "role": "state", "type": "json", "read": true, "write": true }, "type": "state", "native": {}, "from": "system.adapter.admin.0", "user": "system.user.admin", "ts": 1738172636549, "_id": "0_userdata.0.flexcharts.tibberLink.tibberHourly", "acl": { "object": 1638, "state": 1638, "owner": "system.user.admin", "ownerGroup": "system.group.administrator" } }@sms Die Fehlermeldung kommt, weil Deine Daten keine gültigen Zahlenwerte, sondern
nullenthalten. Außerdem sollte bei stündlichen Werten an der x-Achse die Uhrzeit und nicht das Datum stehen.Ich habe das Skript entsprechend erweitert.
nullWerte werden jetzt als 0 gespeichert.Wenn du die Funktion
evalTibberData()in Deinem Skript durch die geänderte Version ersetzt, sollte es funktionieren. -
@jrbwh sagte in Test Adapter flexcharts - Stapeldiagramme und mehr:
Werde das am WE oder nächste Woche einbauen und ein Release machen.
Super, danke und gute Reise
@ullij Ich habe eine Version im Branch develop erstellt, kann im Moment aber nur eingeschränkt testen. Bei mir sieht's gut aus. Falls Du es ausprobieren möchtest:
Im Expertenmodus im Adapter-Installationsdialog unter "Custom" folgende Adresse verwenden:
https://github.com/MyHomeMyData/ioBroker.flexcharts/tree/develop -
@sms Die Fehlermeldung kommt, weil Deine Daten keine gültigen Zahlenwerte, sondern
nullenthalten. Außerdem sollte bei stündlichen Werten an der x-Achse die Uhrzeit und nicht das Datum stehen.Ich habe das Skript entsprechend erweitert.
nullWerte werden jetzt als 0 gespeichert.Wenn du die Funktion
evalTibberData()in Deinem Skript durch die geänderte Version ersetzt, sollte es funktionieren.@jrbwh Muss ich in dem Skript noch irgendwas anpassen? Irgendeine ID?
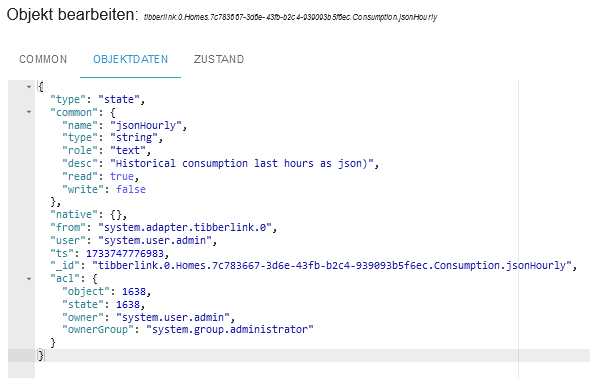
Leider hat es jetzt nach der letzten Stunde nicht funktioniert. Der Zeitstempel vom DP tibberlink ändert bzw. aktualisiert sich, aber beim DP flexchart ändert sich nichts.Hier Zeitstempel tibberlink nach Neustart des Adapters:

Und hier von den angelegten DP's:
-
@ullij Ich habe eine Version im Branch develop erstellt, kann im Moment aber nur eingeschränkt testen. Bei mir sieht's gut aus. Falls Du es ausprobieren möchtest:
Im Expertenmodus im Adapter-Installationsdialog unter "Custom" folgende Adresse verwenden:
https://github.com/MyHomeMyData/ioBroker.flexcharts/tree/develop@jrbwh sagte in Test Adapter flexcharts - Stapeldiagramme und mehr:
Bei mir sieht's gut aus
bei mir noch nicht
 Habe irgendwo eine Fehlermeldung vom web-Adapter gesehen, bin noch am suchen
Proxmox auf iNuc, lxc für IoB, InfluxDB2, Grafana, u.a. *** Homematic & Homematic IP, Shellies, Zigbee etc
-
@jrbwh Muss ich in dem Skript noch irgendwas anpassen? Irgendeine ID?
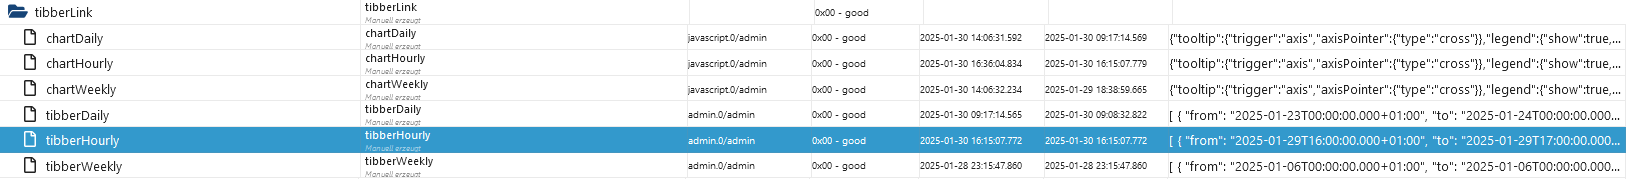
Leider hat es jetzt nach der letzten Stunde nicht funktioniert. Der Zeitstempel vom DP tibberlink ändert bzw. aktualisiert sich, aber beim DP flexchart ändert sich nichts.Hier Zeitstempel tibberlink nach Neustart des Adapters:
Und hier von den angelegten DP's:
-
@jrbwh sagte in Test Adapter flexcharts - Stapeldiagramme und mehr:
Bei mir sieht's gut aus
bei mir noch nicht
Habe irgendwo eine Fehlermeldung vom web-Adapter gesehen, bin noch am suchen -
@sms Wenn die IDs der Datenpunkte im Skript stimmen, sollte es funktionieren. Im Log siehst Du ja, ob das Skript läuft, wenn Du den DP änderst.
@jrbwh Dann würde ich sagen funktioniert es nicht! Das hier steht im Skript:
//
// Create chart for Tibber hourly data to be used with flexcharts
//

const ID_TIBBER_HOURLY = '0_userdata.0.flexcharts.tibberLink.tibberHourly';       // State id containing tibber data (json format)
const ID_CHART_HOURLY  = '0_userdata.0.flexcharts.tibberLink.chartHourly';        // State id containing template for chart data (json format)
const TITLE_HOURLY     = 'Tibber hourly';

evalTibberData(ID_TIBBER_HOURLY, ID_CHART_HOURLY, TITLE_HOURLY);    // Convert data on start of script

on({id: ID_TIBBER_HOURLY, change: "any"}, function (obj) {
    evalTibberData(ID_TIBBER_HOURLY, ID_CHART_HOURLY, TITLE_HOURLY);
});

function evalTibberData(idTibber, idChart, title) {
    const tibber = JSON.parse(getState(idTibber).val);  // Read tibber data
    const chart = JSON.parse(getState(idChart).val);    // Read chart template
    const xAxis  = [];
    const yAxis0 = [];
    const yAxis1 = [];
    for (const data of Object.values(tibber)) {
        const isHourly = (new Date(data.from).getHours() != new Date(data.to).getHours());  // Hourly data?
        const xValue = (isHourly ? new Date(data.from).toLocaleTimeString() : new Date(data.from).toLocaleDateString());
        xAxis.push(xValue);
        yAxis0.push((data.consumption ? data.consumption.toFixed(2) : 0));  // push 0 on null values
        yAxis1.push((data.cost ? data.cost.toFixed(2) : 0));                // push 0 on null values
    }
    chart.title.text = title;           // Set chart title
    chart.xAxis[0].data  = xAxis;       // Set chart x-axis data
    chart.series[0].data = yAxis0;      // Set chart y-values consumption
    chart.series[1].data = yAxis1;      // Set chart y-values cost
    setState(idChart, JSON.stringify(chart), true); // Write changed chart data to state
    console.log('Evaluation of tibber hourly data done. Title: '+title);
}
Das hier ist die ID vom tibberHourly:
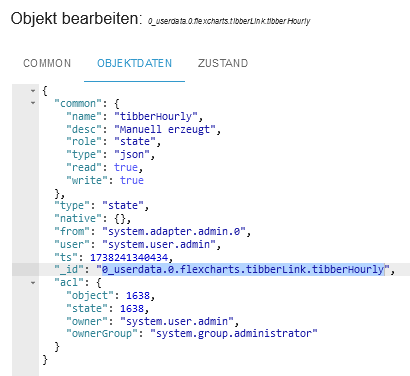
Und hier vom chartHourly:
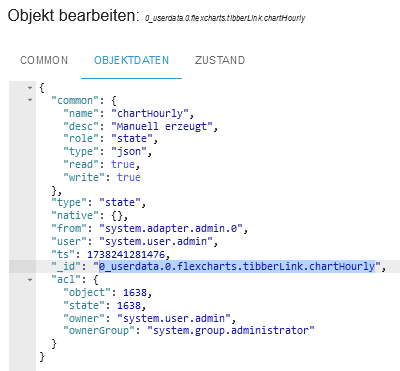
Muss noch irgendwo die ID von tibberlink rein?
-
@jrbwh Dann würde ich sagen funktioniert es nicht! Das hier steht im Skript:
//
// Create chart for Tibber hourly data to be used with flexcharts
//

const ID_TIBBER_HOURLY = '0_userdata.0.flexcharts.tibberLink.tibberHourly';       // State id containing tibber data (json format)
const ID_CHART_HOURLY  = '0_userdata.0.flexcharts.tibberLink.chartHourly';        // State id containing template for chart data (json format)
const TITLE_HOURLY     = 'Tibber hourly';

evalTibberData(ID_TIBBER_HOURLY, ID_CHART_HOURLY, TITLE_HOURLY);    // Convert data on start of script

on({id: ID_TIBBER_HOURLY, change: "any"}, function (obj) {
    evalTibberData(ID_TIBBER_HOURLY, ID_CHART_HOURLY, TITLE_HOURLY);
});

function evalTibberData(idTibber, idChart, title) {
    const tibber = JSON.parse(getState(idTibber).val);  // Read tibber data
    const chart = JSON.parse(getState(idChart).val);    // Read chart template
    const xAxis  = [];
    const yAxis0 = [];
    const yAxis1 = [];
    for (const data of Object.values(tibber)) {
        const isHourly = (new Date(data.from).getHours() != new Date(data.to).getHours());  // Hourly data?
        const xValue = (isHourly ? new Date(data.from).toLocaleTimeString() : new Date(data.from).toLocaleDateString());
        xAxis.push(xValue);
        yAxis0.push((data.consumption ? data.consumption.toFixed(2) : 0));  // push 0 on null values
        yAxis1.push((data.cost ? data.cost.toFixed(2) : 0));                // push 0 on null values
    }
    chart.title.text = title;           // Set chart title
    chart.xAxis[0].data  = xAxis;       // Set chart x-axis data
    chart.series[0].data = yAxis0;      // Set chart y-values consumption
    chart.series[1].data = yAxis1;      // Set chart y-values cost
    setState(idChart, JSON.stringify(chart), true); // Write changed chart data to state
    console.log('Evaluation of tibber hourly data done. Title: '+title);
}
Das hier ist die ID vom tibberHourly:
Und hier vom chartHourly:
Muss noch irgendwo die ID von tibberlink rein?
-
Aller Anfang ist schwer. Am Ende hilft jedoch nur, sich selbst in die Materie einzuarbeiten. Meine Leidens- und vor allem Erfolgsgeschichten kannst du hier in Teilen nachlesen. Dort findest du viele Ideen und Techniken, wie du dein Vorhaben weitestgehend selbst in die Tat umsetzen kannst.
Nicht erschrecken! Aber ohne sich durch derartige Gedanken hindurch zu kämpfen, wirst du mit FlexCharts nicht glücklich. Aber sei versichert: Es lohnt sich.
-
@ullij Ich habe eine Version im Branch develop erstellt, kann im Moment aber nur eingeschränkt testen. Bei mir sieht's gut aus. Falls Du es ausprobieren möchtest:
Im Expertenmodus im Adapter-Installationsdialog unter "Custom" folgende Adresse verwenden:
https://github.com/MyHomeMyData/ioBroker.flexcharts/tree/develop@jrbwh sagte in Test Adapter flexcharts - Stapeldiagramme und mehr:
Ich habe eine Version im Branch develop erstellt, kann im Moment aber nur eingeschränkt testen. Bei mir sieht's gut aus. Falls Du es ausprobieren möchtest:
nach Neuinstallation sieht das so aus
Proxmox auf iNuc, lxc für IoB, InfluxDB2, Grafana, u.a. *** Homematic & Homematic IP, Shellies, Zigbee etc
Hey! Du scheinst an dieser Unterhaltung interessiert zu sein, hast aber noch kein Konto.
Hast du es satt, bei jedem Besuch durch die gleichen Beiträge zu scrollen? Wenn du dich für ein Konto anmeldest, kommst du immer genau dorthin zurück, wo du zuvor warst, und kannst dich über neue Antworten benachrichtigen lassen (entweder per E-Mail oder Push-Benachrichtigung). Du kannst auch Lesezeichen speichern und Beiträge positiv bewerten, um anderen Community-Mitgliedern deine Wertschätzung zu zeigen.
Mit deinem Input könnte dieser Beitrag noch besser werden 💗
Registrieren AnmeldenSupport us
216
Online33.0k
Benutzer83.4k
Themen1.3m
Beiträge