

eCharts Bar-Diagram Error in Chrome - ERR_BLOCKED_BY_CLIENT
-
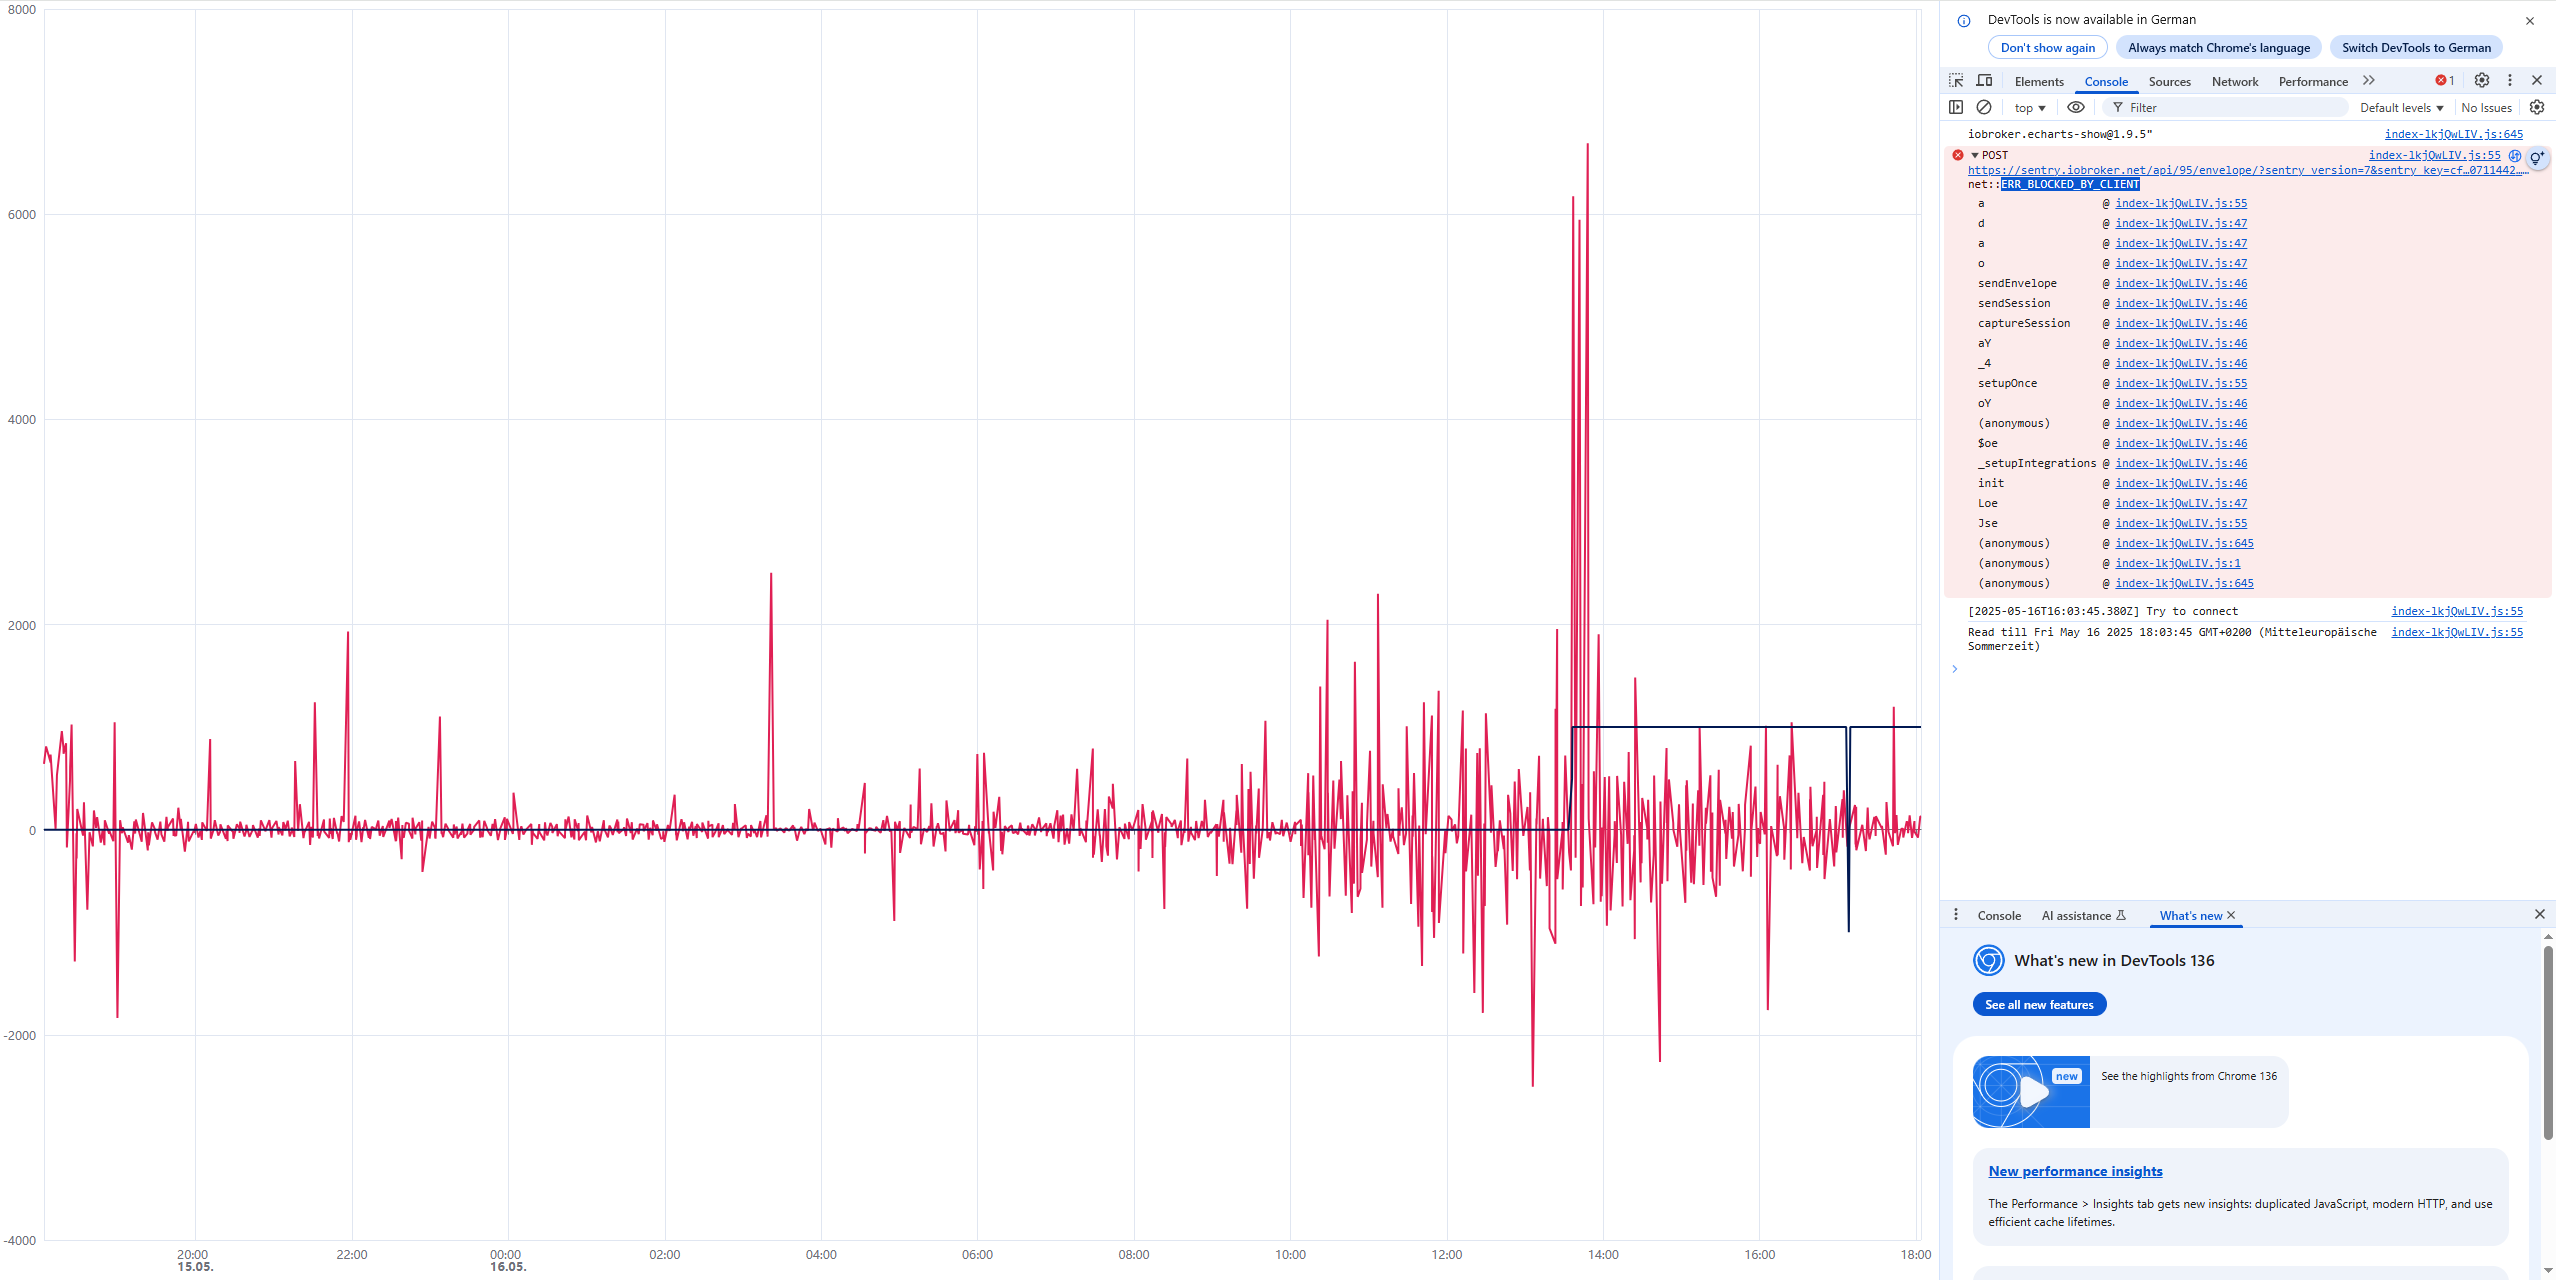
eCharts mit Bar-Diagram zeigt im Google Chrome Browser (weder am PC noch unter Android) nichts an, im Firefox funktioniert es.
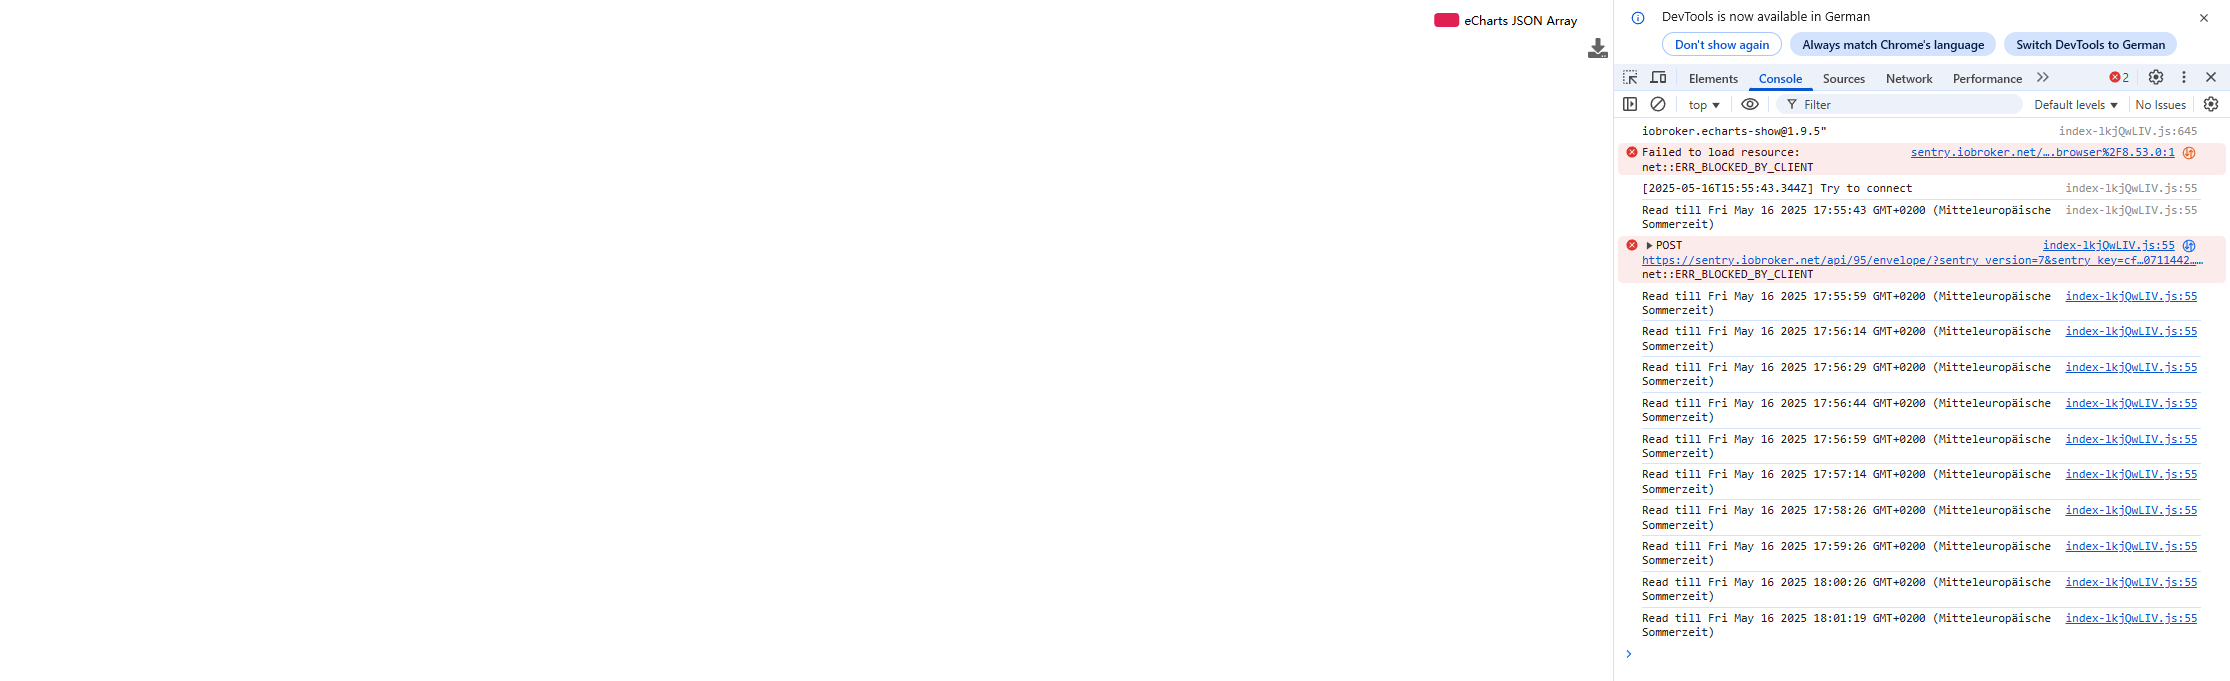
In der Developer Console wird der Fehler ERR_BLOCKED_BY_CLIENT ausgegeben.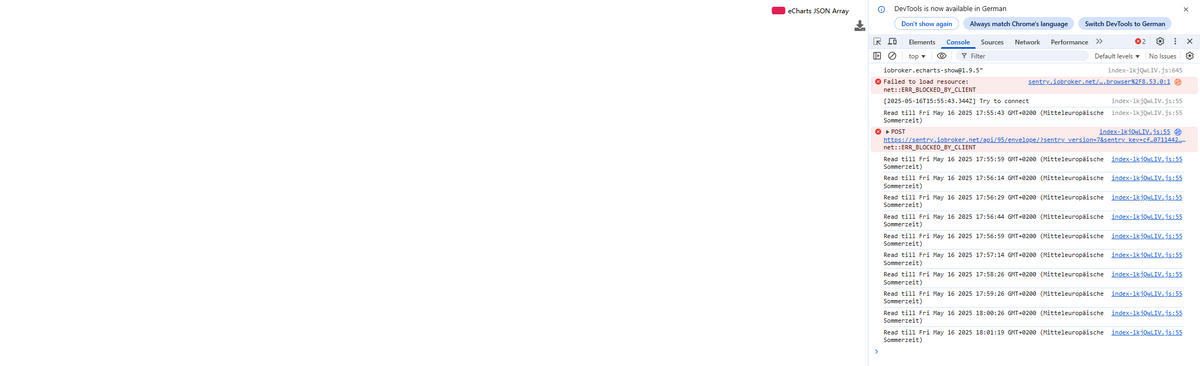
Wenn statt dem Barchart der Chart Typ Linie ausgewählt wird, dann wird auch in Chrome alles angezeigt, der Fehler ERR_BLOCKED_BY_CLIENT wird aber genauso ausgegeben.

Woran könnte das liegen?
Ein Bug für welchen ein Github Issue eröffnet werden sollte?- Adapter: eCharts 2.0.6
- https://github.com/ioBroker/ioBroker.echarts
- js-controller Version: 7.0.6
- Admin Version: 7.6.7
- Docker Container (v10.0.0-build.20250514.234447) in Proxmox LXC hinter Traefik Reverse-Proxy
- Arbeitsspeicher: 6 GB
- Festplattenart: SSD
Output von iob diag:
Script v.2025-02-23 *** BASE SYSTEM *** Hardware Vendor : netcup Kernel : x86_64 Userland : 64 bit Docker : v10.0.0 Virtualization : docker Kernel : x86_64 Userland : 64 bit Systemuptime and Load: 17:57:36 up 34 days, 3:03, 0 user, load average: 0.29, 0.40, 0.50 CPU threads: 8 *** LIFE CYCLE STATUS *** Unknown release codenamed ''. Please check yourself if the Operating System is actively maintained. *** TIME AND TIMEZONES *** Fri May 16 15:57:36 UTC 2025 Fri May 16 17:57:36 CEST 2025 CEST +0200 Etc/UTC *** Users and Groups *** User that called 'iob diag': root HOME=/root GROUPS=root User that is running 'js-controller': iobroker HOME=/opt/iobroker GROUPS=iobroker tty dialout audio video plugdev *** DISPLAY-SERVER SETUP *** Display-Server: false Desktop: Terminal: *** MEMORY *** total used free shared buff/cache available Mem: 16G 7.6G 3.3G 329M 6.6G 9.2G Swap: 8.6G 1.9G 6.7G Total: 25G 9.5G 9G Active iob-Instances: 10 15948 M total memory 7221 M used memory 8357 M active memory 2547 M inactive memory 3143 M free memory 1195 M buffer memory 5146 M swap cache 8191 M total swap 1844 M used swap 6347 M free swap *** top - Table Of Processes *** top - 17:57:37 up 34 days, 3:03, 0 user, load average: 0.29, 0.40, 0.50 Tasks: 17 total, 1 running, 16 sleeping, 0 stopped, 0 zombie %Cpu(s): 0.0 us, 0.0 sy, 0.0 ni,100.0 id, 0.0 wa, 0.0 hi, 0.0 si, 0.0 st MiB Mem : 15948.9 total, 3143.4 free, 7221.3 used, 6341.9 buff/cache MiB Swap: 8192.0 total, 6347.4 free, 1844.6 used. 8727.6 avail Mem *** DMESG CRITICAL ERRORS *** dmesg: read kernel buffer failed: Operation not permitted No critical errors detected *** FILESYSTEM *** Filesystem Type Size Used Avail Use% Mounted on overlay overlay 94G 52G 38G 59% / tmpfs tmpfs 64M 0 64M 0% /dev shm tmpfs 64M 0 64M 0% /dev/shm /dev/mapper/pve-vm--103--disk--0 ext4 94G 52G 38G 59% /opt/iobroker tmpfs tmpfs 7.8G 0 7.8G 0% /proc/acpi tmpfs tmpfs 7.8G 0 7.8G 0% /proc/scsi tmpfs tmpfs 7.8G 0 7.8G 0% /sys/firmware Messages concerning ext4 filesystem in dmesg: dmesg: read kernel buffer failed: Operation not permitted Show mounted filesystems: TARGET SOURCE FSTYPE OPTIONS /opt/iobroker /dev/mapper/pve-vm--103--disk--0[/opt/docker/_external/x.x.x/iob/opt/iobroker] ext4 rw,relatime,stripe=16 /etc/resolv.conf /dev/mapper/pve-vm--103--disk--0[/var/lib/docker/containers/b8fb6e06cb1a158b916b201de8cd6bf44dd50955eb095fd9820040825bce90f7/resolv.conf] ext4 rw,relatime,stripe=16 /etc/hostname /dev/mapper/pve-vm--103--disk--0[/var/lib/docker/containers/b8fb6e06cb1a158b916b201de8cd6bf44dd50955eb095fd9820040825bce90f7/hostname] ext4 rw,relatime,stripe=16 /etc/hosts /dev/mapper/pve-vm--103--disk--0[/var/lib/docker/containers/b8fb6e06cb1a158b916b201de8cd6bf44dd50955eb095fd9820040825bce90f7/hosts] ext4 rw,relatime,stripe=16 Files in neuralgic directories: /var: 16M /var/ 14M /var/lib/dpkg 14M /var/lib 13M /var/lib/dpkg/info 1.9M /var/cache /opt/iobroker/backups: 99M /opt/iobroker/backups/ /opt/iobroker/iobroker-data: 1.1G /opt/iobroker/iobroker-data/ 906M /opt/iobroker/iobroker-data/files 617M /opt/iobroker/iobroker-data/files/javascript.admin 560M /opt/iobroker/iobroker-data/files/javascript.admin/static 558M /opt/iobroker/iobroker-data/files/javascript.admin/static/js The five largest files in iobroker-data are: 24M /opt/iobroker/iobroker-data/objects.jsonl 24M /opt/iobroker/iobroker-data/files/vis-2/static/js/main.f305bc29.js.map 24M /opt/iobroker/iobroker-data/files/vis-2/static/js/main.8e80ccb0.js.map 24M /opt/iobroker/iobroker-data/files/vis-2/customWidgets.js.map 13M /opt/iobroker/iobroker-data/files/vis-2/static/js/531.d13ad27d.chunk.js.map USB-Devices by-id: USB-Sticks - Avoid direct links to /dev/tty* in your adapter setups, please always prefer the links 'by-id': No Devices found 'by-id' Zigbee Network Settings on your coordinator/in nvbackup are: zigbee.X Extended Pan ID: *** MASKED *** Pan ID: *** MASKED *** Channel: *** MASKED *** Network Key: *** MASKED *** To unmask the settings run 'iob diag --unmask' *** NodeJS-Installation *** /usr/bin/nodejs v20.19.2 /usr/bin/node v20.19.2 /usr/bin/npm 10.8.2 /usr/bin/npx 10.8.2 /usr/bin/corepack 0.31.0 nodejs: Installed: 20.19.2-1nodesource1 Candidate: 20.19.2-1nodesource1 Version table: *** 20.19.2-1nodesource1 100 100 /var/lib/dpkg/status Temp directories causing deletion problem: 0 No problems detected Errors in npm tree: 0 No problems detected *** ioBroker-Installation *** ioBroker Status iobroker is running on this host. Objects type: jsonl States type: jsonl Hosts: xxx xxx (version: 7.0.6, hostname: xxx, alive, uptime: 466) Core adapters versions js-controller: 7.0.6 admin: 7.6.7 javascript: 8.8.3 nodejs modules from github: 0 Adapter State + system.adapter.admin.0 : admin : xxx - enabled, port: 8081, bind: 0.0.0.0, run as: admin system.adapter.apg-info.0 : apg-info : xxx - enabled + system.adapter.backitup.0 : backitup : xxx - enabled + system.adapter.echarts.0 : echarts : xxx - enabled + system.adapter.influxdb.0 : influxdb : xxx - enabled, port: 8086 + system.adapter.javascript.0 : javascript : xxx - enabled + system.adapter.mqtt-client.0 : mqtt-client : xxx - enabled, port: 1883 + system.adapter.pvforecast.0 : pvforecast : xxx - enabled system.adapter.vis-2-widgets-material.0 : vis-2-widgets-material: xxx - enabled + system.adapter.vis-2.0 : vis-2 : xxx - enabled system.adapter.vis-materialdesign.0 : vis-materialdesign : xxx - disabled system.adapter.vis.0 : vis : xxx - enabled system.adapter.weatherunderground.0 : weatherunderground : xxx - enabled + system.adapter.web.0 : web : xxx - enabled, port: 8082, bind: 0.0.0.0, run as: admin + instance is alive Enabled adapters with bindings + system.adapter.admin.0 : admin : xxx - enabled, port: 8081, bind: 0.0.0.0, run as: admin + system.adapter.influxdb.0 : influxdb : xxx - enabled, port: 8086 + system.adapter.mqtt-client.0 : mqtt-client : xxx - enabled, port: 1883 + system.adapter.web.0 : web : xxx - enabled, port: 8082, bind: 0.0.0.0, run as: admin ioBroker-Repositories ┌─────────┬──────────┬─────────────────────────────────────────────────────────┬──────────────┐ │ (index) │ name │ url │ auto upgrade │ ├─────────┼──────────┼─────────────────────────────────────────────────────────┼──────────────┤ │ 0 │ 'stable' │ 'http://download.iobroker.net/sources-dist.json' │ false │ │ 1 │ 'beta' │ 'http://download.iobroker.net/sources-dist-latest.json' │ false │ └─────────┴──────────┴─────────────────────────────────────────────────────────┴──────────────┘ Active repo(s): stable Upgrade policy: none Installed ioBroker-Adapters Used repository: stable Adapter "admin" : 7.6.3 , installed 7.6.7 Adapter "apg-info" : 0.1.15 , installed 0.1.15 Adapter "backitup" : 3.0.31 , installed 2.5.11 [Updatable] Adapter "echarts" : 1.9.2 , installed 2.0.6 Adapter "influxdb" : 4.0.2 , installed 4.0.2 Adapter "javascript" : 8.8.3 , installed 8.8.3 Controller "js-controller": 7.0.6 , installed 7.0.6 Adapter "mqtt-client" : 3.0.0 , installed 1.6.3 [Updatable] Adapter "pvforecast" : 4.1.0 , installed 4.1.0 Adapter "socketio" : 6.7.1 , installed 7.0.8 Adapter "vis" : 1.5.6 , installed 1.5.6 Adapter "vis-2" : 2.9.64 , installed 2.9.64 Adapter "vis-2-widgets-material": 1.4.10, installed 1.4.10 Adapter "vis-materialdesign": 0.5.9, installed 0.5.9 Adapter "weatherunderground": 3.7.0, installed 3.7.0 Adapter "web" : 7.0.8 , installed 7.0.9 Adapter "ws" : 2.6.2 , installed 3.0.19 Objects and States Please stand by - This may take a while Objects: 2436 States: 2188 *** OS-Repositories and Updates *** Hit:1 http://deb.debian.org/debian bookworm InRelease Hit:2 http://deb.debian.org/debian bookworm-updates InRelease Hit:3 http://deb.debian.org/debian-security bookworm-security InRelease Hit:4 https://deb.nodesource.com/node_20.x nodistro InRelease Reading package lists... Pending Updates: 0 *** Listening Ports *** Active Internet connections (only servers) Proto Recv-Q Send-Q Local Address Foreign Address State User Inode PID/Program name tcp 0 0 127.0.0.1:9001 0.0.0.0:* LISTEN 1000 223055340 - tcp 0 0 127.0.0.1:9000 0.0.0.0:* LISTEN 1000 223053424 - tcp 0 0 127.0.0.11:37017 0.0.0.0:* LISTEN 0 223049380 - tcp6 0 0 :::8082 :::* LISTEN 1000 223065116 - tcp6 0 0 :::8081 :::* LISTEN 1000 223058084 - udp 0 0 127.0.0.11:60593 0.0.0.0:* 0 223049379 - *** Log File - Last 25 Lines *** 2025-05-16 17:50:31.904 - error: web.0 (356) socket.io [use] unknown user 2025-05-16 17:50:31.904 - error: web.0 (356) socket.io [use] unknown user 2025-05-16 17:50:32.723 - info: host.xxx instance system.adapter.vis-2.0 in version "2.9.64" started with pid 386 2025-05-16 17:50:33.521 - info: vis-2.0 (386) starting. Version 2.9.64 in /opt/iobroker/node_modules/iobroker.vis-2, node: v20.19.2, js-controller: 7.0.6 2025-05-16 17:50:33.650 - info: vis-2.0 (386) vis-2 license is OK. 2025-05-16 17:50:50.202 - info: javascript.0 (227) script.js.common.apg-json-chart: [eCharts] apg-info.0.marketprice.today.jsonChart → 0_userdata.0.visualization.echartsToday: 25 Punkte geschrieben 2025-05-16 17:50:50.236 - warn: javascript.0 (227) Read-only state "0_userdata.0.visualization.echartsToday" has been written without ack-flag with value "[{"ts":1747346400000,"val":9.301},{"ts":1747350000000,"val":9.06},{"ts":1747353600000,"val":8.813},{"ts":1747357200000,"val":8.707},{"ts":1747360800000,"val":9.094},{"ts":1747364400000,"val":9.705},{"ts":1747368000000,"val":10.911},{"ts":1747371600000,"val":11.456},{"ts":1747375200000,"val":10.331},{"ts":1747378800000,"val":7.759},{"ts":1747382400000,"val":3.647},{"ts":1747386000000,"val":0.75},{"ts":1747389600000,"val":0},{"ts":1747393200000,"val":-0.801},{"ts":1747396800000,"val":-0.343},{"ts":1747400400000,"val":2.207},{"ts":1747404000000,"val":1.65},{"ts":1747407600000,"val":7.738},{"ts":1747411200000,"val":10.495},{"ts":1747414800000,"val":12.422},{"ts":1747418400000,"val":13.791},{"ts":1747422000000,"val":13.205},{"ts":1747425600000,"val":11.692},{"ts":1747429200000,"val":10.177},{"ts":1747432800000,"val":10.177}]" 2025-05-16 17:50:50.244 - info: javascript.0 (227) script.js.common.apg-json-chart: [eCharts] apg-info.0.marketprice.tomorrow.jsonChart → 0_userdata.0.visualization.echartsTomorrow: 25 Punkte geschrieben 2025-05-16 17:50:50.245 - warn: javascript.0 (227) Read-only state "0_userdata.0.visualization.echartsTomorrow" has been written without ack-flag with value "[{"ts":1747432800000,"val":9.463},{"ts":1747436400000,"val":9.462},{"ts":1747440000000,"val":8.958},{"ts":1747443600000,"val":9.005},{"ts":1747447200000,"val":9.144},{"ts":1747450800000,"val":9.654},{"ts":1747454400000,"val":9.304},{"ts":1747458000000,"val":9.062},{"ts":1747461600000,"val":6.097},{"ts":1747465200000,"val":0.078},{"ts":1747468800000,"val":-0.008},{"ts":1747472400000,"val":-0.595},{"ts":1747476000000,"val":-0.462},{"ts":1747479600000,"val":-1.045},{"ts":1747483200000,"val":-1.175},{"ts":1747486800000,"val":-0.587},{"ts":1747490400000,"val":-0.79},{"ts":1747494000000,"val":-0.99},{"ts":1747497600000,"val":6.628},{"ts":1747501200000,"val":9.996},{"ts":1747504800000,"val":10.896},{"ts":1747508400000,"val":11.999},{"ts":1747512000000,"val":11.006},{"ts":1747515600000,"val":10.696},{"ts":1747519200000,"val":10.696}]" 2025-05-16 17:50:50.660 - info: apg-info.0 (371) Terminated (NO_ERROR): Without reason 2025-05-16 17:50:51.167 - info: apg-info.0 (371) cleaned everything up... 2025-05-16 17:50:51.191 - info: host.xxx instance system.adapter.apg-info.0 terminated with code 0 (NO_ERROR) 2025-05-16 17:54:00.220 - info: admin.0 (163) ==> Connected system.user.admin from ::ffff:192.168.72.8 2025-05-16 17:54:05.583 - info: admin.0 (163) ==> Connected system.user.admin from ::ffff:192.168.72.8 2025-05-16 17:54:11.426 - info: admin.0 (163) ==> Connected system.user.admin from ::ffff:192.168.72.8 2025-05-16 17:54:12.017 - info: admin.0 (163) ==> Connected system.user.admin from ::ffff:192.168.72.8 2025-05-16 17:54:26.728 - info: admin.0 (163) ==> Connected system.user.admin from ::ffff:192.168.72.8 2025-05-16 17:54:45.740 - info: admin.0 (163) ==> Connected system.user.admin from ::ffff:192.168.72.8 2025-05-16 17:54:59.216 - info: admin.0 (163) <== Disconnect system.user.admin from ::ffff:192.168.72.8 echarts-show 2025-05-16 17:54:59.730 - info: admin.0 (163) <== Disconnect system.user.admin from ::ffff:192.168.72.8 echarts-show 2025-05-16 17:55:05.435 - info: admin.0 (163) <== Disconnect system.user.admin from ::ffff:192.168.72.8 echarts-show 2025-05-16 17:55:05.501 - info: admin.0 (163) ==> Connected system.user.admin from ::ffff:192.168.72.8 2025-05-16 17:55:05.533 - info: admin.0 (163) <== Disconnect system.user.admin from ::ffff:192.168.72.8 echarts-show 2025-05-16 17:55:05.705 - info: admin.0 (163) ==> Connected system.user.admin from ::ffff:192.168.72.8 2025-05-16 17:55:11.731 - info: admin.0 (163) ==> Connected system.user.admin from ::ffff:192.168.72.8 -
eCharts mit Bar-Diagram zeigt im Google Chrome Browser (weder am PC noch unter Android) nichts an, im Firefox funktioniert es.
In der Developer Console wird der Fehler ERR_BLOCKED_BY_CLIENT ausgegeben.Wenn statt dem Barchart der Chart Typ Linie ausgewählt wird, dann wird auch in Chrome alles angezeigt, der Fehler ERR_BLOCKED_BY_CLIENT wird aber genauso ausgegeben.
Woran könnte das liegen?
Ein Bug für welchen ein Github Issue eröffnet werden sollte?- Adapter: eCharts 2.0.6
- https://github.com/ioBroker/ioBroker.echarts
- js-controller Version: 7.0.6
- Admin Version: 7.6.7
- Docker Container (v10.0.0-build.20250514.234447) in Proxmox LXC hinter Traefik Reverse-Proxy
- Arbeitsspeicher: 6 GB
- Festplattenart: SSD
Output von iob diag:
Script v.2025-02-23 *** BASE SYSTEM *** Hardware Vendor : netcup Kernel : x86_64 Userland : 64 bit Docker : v10.0.0 Virtualization : docker Kernel : x86_64 Userland : 64 bit Systemuptime and Load: 17:57:36 up 34 days, 3:03, 0 user, load average: 0.29, 0.40, 0.50 CPU threads: 8 *** LIFE CYCLE STATUS *** Unknown release codenamed ''. Please check yourself if the Operating System is actively maintained. *** TIME AND TIMEZONES *** Fri May 16 15:57:36 UTC 2025 Fri May 16 17:57:36 CEST 2025 CEST +0200 Etc/UTC *** Users and Groups *** User that called 'iob diag': root HOME=/root GROUPS=root User that is running 'js-controller': iobroker HOME=/opt/iobroker GROUPS=iobroker tty dialout audio video plugdev *** DISPLAY-SERVER SETUP *** Display-Server: false Desktop: Terminal: *** MEMORY *** total used free shared buff/cache available Mem: 16G 7.6G 3.3G 329M 6.6G 9.2G Swap: 8.6G 1.9G 6.7G Total: 25G 9.5G 9G Active iob-Instances: 10 15948 M total memory 7221 M used memory 8357 M active memory 2547 M inactive memory 3143 M free memory 1195 M buffer memory 5146 M swap cache 8191 M total swap 1844 M used swap 6347 M free swap *** top - Table Of Processes *** top - 17:57:37 up 34 days, 3:03, 0 user, load average: 0.29, 0.40, 0.50 Tasks: 17 total, 1 running, 16 sleeping, 0 stopped, 0 zombie %Cpu(s): 0.0 us, 0.0 sy, 0.0 ni,100.0 id, 0.0 wa, 0.0 hi, 0.0 si, 0.0 st MiB Mem : 15948.9 total, 3143.4 free, 7221.3 used, 6341.9 buff/cache MiB Swap: 8192.0 total, 6347.4 free, 1844.6 used. 8727.6 avail Mem *** DMESG CRITICAL ERRORS *** dmesg: read kernel buffer failed: Operation not permitted No critical errors detected *** FILESYSTEM *** Filesystem Type Size Used Avail Use% Mounted on overlay overlay 94G 52G 38G 59% / tmpfs tmpfs 64M 0 64M 0% /dev shm tmpfs 64M 0 64M 0% /dev/shm /dev/mapper/pve-vm--103--disk--0 ext4 94G 52G 38G 59% /opt/iobroker tmpfs tmpfs 7.8G 0 7.8G 0% /proc/acpi tmpfs tmpfs 7.8G 0 7.8G 0% /proc/scsi tmpfs tmpfs 7.8G 0 7.8G 0% /sys/firmware Messages concerning ext4 filesystem in dmesg: dmesg: read kernel buffer failed: Operation not permitted Show mounted filesystems: TARGET SOURCE FSTYPE OPTIONS /opt/iobroker /dev/mapper/pve-vm--103--disk--0[/opt/docker/_external/x.x.x/iob/opt/iobroker] ext4 rw,relatime,stripe=16 /etc/resolv.conf /dev/mapper/pve-vm--103--disk--0[/var/lib/docker/containers/b8fb6e06cb1a158b916b201de8cd6bf44dd50955eb095fd9820040825bce90f7/resolv.conf] ext4 rw,relatime,stripe=16 /etc/hostname /dev/mapper/pve-vm--103--disk--0[/var/lib/docker/containers/b8fb6e06cb1a158b916b201de8cd6bf44dd50955eb095fd9820040825bce90f7/hostname] ext4 rw,relatime,stripe=16 /etc/hosts /dev/mapper/pve-vm--103--disk--0[/var/lib/docker/containers/b8fb6e06cb1a158b916b201de8cd6bf44dd50955eb095fd9820040825bce90f7/hosts] ext4 rw,relatime,stripe=16 Files in neuralgic directories: /var: 16M /var/ 14M /var/lib/dpkg 14M /var/lib 13M /var/lib/dpkg/info 1.9M /var/cache /opt/iobroker/backups: 99M /opt/iobroker/backups/ /opt/iobroker/iobroker-data: 1.1G /opt/iobroker/iobroker-data/ 906M /opt/iobroker/iobroker-data/files 617M /opt/iobroker/iobroker-data/files/javascript.admin 560M /opt/iobroker/iobroker-data/files/javascript.admin/static 558M /opt/iobroker/iobroker-data/files/javascript.admin/static/js The five largest files in iobroker-data are: 24M /opt/iobroker/iobroker-data/objects.jsonl 24M /opt/iobroker/iobroker-data/files/vis-2/static/js/main.f305bc29.js.map 24M /opt/iobroker/iobroker-data/files/vis-2/static/js/main.8e80ccb0.js.map 24M /opt/iobroker/iobroker-data/files/vis-2/customWidgets.js.map 13M /opt/iobroker/iobroker-data/files/vis-2/static/js/531.d13ad27d.chunk.js.map USB-Devices by-id: USB-Sticks - Avoid direct links to /dev/tty* in your adapter setups, please always prefer the links 'by-id': No Devices found 'by-id' Zigbee Network Settings on your coordinator/in nvbackup are: zigbee.X Extended Pan ID: *** MASKED *** Pan ID: *** MASKED *** Channel: *** MASKED *** Network Key: *** MASKED *** To unmask the settings run 'iob diag --unmask' *** NodeJS-Installation *** /usr/bin/nodejs v20.19.2 /usr/bin/node v20.19.2 /usr/bin/npm 10.8.2 /usr/bin/npx 10.8.2 /usr/bin/corepack 0.31.0 nodejs: Installed: 20.19.2-1nodesource1 Candidate: 20.19.2-1nodesource1 Version table: *** 20.19.2-1nodesource1 100 100 /var/lib/dpkg/status Temp directories causing deletion problem: 0 No problems detected Errors in npm tree: 0 No problems detected *** ioBroker-Installation *** ioBroker Status iobroker is running on this host. Objects type: jsonl States type: jsonl Hosts: xxx xxx (version: 7.0.6, hostname: xxx, alive, uptime: 466) Core adapters versions js-controller: 7.0.6 admin: 7.6.7 javascript: 8.8.3 nodejs modules from github: 0 Adapter State + system.adapter.admin.0 : admin : xxx - enabled, port: 8081, bind: 0.0.0.0, run as: admin system.adapter.apg-info.0 : apg-info : xxx - enabled + system.adapter.backitup.0 : backitup : xxx - enabled + system.adapter.echarts.0 : echarts : xxx - enabled + system.adapter.influxdb.0 : influxdb : xxx - enabled, port: 8086 + system.adapter.javascript.0 : javascript : xxx - enabled + system.adapter.mqtt-client.0 : mqtt-client : xxx - enabled, port: 1883 + system.adapter.pvforecast.0 : pvforecast : xxx - enabled system.adapter.vis-2-widgets-material.0 : vis-2-widgets-material: xxx - enabled + system.adapter.vis-2.0 : vis-2 : xxx - enabled system.adapter.vis-materialdesign.0 : vis-materialdesign : xxx - disabled system.adapter.vis.0 : vis : xxx - enabled system.adapter.weatherunderground.0 : weatherunderground : xxx - enabled + system.adapter.web.0 : web : xxx - enabled, port: 8082, bind: 0.0.0.0, run as: admin + instance is alive Enabled adapters with bindings + system.adapter.admin.0 : admin : xxx - enabled, port: 8081, bind: 0.0.0.0, run as: admin + system.adapter.influxdb.0 : influxdb : xxx - enabled, port: 8086 + system.adapter.mqtt-client.0 : mqtt-client : xxx - enabled, port: 1883 + system.adapter.web.0 : web : xxx - enabled, port: 8082, bind: 0.0.0.0, run as: admin ioBroker-Repositories ┌─────────┬──────────┬─────────────────────────────────────────────────────────┬──────────────┐ │ (index) │ name │ url │ auto upgrade │ ├─────────┼──────────┼─────────────────────────────────────────────────────────┼──────────────┤ │ 0 │ 'stable' │ 'http://download.iobroker.net/sources-dist.json' │ false │ │ 1 │ 'beta' │ 'http://download.iobroker.net/sources-dist-latest.json' │ false │ └─────────┴──────────┴─────────────────────────────────────────────────────────┴──────────────┘ Active repo(s): stable Upgrade policy: none Installed ioBroker-Adapters Used repository: stable Adapter "admin" : 7.6.3 , installed 7.6.7 Adapter "apg-info" : 0.1.15 , installed 0.1.15 Adapter "backitup" : 3.0.31 , installed 2.5.11 [Updatable] Adapter "echarts" : 1.9.2 , installed 2.0.6 Adapter "influxdb" : 4.0.2 , installed 4.0.2 Adapter "javascript" : 8.8.3 , installed 8.8.3 Controller "js-controller": 7.0.6 , installed 7.0.6 Adapter "mqtt-client" : 3.0.0 , installed 1.6.3 [Updatable] Adapter "pvforecast" : 4.1.0 , installed 4.1.0 Adapter "socketio" : 6.7.1 , installed 7.0.8 Adapter "vis" : 1.5.6 , installed 1.5.6 Adapter "vis-2" : 2.9.64 , installed 2.9.64 Adapter "vis-2-widgets-material": 1.4.10, installed 1.4.10 Adapter "vis-materialdesign": 0.5.9, installed 0.5.9 Adapter "weatherunderground": 3.7.0, installed 3.7.0 Adapter "web" : 7.0.8 , installed 7.0.9 Adapter "ws" : 2.6.2 , installed 3.0.19 Objects and States Please stand by - This may take a while Objects: 2436 States: 2188 *** OS-Repositories and Updates *** Hit:1 http://deb.debian.org/debian bookworm InRelease Hit:2 http://deb.debian.org/debian bookworm-updates InRelease Hit:3 http://deb.debian.org/debian-security bookworm-security InRelease Hit:4 https://deb.nodesource.com/node_20.x nodistro InRelease Reading package lists... Pending Updates: 0 *** Listening Ports *** Active Internet connections (only servers) Proto Recv-Q Send-Q Local Address Foreign Address State User Inode PID/Program name tcp 0 0 127.0.0.1:9001 0.0.0.0:* LISTEN 1000 223055340 - tcp 0 0 127.0.0.1:9000 0.0.0.0:* LISTEN 1000 223053424 - tcp 0 0 127.0.0.11:37017 0.0.0.0:* LISTEN 0 223049380 - tcp6 0 0 :::8082 :::* LISTEN 1000 223065116 - tcp6 0 0 :::8081 :::* LISTEN 1000 223058084 - udp 0 0 127.0.0.11:60593 0.0.0.0:* 0 223049379 - *** Log File - Last 25 Lines *** 2025-05-16 17:50:31.904 - error: web.0 (356) socket.io [use] unknown user 2025-05-16 17:50:31.904 - error: web.0 (356) socket.io [use] unknown user 2025-05-16 17:50:32.723 - info: host.xxx instance system.adapter.vis-2.0 in version "2.9.64" started with pid 386 2025-05-16 17:50:33.521 - info: vis-2.0 (386) starting. Version 2.9.64 in /opt/iobroker/node_modules/iobroker.vis-2, node: v20.19.2, js-controller: 7.0.6 2025-05-16 17:50:33.650 - info: vis-2.0 (386) vis-2 license is OK. 2025-05-16 17:50:50.202 - info: javascript.0 (227) script.js.common.apg-json-chart: [eCharts] apg-info.0.marketprice.today.jsonChart → 0_userdata.0.visualization.echartsToday: 25 Punkte geschrieben 2025-05-16 17:50:50.236 - warn: javascript.0 (227) Read-only state "0_userdata.0.visualization.echartsToday" has been written without ack-flag with value "[{"ts":1747346400000,"val":9.301},{"ts":1747350000000,"val":9.06},{"ts":1747353600000,"val":8.813},{"ts":1747357200000,"val":8.707},{"ts":1747360800000,"val":9.094},{"ts":1747364400000,"val":9.705},{"ts":1747368000000,"val":10.911},{"ts":1747371600000,"val":11.456},{"ts":1747375200000,"val":10.331},{"ts":1747378800000,"val":7.759},{"ts":1747382400000,"val":3.647},{"ts":1747386000000,"val":0.75},{"ts":1747389600000,"val":0},{"ts":1747393200000,"val":-0.801},{"ts":1747396800000,"val":-0.343},{"ts":1747400400000,"val":2.207},{"ts":1747404000000,"val":1.65},{"ts":1747407600000,"val":7.738},{"ts":1747411200000,"val":10.495},{"ts":1747414800000,"val":12.422},{"ts":1747418400000,"val":13.791},{"ts":1747422000000,"val":13.205},{"ts":1747425600000,"val":11.692},{"ts":1747429200000,"val":10.177},{"ts":1747432800000,"val":10.177}]" 2025-05-16 17:50:50.244 - info: javascript.0 (227) script.js.common.apg-json-chart: [eCharts] apg-info.0.marketprice.tomorrow.jsonChart → 0_userdata.0.visualization.echartsTomorrow: 25 Punkte geschrieben 2025-05-16 17:50:50.245 - warn: javascript.0 (227) Read-only state "0_userdata.0.visualization.echartsTomorrow" has been written without ack-flag with value "[{"ts":1747432800000,"val":9.463},{"ts":1747436400000,"val":9.462},{"ts":1747440000000,"val":8.958},{"ts":1747443600000,"val":9.005},{"ts":1747447200000,"val":9.144},{"ts":1747450800000,"val":9.654},{"ts":1747454400000,"val":9.304},{"ts":1747458000000,"val":9.062},{"ts":1747461600000,"val":6.097},{"ts":1747465200000,"val":0.078},{"ts":1747468800000,"val":-0.008},{"ts":1747472400000,"val":-0.595},{"ts":1747476000000,"val":-0.462},{"ts":1747479600000,"val":-1.045},{"ts":1747483200000,"val":-1.175},{"ts":1747486800000,"val":-0.587},{"ts":1747490400000,"val":-0.79},{"ts":1747494000000,"val":-0.99},{"ts":1747497600000,"val":6.628},{"ts":1747501200000,"val":9.996},{"ts":1747504800000,"val":10.896},{"ts":1747508400000,"val":11.999},{"ts":1747512000000,"val":11.006},{"ts":1747515600000,"val":10.696},{"ts":1747519200000,"val":10.696}]" 2025-05-16 17:50:50.660 - info: apg-info.0 (371) Terminated (NO_ERROR): Without reason 2025-05-16 17:50:51.167 - info: apg-info.0 (371) cleaned everything up... 2025-05-16 17:50:51.191 - info: host.xxx instance system.adapter.apg-info.0 terminated with code 0 (NO_ERROR) 2025-05-16 17:54:00.220 - info: admin.0 (163) ==> Connected system.user.admin from ::ffff:192.168.72.8 2025-05-16 17:54:05.583 - info: admin.0 (163) ==> Connected system.user.admin from ::ffff:192.168.72.8 2025-05-16 17:54:11.426 - info: admin.0 (163) ==> Connected system.user.admin from ::ffff:192.168.72.8 2025-05-16 17:54:12.017 - info: admin.0 (163) ==> Connected system.user.admin from ::ffff:192.168.72.8 2025-05-16 17:54:26.728 - info: admin.0 (163) ==> Connected system.user.admin from ::ffff:192.168.72.8 2025-05-16 17:54:45.740 - info: admin.0 (163) ==> Connected system.user.admin from ::ffff:192.168.72.8 2025-05-16 17:54:59.216 - info: admin.0 (163) <== Disconnect system.user.admin from ::ffff:192.168.72.8 echarts-show 2025-05-16 17:54:59.730 - info: admin.0 (163) <== Disconnect system.user.admin from ::ffff:192.168.72.8 echarts-show 2025-05-16 17:55:05.435 - info: admin.0 (163) <== Disconnect system.user.admin from ::ffff:192.168.72.8 echarts-show 2025-05-16 17:55:05.501 - info: admin.0 (163) ==> Connected system.user.admin from ::ffff:192.168.72.8 2025-05-16 17:55:05.533 - info: admin.0 (163) <== Disconnect system.user.admin from ::ffff:192.168.72.8 echarts-show 2025-05-16 17:55:05.705 - info: admin.0 (163) ==> Connected system.user.admin from ::ffff:192.168.72.8 2025-05-16 17:55:11.731 - info: admin.0 (163) ==> Connected system.user.admin from ::ffff:192.168.72.8@michael-uray Im Browser mal den Cache gelöscht?
NUC i7 64GB mit Proxmox ---- Jarvis Infos Aktualisierungen der Doku auf Instagram verfolgen -> mcuiobroker Instagram
Wenn Euch mein Vorschlag geholfen hat, bitte rechts "^" klicken. -
@michael-uray Im Browser mal den Cache gelöscht?
@mcu sagte in eCharts Bar-Diagram Error in Chrome - ERR_BLOCKED_BY_CLIENT:
@michael-uray Im Browser mal den Cache gelöscht?
Ja, und auch in einem anonymen Fenster (PC) und auf einem anderen Gerät (Android) versucht.
-
@mcu sagte in eCharts Bar-Diagram Error in Chrome - ERR_BLOCKED_BY_CLIENT:
@michael-uray Im Browser mal den Cache gelöscht?
Ja, und auch in einem anonymen Fenster (PC) und auf einem anderen Gerät (Android) versucht.
@michael-uray Zum bar chart gibt es einige Issues. Vielleicht ist Dein Problem auch dabei, schau mal nach.
Ansonsten kannst du dort ein neues issue aufmachen.
https://github.com/ioBroker/ioBroker.echarts/issues
Hey! Du scheinst an dieser Unterhaltung interessiert zu sein, hast aber noch kein Konto.
Hast du es satt, bei jedem Besuch durch die gleichen Beiträge zu scrollen? Wenn du dich für ein Konto anmeldest, kommst du immer genau dorthin zurück, wo du zuvor warst, und kannst dich über neue Antworten benachrichtigen lassen (entweder per E-Mail oder Push-Benachrichtigung). Du kannst auch Lesezeichen speichern und Beiträge positiv bewerten, um anderen Community-Mitgliedern deine Wertschätzung zu zeigen.
Mit deinem Input könnte dieser Beitrag noch besser werden 💗
Registrieren AnmeldenSupport us
509
Online33.0k
Benutzer83.3k
Themen1.3m
Beiträge