


"Unauthorized" Meldung beim Sign in in Grafana
-
@funkydoc Dann ist deine Version schon mal alt. Bei mir läuft aktuell (das nächste Update steht an) Grafana v11.2.0 (c57667e448).
Vielleicht erstmal das System auf den aktuellen Stand bringen und danach kann man sich über Login-Probleme nochmal in Ruhe unterhalten.
Ro75.
-
Hallo Forum,
beim Versuch in Grafana über http://<IP>:3000 einzuloggen (Sign in) kommt eine "Unauthorized" Meldung in FF und Chrome. Geändert an der Konfiguration letzte Zeit wurde definitiv nichts. Auf einem Raspi 4 laufen ioBroker, InfluxDB Version 4.0.2 und Grafana. Alles sicherheitshalber nochmals aktualisiert.
Hat da jemand eine Idee? Danke und Grüße@wibear sagte in "Unauthorized" Meldung beim Sign in in Grafana:
Alles sicherheitshalber nochmals aktualisiert.
Dann geh mit grafana mal auf die 11.2 zurück. Mein Windows ist auf dem aktuellsten Stand und habe keine Login Probleme. Allerdings bin ich noch nicht auf 11.2.2
Ro75
-
@wibear sagte in "Unauthorized" Meldung beim Sign in in Grafana:
Alles sicherheitshalber nochmals aktualisiert.
Dann geh mit grafana mal auf die 11.2 zurück. Mein Windows ist auf dem aktuellsten Stand und habe keine Login Probleme. Allerdings bin ich noch nicht auf 11.2.2
Ro75
-
@ro75 sagte in "Unauthorized" Meldung beim Sign in in Grafana:
@wibear Windows 11
Ro75
Das ist der Unterschied. Wie kann ich Grafana downgraden? -
@ro75 sagte in "Unauthorized" Meldung beim Sign in in Grafana:
Schaut mal hier nach.
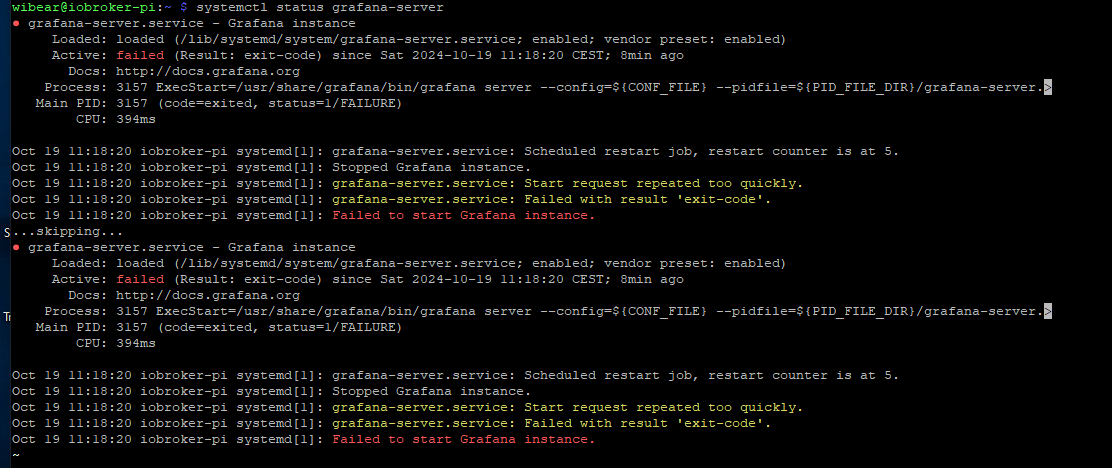
Habe die Datei geändert und wollte Grafana neu starten mit:
sudo service grafana-server restart
Jetzt läuft Grafana gar nicht mehr, auch nach dem Reboot von Raspi.
Was soll ich überprüfen? -
@ro75 sagte in "Unauthorized" Meldung beim Sign in in Grafana:
Schaut mal hier nach.
Habe die Datei geändert und wollte Grafana neu starten mit:
sudo service grafana-server restart
Jetzt läuft Grafana gar nicht mehr, auch nach dem Reboot von Raspi.
Was soll ich überprüfen? -
@wibear mal so versuchen
sudo systemctl start grafana-serverODER
sudo systemctl restart grafana-serverRo75.
-
@ro75 sagte in "Unauthorized" Meldung beim Sign in in Grafana:
dann hast du ggfs. die einen Fehler in die ini eingebaut.
Ich hab nur das geändert:

Support us
573
Online32.7k
Users82.4k
Topics1.3m
Posts