


Forecast.solar mit dem Systeminfo Adapter
-
Welche Version hat dein js-engine? Ich habe 5.0.12.
Mit dem Code wird mir Zeile 113 (watts3) unterstrichen, das dass falsch sein soll
javascript.0 2021-03-09 12:52:04.412 error (3804) at process._tickCallback (internal/process/next_tick.js:68:7) javascript.0 2021-03-09 12:52:04.411 error (3804) at script.js.Solar.SolarForcast:133:5 javascript.0 2021-03-09 12:52:04.411 error (3804) at makeTable (script.js.Solar.SolarForcast:113:65) javascript.0 2021-03-09 12:52:04.408 error (3804) script.js.Solar.SolarForcast: ReferenceError: watts3 is not defined -
@jb_sullivan ja, wirf mal das watts3 raus:
graphTimeData.push(watts1[n].Leistung + watts2[n].Leistung);Das ist von mir, ich benutze das um die Einstrahlung der Sonne in die Fenster zu schätzen und habe da 3 Seiten
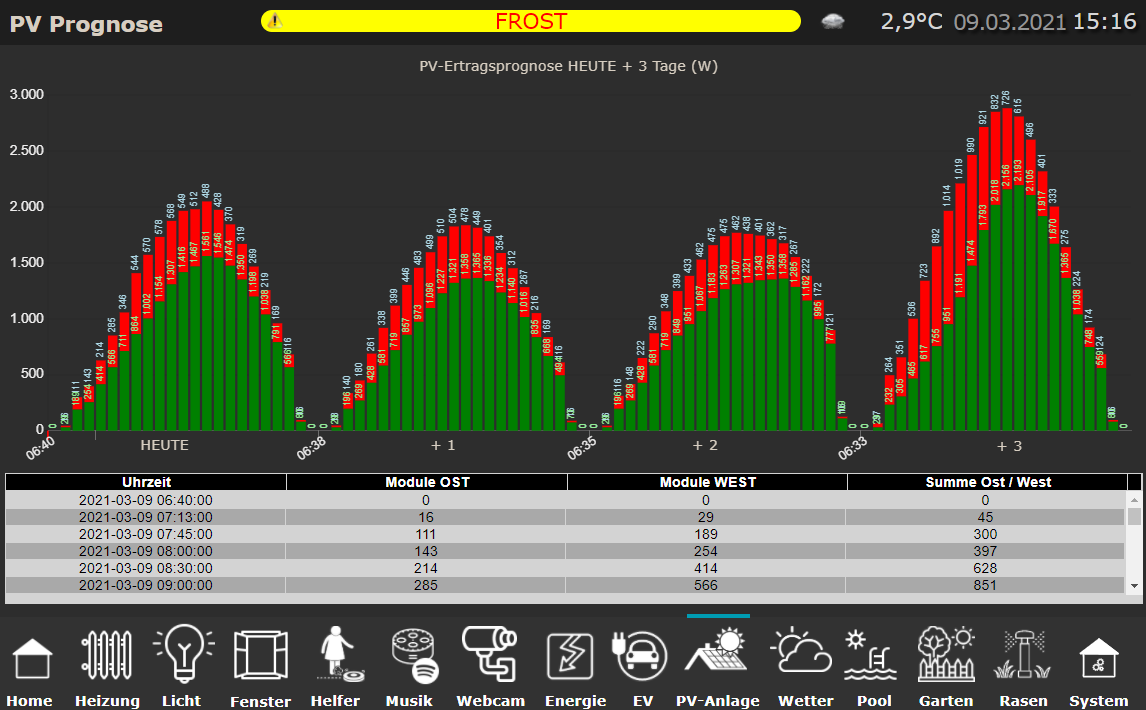
Schräg - sieht schon ziemlich gut aus - aber irgendwas ist ja immer

Vorher fand ich die Time Line etwas aufgeräumter. Beim rüber hoovern mit der Maus bekommt man ja auch eine Legende mit Zeiten angezeigt. Von daher bedarf es für mich nicht unbedingt einer X-Achse mit allen Zeiten.
ALT:

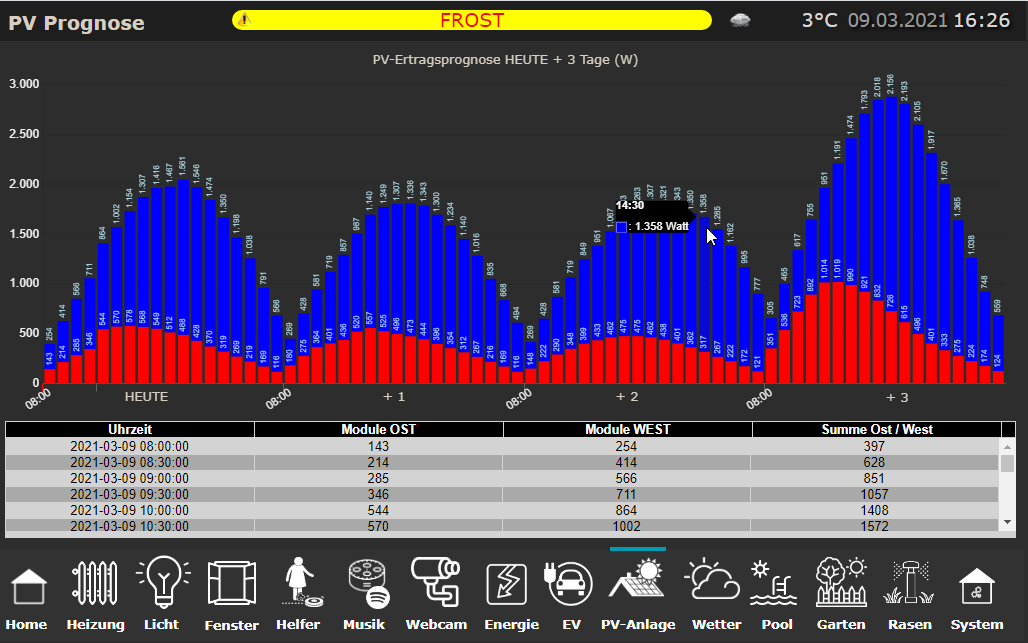
NEU:

ioBroker (since 2018) auf Intel Core i3-5005U NUC und Windwos10 Pro
-
Schräg - sieht schon ziemlich gut aus - aber irgendwas ist ja immer
Vorher fand ich die Time Line etwas aufgeräumter. Beim rüber hoovern mit der Maus bekommt man ja auch eine Legende mit Zeiten angezeigt. Von daher bedarf es für mich nicht unbedingt einer X-Achse mit allen Zeiten.
ALT:
NEU:
-
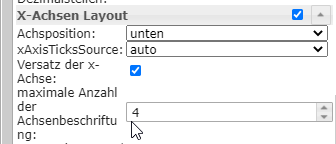
@jb_sullivan Das macht der JsonChart von alleine.
Schau mal in den Editor Porperties der x-Achse. Evtl. kannst Du da noch was einstellen. Oder ganz weglassenEinfach über die Widget Konfiguration scheint es nur begrenzt zu gehen. Allerdings kann man da wohl wieder was mit Code tweaken erzwingen wenn man spezielle Zeitabschnitte (z.B. Tag) haben will - aber da bin ich wieder raus.

EDIT: Ich sehe gerade die json Tabelle gibt es mit dem neuen Code nicht mehr? Der Datenpunkt ist leer.
ioBroker (since 2018) auf Intel Core i3-5005U NUC und Windwos10 Pro
-
Einfach über die Widget Konfiguration scheint es nur begrenzt zu gehen. Allerdings kann man da wohl wieder was mit Code tweaken erzwingen wenn man spezielle Zeitabschnitte (z.B. Tag) haben will - aber da bin ich wieder raus.
EDIT: Ich sehe gerade die json Tabelle gibt es mit dem neuen Code nicht mehr? Der Datenpunkt ist leer.
-
@jb_sullivan Sorry, hab da was zuviel auskommentiert. Ich habs in dem Code oben geändert ab Zeile 102
Jupp, geht wieder

-
@jb_sullivan Hab noch etwas rumgespielt , Es geht auch 'stacked'

Du kannst auch noch die Sekunden in der X-Achse wegfallen lassen : Zeile 117 die 12 in 5 ändern
let time = watts1[n].Uhrzeit.substr(11, 5); -
gestapelt ist auch cool - Da bekommt man in einem Balken quasi die Werte für OST / West angezeigt?
@jb_sullivan ja.
const SolarJSON1        = "javascript.0.SolarForecast.JSON1";
const SolarJSON2        = "javascript.0.SolarForecast.JSON2";
const SolarJSONAll1        = "javascript.0.SolarForecast.JSONAll1";
const SolarJSONAll2        = "javascript.0.SolarForecast.JSONAll2";
const SolarJSONGraphAll1        = "javascript.0.SolarForecast.JSONGraphAll1";
const SolarJSONGraphAll2        = "javascript.0.SolarForecast.JSONGraphAll2";
const SolarJSONTable    = "javascript.0.SolarForecast.JSONTable";
const SolarJSONGraph    = "javascript.0.SolarForecast.JSONGraph";

const creatStateList = [
    {name :SolarJSON1, type:"string", role : "value"},
    {name :SolarJSON2, type:"string", role : "value"},
    {name :SolarJSONAll1, type:"string", role : "value"},
    {name :SolarJSONAll2, type:"string", role : "value"},
    {name :SolarJSONGraphAll1, type:"string", role : "value"},
    {name :SolarJSONGraphAll2, type:"string", role : "value"},
    {name :SolarJSONTable, type:"string", role : "value"},
    {name :SolarJSONGraph, type:"string", role : "value"}
]


creatStateList.forEach (function(item) {
    createState(item.name, {
        type: item.type,
        min: 0,
        def: 0,
        role: item.role
    });
});

var request = require('request');
var options1 = {url: 'https://api.forecast.solar/estimate/xx.35/xx.24/40/90/7.26', method: 'GET', headers: { 'User-Agent': 'request' }};
var options2 = {url: 'https://api.forecast.solar/estimate/xx.35/xx.24/40/-90/2.64', method: 'GET', headers: { 'User-Agent': 'request' }};


var urls = [
  {myUrl:options1,mySolarJSON:SolarJSON1,mySolarJSONAll:SolarJSONAll1,mySolarJSONGraphAll:SolarJSONGraphAll1},
  {myUrl:options2,mySolarJSON:SolarJSON2,mySolarJSONAll:SolarJSONAll2,mySolarJSONGraphAll:SolarJSONGraphAll2}
]

var promises = urls.map(myAsyncRequest);
schedule('6 6-22 * * *', getSolar);

getSolar();


function myAsyncRequest(myUrl) {
  log('Request '+myUrl.myUrl.url);
  return new Promise((resolve, reject) => {
     request(myUrl.myUrl.url, function(error, response, body) {
        if (!error && response.statusCode == 200) {
            let today = formatDate(new Date(), 'YYYY-MM-DD');
            let watts = JSON.parse(body).result.watts;
            setState(myUrl.mySolarJSONAll, JSON.stringify(watts), true);
            let table = [];
            for(let time in watts) {
                let pos1 = time.indexOf(':00:00');
                let pos2 = time.indexOf(':30:00');
                if((pos1 != -1) || (pos2 != -1)) {
                    let entry = {};
                    entry.Uhrzeit = time;
                    entry.Leistung = watts[time];
                    table.push(entry);
                }
            }
            log ('JSON: '+myUrl.mySolarJSON);
            setState(myUrl.mySolarJSON, JSON.stringify(table), true);
        // make GraphTable

            let graphTimeData = [];

                for(let time in watts) {
                    let graphEntry ={};
                    graphEntry.t = Date.parse(time);
                    graphEntry.y = watts[time];
                    graphTimeData.push(graphEntry);
            }
            var graph = {};
            var graphData ={};
            var graphAllData = [];
            graphData.data = graphTimeData;
            graphAllData.push(graphData);
            graph.graphs=graphAllData;
            setState(myUrl.mySolarJSONGraphAll, JSON.stringify(graph), true);

            resolve (body);
        }
    });
  })
}

function makeTable () {
    log ('MakeTable');
    let watts1 = JSON.parse(getState(SolarJSON1).val);
    let watts2 = JSON.parse(getState(SolarJSON2).val);
    log ('Items: '+watts1.length);
    let today = formatDate(new Date(), 'YYYY-MM-DD');
    let table = [];
    let graphTimeData = [];
	let axisLabels = [];

    for(var n=0;n<watts1.length;n++) {
            let entry = {};
            let graphEntry ={};
            let thisTime = watts1[n].Uhrzeit;
            entry.Uhrzeit = watts1[n].Uhrzeit;
            entry.Leistung1 = watts1[n].Leistung;
            entry.Leistung2 = watts2[n].Leistung;
            entry.Summe = watts1[n].Leistung + watts2[n].Leistung;
            table.push(entry);
			 /*
            graphEntry.t = Date.parse(thisTime);
            graphEntry.y = watts1[n].Leistung + watts2[n].Leistung;
            graphTimeData.push(graphEntry);
			graphTimeData.push(watts1[n].Leistung + watts2[n].Leistung);
            let time = watts1[n].Uhrzeit.substr(11, 12);
            axisLabels.push(time);
			*/
    }

	let graphTimeData1 = [];
    for(var n=0;n<watts1.length;n++) {
    	graphTimeData1.push(watts1[n].Leistung);
        let time = watts1[n].Uhrzeit.substr(11,5);
        axisLabels.push(time);
    }

	let graphTimeData2 = [];
    for(var n=0;n<watts2.length;n++) {
   		graphTimeData2.push(watts2[n].Leistung);
    }


    var graph = {};
    var graphAllData = [];
    var graphData = {"legendText": "West","yAxis_id": 1,"type": "bar","displayOrder": 1,"barIsStacked": true,"color":"green","barStackId":1,"datalabel_rotation":-90,"datalabel_color":"lightgreen","datalabel_fontSize":10};
    graphData.data = graphTimeData1;
    graphAllData.push(graphData);
	graphData = {"legendText": "Ost","yAxis_id": 1,"type": "bar","displayOrder": 1,"barIsStacked": true,"color":"red","barStackId":1,"datalabel_rotation":-90,"datalabel_color":"lightblue","datalabel_fontSize":10};
    graphData.data = graphTimeData2;
    graphAllData.push(graphData);
    graph.graphs=graphAllData;
	graph.axisLabels =  axisLabels;
    setState(SolarJSONTable, JSON.stringify(table), true);
    setState(SolarJSONGraph, JSON.stringify(graph), true);
}

function getSolar() {
  Promise.all(promises)
  .then(function(bodys) {
    console.log("All url loaded");
    makeTable();
  })
}
Bei "legendText" musst Du noch schauen , welcher Ost und West ist
-
@gargano MEGA !!!
Da kann man gleich sehen wann von welcher Dachseite mit welchem Ertrag zu rechnen ist
-
@jb_sullivan Wie hast Du denn die x-Achse hinbekommen ?
Ich hab oben nochmal geändert wegen Legende , wenn Du magstX-Achse ist getrickst - "Heute +1 , +2, +3" sind einfache VIS Textfelder und die Werte habe ich im Widget begrenzt.
Wie kann man die Darstellung drehen? Also die Stapelwerte mit der höheren Wertigkeit (WEST) nach hinten und die niederen (OST) nach vorne?
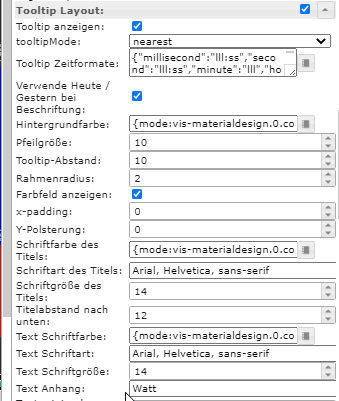
Außerdem scheint im Widget ein kleiner BUG zu sein. Wenn man im Tooltip Layout "text Anhang" auswählt und etwas einträgt, wird das nirgends hinzu gefügt.
ioBroker (since 2018) auf Intel Core i3-5005U NUC und Windwos10 Pro
-
X-Achse ist getrickst - "Heute +1 , +2, +3" sind einfache VIS Textfelder und die Werte habe ich im Widget begrenzt.
Wie kann man die Darstellung drehen? Also die Stapelwerte mit der höheren Wertigkeit (WEST) nach hinten und die niederen (OST) nach vorne?
Außerdem scheint im Widget ein kleiner BUG zu sein. Wenn man im Tooltip Layout "text Anhang" auswählt und etwas einträgt, wird das nirgends hinzu gefügt.
@jb_sullivan Also oben und unten vertauschen ?
Einfach displayOrder ändern in 2 und 1 in Zeile 136 und 139
-
X-Achse ist getrickst - "Heute +1 , +2, +3" sind einfache VIS Textfelder und die Werte habe ich im Widget begrenzt.
Wie kann man die Darstellung drehen? Also die Stapelwerte mit der höheren Wertigkeit (WEST) nach hinten und die niederen (OST) nach vorne?
Außerdem scheint im Widget ein kleiner BUG zu sein. Wenn man im Tooltip Layout "text Anhang" auswählt und etwas einträgt, wird das nirgends hinzu gefügt.
-
@jb_sullivan ToolTip Anhang geht auch im Script :
"tooltip_AppendText": " kWh"
Wieder in Zeile 136 und 139 voranstellen.
Ich bin glücklich !!!! Super alles so wie ich es mir vorgestellt hatte - PERFEKT !!!
Deine Änderungen haben auch gegriffen - aber trotzdem bleibt aus dem Widget heraus der BUG bestehen das er die Eingabe nicht annimmt. Wenn man es über Script macht so wie du oben geschrieben hast - dann funktioniert es. Aber wie gesagt aus dem Widget heraus nicht (zumindest bei mir)
ioBroker (since 2018) auf Intel Core i3-5005U NUC und Windwos10 Pro
-
Ich bin glücklich !!!! Super alles so wie ich es mir vorgestellt hatte - PERFEKT !!!
Deine Änderungen haben auch gegriffen - aber trotzdem bleibt aus dem Widget heraus der BUG bestehen das er die Eingabe nicht annimmt. Wenn man es über Script macht so wie du oben geschrieben hast - dann funktioniert es. Aber wie gesagt aus dem Widget heraus nicht (zumindest bei mir)
-
@jb_sullivan Das Widget ist vom Scrounger.
Wenn Du magst, kannst ein Issue im Github aufmachen.Ja werde ich mal machen. Was mir gerade auffällt - hast du noch was an den Zeiten geändert?
Bei dem Diagramm weiter oben (#112) hat das Diagramm quasi genau so begonnen und geendet, wie aus den Rohdaten auch kommt - jetzt sind alle Diagramme fix von 8:00 bis 16:30 Uhr formatiert.
ioBroker (since 2018) auf Intel Core i3-5005U NUC und Windwos10 Pro
-
Ja werde ich mal machen. Was mir gerade auffällt - hast du noch was an den Zeiten geändert?
Bei dem Diagramm weiter oben (#112) hat das Diagramm quasi genau so begonnen und geendet, wie aus den Rohdaten auch kommt - jetzt sind alle Diagramme fix von 8:00 bis 16:30 Uhr formatiert.
@jb_sullivan Man kann ja nur die Summe von gleichen Zeiten bilden. Daher die Begrenzung auf 00:00 und 30:00. War ja früher auch so.
Wenn Du mal schaust , wie die Rohdaten ausschauen und eine evtl. Ungenauigkeit in den Zeiten verschmerzen kannst, dann kommentiere die Zeilen 59if((pos1 != -1) || (pos2 != -1)) {und 64 aus.
} -
@gargano wenn ich das so auskomatiere, spuckt mir der script Editor den folgenden Fehler aus.

@jb_sullivan Zeig mal bitte den Code.
(nur die beiden Zeilen auskommentieren mit //. Nicht den ganzen Block)
Hello! It looks like you're interested in this conversation, but you don't have an account yet.
Getting fed up of having to scroll through the same posts each visit? When you register for an account, you'll always come back to exactly where you were before, and choose to be notified of new replies (either via email, or push notification). You'll also be able to save bookmarks and upvote posts to show your appreciation to other community members.
With your input, this post could be even better 💗
Register Login617
Online32.7k
Users82.6k
Topics1.3m
Posts