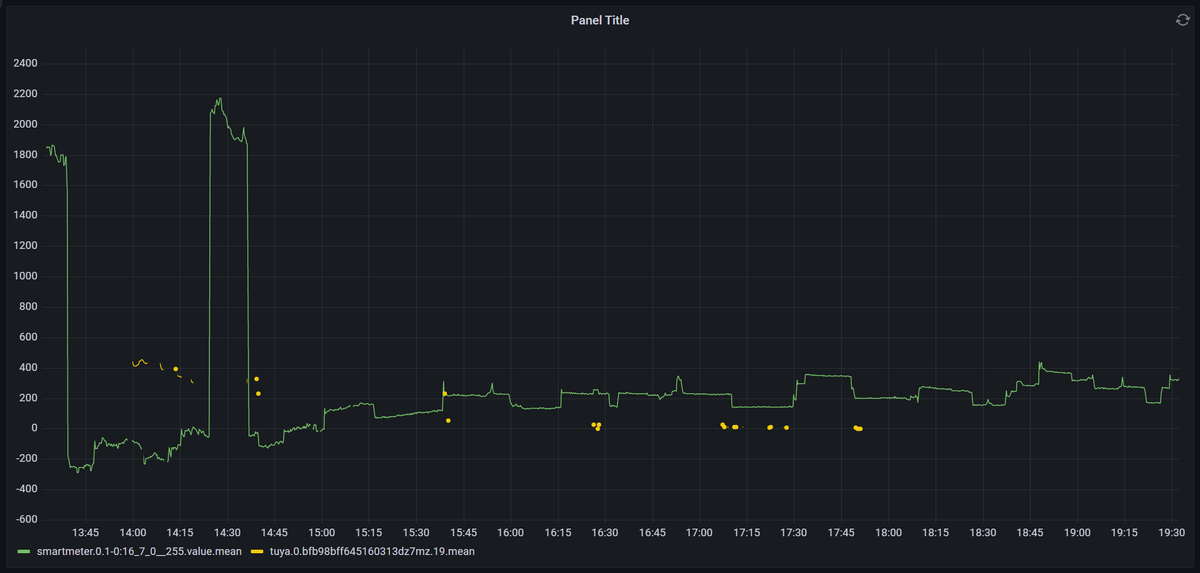
Nein, keinen X-Server.. mit Grafana, läuft gschmeidig! ")
Hier der Diag Output:
======== Start marking the full check here =========
Skript v.2023-01-02
*** BASE SYSTEM ***
Model : Raspberry Pi Model B Rev 2
Architecture: armv6l
Docker: false
Virtualization: none
Distributor ID: Raspbian
Description: Raspbian GNU/Linux 11 (bullseye)
Release: 11
Codename: bullseye
PRETTY_NAME="Raspbian GNU/Linux 11 (bullseye)"
NAME="Raspbian GNU/Linux"
VERSION_ID="11"
VERSION="11 (bullseye)"
VERSION_CODENAME=bullseye
ID=raspbian
ID_LIKE=debian
HOME_URL="http://www.raspbian.org/"
SUPPORT_URL="http://www.raspbian.org/RaspbianForums"
BUG_REPORT_URL="http://www.raspbian.org/RaspbianBugs"
Systemuptime and Load:
20:12:39 up 2 days, 5:36, 2 users, load average: 3.66, 3.69, 3.79
CPU threads: 2
*** Time and Time Zones ***
Fri Mar 17 19:12:39 UTC 2023
Fri Mar 17 20:12:39 CET 2023
CET +0100
Europe/Berlin
*** User and Groups ***
pi
/home/pi
pi adm dialout cdrom sudo audio video plugdev games users input render netdev lpadmin gpio i2c spi iobroker
*** X-Server-Setup ***
X-Server: false
Desktop:
Terminal: tty
Boot Target: graphical.target
*** MEMORY ***
total used free shared buff/cache available
Mem: 429M 211M 100M 0.0K 118M 173M
Swap: 1.1G 345M 778M
Total: 1.6G 556M 879M
429 M total memory
211 M used memory
137 M active memory
145 M inactive memory
99 M free memory
9 M buffer memory
108 M swap cache
1123 M total swap
345 M used swap
778 M free swap
*** FILESYSTEM ***
df: /mnt/nfs: Host is down
Filesystem Type Size Used Avail Use% Mounted on
/dev/root ext4 7.1G 6.6G 167M 98% /
devtmpfs devtmpfs 87M 0 87M 0% /dev
tmpfs tmpfs 215M 0 215M 0% /dev/shm
tmpfs tmpfs 86M 1008K 85M 2% /run
tmpfs tmpfs 5.0M 4.0K 5.0M 1% /run/lock
/dev/mmcblk0p1 vfat 255M 51M 205M 20% /boot
tmpfs tmpfs 43M 16K 43M 1% /run/user/1000
Messages in dmesg:
[Wed Mar 15 14:35:56 2023] Kernel command line: coherent_pool=1M snd_bcm2835.enable_compat_alsa=0 snd_bcm2835.enable_hdmi=1 video=Composite-1:720x480@60i vc_mem.mem_base=0x1ec00000 vc_mem.mem_size=0x20000000 console=ttyAMA0,115200 console=tty1 root=PARTUUID=cc9d61f0-02 rootfstype=ext4 fsck.repair=yes rootwait quiet splash plymouth.ignore-serial-consoles
[Wed Mar 15 14:35:59 2023] EXT4-fs (mmcblk0p2): mounted filesystem with ordered data mode. Opts: (null). Quota mode: none.
[Wed Mar 15 14:35:59 2023] VFS: Mounted root (ext4 filesystem) readonly on device 179:2.
[Wed Mar 15 14:36:08 2023] EXT4-fs (mmcblk0p2): re-mounted. Opts: (null). Quota mode: none.
Show mounted filesystems (real ones only):
TARGET SOURCE FSTYPE OPTIONS
/ /dev/mmcblk0p2 ext4 rw,noatime
|-/boot /dev/mmcblk0p1 vfat rw,relatime,fmask=0022,dmask=0022,codepage=437,iocharset=ascii,shortname=mixed,errors=remount-ro
`-/mnt/nfs //192.168.2.1/backup cifs rw,relatime,vers=1.0,cache=strict,username=backup,domain=NAS,uid=0,noforceuid,gid=0,noforcegid,addr=192.168.2.1,soft,unix,posixpaths,serverino,mapposix,acl,rsize=61440,wsize=65536,bsize=1048576,echo_interval=60,actimeo=1
Files in neuralgic directories:
/var:
1.6G /var/
1.1G /var/log
758M /var/log/journal/095ae9a8b4eb4c7cb71d821a78a34687
758M /var/log/journal
210M /var/lib
/opt/iobroker/backups:
4.0K /opt/iobroker/backups/
/opt/iobroker/iobroker-data:
47M /opt/iobroker/iobroker-data/
27M /opt/iobroker/iobroker-data/backup-objects
15M /opt/iobroker/iobroker-data/files
13M /opt/iobroker/iobroker-data/files/admin.admin/custom/static/js
13M /opt/iobroker/iobroker-data/files/admin.admin/custom/static
The five largest files in iobroker-data are:
6.3M /opt/iobroker/iobroker-data/files/admin.admin/custom/static/js/vendors-node_modules_iobroker_adapter-react-v5_assets_devices_parseNames_js-node_modules_iobr-99c23e.847b8ad9.chunk.js.map
3.5M /opt/iobroker/iobroker-data/objects.jsonl
2.8M /opt/iobroker/iobroker-data/files/admin.admin/custom/static/js/vendors-node_modules_iobroker_adapter-react-v5_assets_devices_parseNames_js-node_modules_iobr-99c23e.847b8ad9.chunk.js
2.6M /opt/iobroker/iobroker-data/states.jsonl
1.6M /opt/iobroker/iobroker-data/files/admin.admin/custom/static/js/vendors-node_modules_mui_material_Accordion_index_js-node_modules_mui_material_AccordionDetai-57e02d.0886b730.chunk.js.map
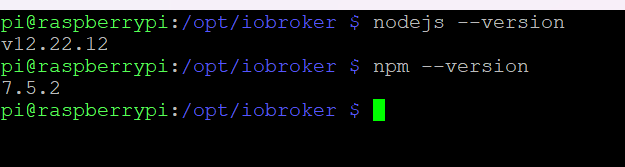
*** NodeJS-Installation ***
/usr/bin/nodejs v12.22.12
/usr/bin/node v12.22.12
/usr/bin/npm 7.5.2
/usr/bin/npx 7.5.2
nodejs:
Installed: 12.22.12~dfsg-1~deb11u1
Candidate: 12.22.12~dfsg-1~deb11u3
Version table:
12.22.12~dfsg-1~deb11u3 500
500 http://raspbian.raspberrypi.org/raspbian bullseye/main armhf Packages
*** 12.22.12~dfsg-1~deb11u1 100
100 /var/lib/dpkg/status
Temp directories causing npm8 problem: 0
*** ioBroker-Installation ***
ioBroker Status
iobroker is running on this host.
Objects type: jsonl
States type: jsonl
Core adapters versions
js-controller: 4.0.24
admin: 6.3.5
javascript: "javascript" not found
Adapters from github: 0
Adapter State
+ system.adapter.admin.0 : admin : raspberrypi - enabled, port: 8081, bind: 0.0.0.0, run as: admin
+ system.adapter.backitup.0 : backitup : raspberrypi - enabled
+ system.adapter.discovery.0 : discovery : raspberrypi - enabled
+ system.adapter.influxdb.0 : influxdb : raspberrypi - enabled, port: 8086
+ system.adapter.smartmeter.0 : smartmeter : raspberrypi - enabled
+ system.adapter.tuya.0 : tuya : raspberrypi - enabled
+ instance is alive
Enabled adapters with bindings
+ system.adapter.admin.0 : admin : raspberrypi - enabled, port: 8081, bind: 0.0.0.0, run as: admin
+ system.adapter.influxdb.0 : influxdb : raspberrypi - enabled, port: 8086
ioBroker-Repositories
stable : http://download.iobroker.net/sources-dist.json
beta : http://download.iobroker.net/sources-dist-latest.json
Active repo(s): stable
Installed ioBroker-Instances
Unable to increase LUA script timeout: Connection is closed.
Cannot determine Set feature status: Connection is closed.
Connection is closed.
Uncaught Rejection: Error: States DB is not allowed to start in the current Multihost environment
at Redis.<anonymous> (/opt/iobroker/node_modules/@iobroker/db-states-redis/lib/states/statesInRedisClient.js:579:23)
at processTicksAndRejections (internal/process/task_queues.js:97:5)
Unable to subscribe to expiry Keyspace events from Redis Server: Connection is closed.
Unable to subscribe to evicted Keyspace events from Redis Server: Connection is closed.
Unable to subscribe to meta namespace "meta." changes: Connection is closed.
Objects and States
Please stand by - This may take a while
Objects: 283
States: 223
*** OS-Repositories and Updates ***
W: An error occurred during the signature verification. The repository is not updated and the previous index files will be used. GPG error: https://packages.grafana.com/enterprise/deb stable InRelease: The following signatures couldn't be verified because the public key is not available: NO_PUBKEY 9E439B102CF3C0C6
W: Failed to fetch https://packages.grafana.com/enterprise/deb/dists/stable/InRelease The following signatures couldn't be verified because the public key is not available: NO_PUBKEY 9E439B102CF3C0C6
W: Some index files failed to download. They have been ignored, or old ones used instead.
Hit:1 http://archive.raspberrypi.org/debian bullseye InRelease
Hit:2 http://raspbian.raspberrypi.org/raspbian bullseye InRelease
Get:3 https://packages.grafana.com/enterprise/deb stable InRelease [5984 B]
Err:3 https://packages.grafana.com/enterprise/deb stable InRelease
The following signatures couldn't be verified because the public key is not available: NO_PUBKEY 9E439B102CF3C0C6
Reading package lists...
W: An error occurred during the signature verification. The repository is not updated and the previous index files will be used. GPG error: https://packages.grafana.com/enterprise/deb stable InRelease: The following signatures couldn't be verified because the public key is not available: NO_PUBKEY 9E439B102CF3C0C6
W: Failed to fetch https://packages.grafana.com/enterprise/deb/dists/stable/InRelease The following signatures couldn't be verified because the public key is not available: NO_PUBKEY 9E439B102CF3C0C6
W: Some index files failed to download. They have been ignored, or old ones used instead.
Pending Updates: 116
*** Listening Ports ***
Active Internet connections (only servers)
Proto Recv-Q Send-Q Local Address Foreign Address State User Inode PID/Program name
tcp 0 0 127.0.0.1:8088 0.0.0.0:* LISTEN 116 10601 336/influxd
tcp 0 0 127.0.0.1:9001 0.0.0.0:* LISTEN 1001 13841 337/iobroker.js-con
tcp 0 0 127.0.0.1:9000 0.0.0.0:* LISTEN 1001 13865 337/iobroker.js-con
tcp 0 0 0.0.0.0:22 0.0.0.0:* LISTEN 0 11782 370/sshd: /usr/sbin
tcp 0 0 127.0.0.1:631 0.0.0.0:* LISTEN 0 790991 5054/cupsd
tcp6 0 0 :::3000 :::* LISTEN 117 14015 333/grafana-server
tcp6 0 0 ::1:631 :::* LISTEN 0 790990 5054/cupsd
tcp6 0 0 :::8081 :::* LISTEN 1001 18615 613/io.admin.0
tcp6 0 0 :::8086 :::* LISTEN 116 14073 336/influxd
tcp6 0 0 :::22 :::* LISTEN 0 11797 370/sshd: /usr/sbin
udp 0 0 0.0.0.0:68 0.0.0.0:* 0 13745 275/dhcpcd
udp 0 0 0.0.0.0:631 0.0.0.0:* 0 791052 5055/cups-browsed
udp 0 0 0.0.0.0:5353 0.0.0.0:* 108 9876 240/avahi-daemon: r
udp 0 0 0.0.0.0:51437 0.0.0.0:* 108 9878 240/avahi-daemon: r
udp 0 0 0.0.0.0:6666 0.0.0.0:* 1001 507125 4252/io.tuya.0
udp 0 0 0.0.0.0:6667 0.0.0.0:* 1001 507126 4252/io.tuya.0
udp6 0 0 :::5353 :::* 108 9877 240/avahi-daemon: r
udp6 0 0 :::33319 :::* 108 9879 240/avahi-daemon: r
*** Log File - Last 25 Lines ***
2023-03-17 20:41:04.365 - info: smartmeter.0 (627) Received 5 values, 2 updated
2023-03-17 20:41:05.076 - info: smartmeter.0 (627) Received 5 values, 2 updated
2023-03-17 20:41:05.095 - info: smartmeter.0 (627) Received 5 values, 2 updated
2023-03-17 20:41:05.586 - info: smartmeter.0 (627) Received 5 values, 2 updated
2023-03-17 20:41:06.604 - info: smartmeter.0 (627) Received 5 values, 2 updated
2023-03-17 20:41:06.778 - info: smartmeter.0 (627) Received 5 values, 2 updated
2023-03-17 20:41:09.967 - info: smartmeter.0 (627) Received 5 values, 2 updated
2023-03-17 20:41:10.042 - info: smartmeter.0 (627) Received 5 values, 2 updated
2023-03-17 20:41:10.813 - info: smartmeter.0 (627) Received 5 values, 2 updated
2023-03-17 20:41:10.833 - info: smartmeter.0 (627) Received 5 values, 2 updated
2023-03-17 20:41:11.909 - info: smartmeter.0 (627) Received 5 values, 2 updated
2023-03-17 20:41:13.799 - info: smartmeter.0 (627) Received 5 values, 2 updated
2023-03-17 20:41:13.864 - info: smartmeter.0 (627) Received 5 values, 2 updated
2023-03-17 20:41:15.605 - info: smartmeter.0 (627) Received 5 values, 2 updated
2023-03-17 20:41:15.628 - info: smartmeter.0 (627) Received 5 values, 2 updated
2023-03-17 20:41:19.115 - info: smartmeter.0 (627) Received 5 values, 2 updated
2023-03-17 20:41:19.176 - info: smartmeter.0 (627) Received 5 values, 2 updated
2023-03-17 20:41:21.023 - info: smartmeter.0 (627) Received 5 values, 2 updated
2023-03-17 20:41:22.533 - info: smartmeter.0 (627) Received 5 values, 2 updated
2023-03-17 20:41:23.090 - info: smartmeter.0 (627) Received 5 values, 2 updated
2023-03-17 20:41:25.215 - info: smartmeter.0 (627) Received 5 values, 2 updated
2023-03-17 20:41:25.812 - info: smartmeter.0 (627) Received 5 values, 2 updated
2023-03-17 20:41:25.854 - info: smartmeter.0 (627) Received 5 values, 2 updated
2023-03-17 20:41:26.374 - info: smartmeter.0 (627) Received 5 values, 2 updated
2023-03-17 20:41:27.760 - info: smartmeter.0 (627) Received 5 values, 2 updated
============ Mark until here for C&P =============
iob diag has finished.