Navigation

    Logo
    • Register
    • Login
    • Search
    • Recent
    • Tags
    • Unread
    • Categories
    • Unreplied
    • Popular
    • GitHub
    • Docu
    • Hilfe
    1. Home
    2. thopark

    NEWS

    • Amazon Alexa - ioBroker Skill läuft aus ?

    • Monatsrückblick – September 2025

    • Neues Video "KI im Smart Home" - ioBroker plus n8n

    • Profile
    • Following 0
    • Followers 0
    • Topics 0
    • Posts 1
    • Best 0
    • Groups 0

    thopark

    @thopark

    0
    Reputation
    5
    Profile views
    1
    Posts
    0
    Followers
    0
    Following
    Joined Last Online

    thopark Follow

    Latest posts made by thopark

    • RE: Heizkurve visualisieren

      @loemic Ich komme der Sache näher.
      Ich habe das Plugin "Plotly-Panel" installiert: https://grafana.com/grafana/plugins/ae3e-plotly-panel/

      Konfiguration Layout:

      {
        "xaxis": {
          "type": "number",
          "autorange": "reversed"
        }
      }
      

      Script:

      const xData = Array.from({length:35},(v,i)=>20-i);
      const paraV = data.series[0].fields[1].values.buffer[0];
      const endpunkt = data.series[1].fields[1].values.buffer[0];
      const abwRL = data.series[2].fields[1].values.buffer[0];
      const rtSoll = paraV;
      const neigung = (endpunkt-rtSoll) / (rtSoll+15);
      const niveau = abwRL;
      const yData = xData.map(x => {
        const dar = (x - rtSoll);
        return rtSoll + niveau - neigung * dar * (1.4347 + 0.021 * dar + 247.9 * 10E-6 * Math.exp(dar,2));
      }
      );
      
      var trace = {
        x: xData,
        y: yData
      };
        
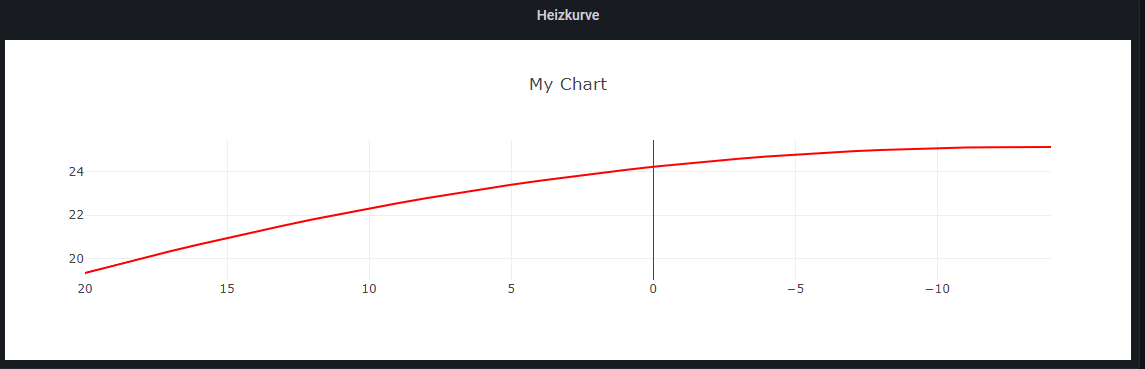
      return {data:[trace],layout:{title:'My Chart'}};
      

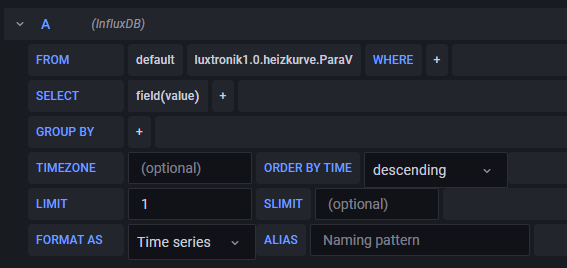
      Die Werte kommen in drei Datenserien rein (exemplarisch eine als Screenshot):
      e508dac7-f9f3-48b8-b882-7fe2c62f2a0b-image.png

      Die Formel stammt von hier: https://www.viessmann-community.com/t5/Gas/Mathematische-Formel-fuer-Vorlauftemperatur-aus-den-vier/m-p/68890#M27556

      Bei der Berechnung der Neigung bin ich mir noch nicht gant klar, wie die korrekt sein muss.

      Das Ergebnis sieht so aus:
      0d7b9a40-edf1-4c29-b42e-e9ed106c1c5f-image.png

      posted in Visualisierung
      thopark
      thopark
    Community
    Impressum | Datenschutz-Bestimmungen | Nutzungsbedingungen
    The ioBroker Community 2014-2023
    logo